[Preprint]. 2024 Jul 13:2024.07.09.602608.
doi: 10.1101/2024.07.09.602608.

Resolving the chromatin impact of mosaic variants with targeted Fiber-seq

Affiliations

Resolving the chromatin impact of mosaic variants with targeted Fiber-seq

Stephanie C Bohaczuk et al. bioRxiv. .

Update in

Abstract

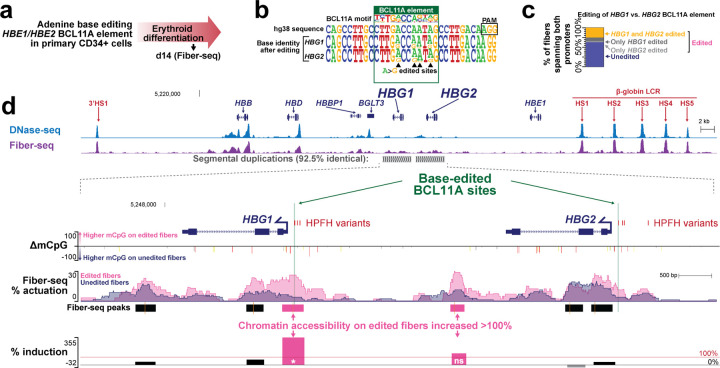
Accurately quantifying the functional consequences of non-coding mosaic variants requires the pairing of DNA sequence with both accessible and closed chromatin architectures along individual DNA molecules-a pairing that cannot be achieved using traditional fragmentation-based chromatin assays. We demonstrate that targeted single-molecule chromatin fiber sequencing (Fiber-seq) achieves this, permitting single-molecule, long-read genomic and epigenomic profiling across targeted >100 kilobase loci with ~10-fold enrichment over untargeted sequencing. Targeted Fiber-seq reveals that pathogenic expansions of the DMPK CTG repeat that underlie Myotonic Dystrophy 1 are characterized by somatic instability and disruption of multiple nearby regulatory elements, both of which are repeat length-dependent. Furthermore, we reveal that therapeutic adenine base editing of the segmentally duplicated γ-globin (HBG1/HBG2) promoters in primary human hematopoietic cells induced towards an erythroblast lineage increases the accessibility of the HBG1 promoter as well as neighboring regulatory elements. Overall, we find that these non-protein coding mosaic variants can have complex impacts on chromatin architectures, including extending beyond the regulatory element harboring the variant.


Conflict of interest statement

Competing interest statement A.B.S. is a co-inventor on a patent relating to the Fiber-seq method (US17/995,058). A.L. is an academic co-founder of Ensoma Inc. The remaining authors declare no competing financial interests.

Figures

Figure 1.
Figure 1.. Targeted Fiber-seq methodology.
a) Schematic of targeted Fiber-seq protocol. b) Fiber-seq percent actuation (red), ENCODE DNase I-seq (blue), and per-base targeted fiber-seq coverage are shown across targeted loci. c) Violin plot of per-base coverage over the targeted regions, compared to a non-targeted region (chr14:20283833–20402650, hg38). d) Relative enrichment of targeted loci relative to WGS (Methods). e) Relative enrichment across all samples and targets. f) Zoom-in of an illustrative locus showing m6A events (purple ticks) across individual fibers.
Figure 2.
Figure 2.. Haplotype-resolved chromatin accessibility and CpG methylation at the DMPK 3’ UTR CTG expansion in DM1 fibroblasts.
a) Family pedigree representing fibroblast donors. Labels inside each shape represent CTG copy number within the pathogenic and normal allele, respectively. b) CTG count across sequencing reads that fully span the CTG repeats, grouped by haplotypes. The red dashed line at 35 represents the threshold above which CTG expansions are unstable. c) Browser tracks comparing the chromatin architecture of the normal haplotypes to the expanded haplotypes from generations II/III and generation I. The difference in CpG methylation is compared (yellow- p<0.01, orange- p<0.001, red- p<0.0001, Fisher’s exact test), as well as percent actuation of the normal (light blue), generations II/III expanded (red), and generation I expanded (green) haplotypes. Fiber-seq peaks from the normal haplotypes are shown below and are colored to represent a statistically significant decrease in chromatin accessibility on the generation II/III haplotypes (red) compared to normal. There were no significant changes between the normal and generation I (green) expanded haplotype. ENCODE DNase-seq and CTCF ChIP-seq are above in blue and gray, respectively. d) CTCF footprinting at the CTG-adjacent CTCF binding site. Footprints were classified as accessible if they were fully overlapped by a methylation sensitive patch, and accessible footprints were classified as CTCF-bound if they did not contain any m6A. (p=0.010, Fisher’s exact test comparing CTCF-bound to unbound [inaccessible plus accessible but unbound]). e) Volcano plot of chromatin actuation difference at each accessible peak from the normal haplotype peak set within the targeted locus, compared between normal and expanded fibers from generation I (green) and generations II/III (red). The two peaks with increased accessibility in expanded fibers (upper right quadrant) are likely explained by SNPs local to each region (Supplemental Note). P-values were calculated by Fisher’s exact test. The gray dashed horizontal line indicates the nominal significance threshold (p<0.05), and the purple dashed line indicates the Benjamini-Hochberg FDR-corrected significance threshold. f) Plot of CpG methylation difference vs. chromatin actuation difference at the peaks described in e. Significant and non-significant points from e are shown in red and gray, respectively.
Figure 3.
Figure 3.. Therapeutic base editing of a BCL11A element within the HBG1/HBG2 promoters.
a) Schematic of the experimental paradigm. b) Sequence logo showing base editing within the BCL11A binding site in the HBG1 and HBG2 promoters. Letter height corresponds to the relative base frequency. c) Percent of fibers with edited BCL11A sites in both HBG1 and HBG2 (yellow), HBG1 only (dark gray), HBG2 only (light gray), and neither (blue). The top three categories are grouped as “edited” reads in d. d) UCSC browser tracks of ABE-edited CD34+-derived erythroid cells. (Top) Comparison of ENCODE DNase-seq of treated multipotent progenitor cells (blue) and chromatin accessibility (Fiber-seq FIRE) of CD34+ derived erythroids (purple) across all fibers mapping within the targeted region. (Bottom) Zoom-in with comparison of edited and unedited fibers across HBG1 and HBG2. The difference in CpG methylation is compared (unedited minus edited, yellow- p<0.01, orange- p<0.001, red- p<0.0001, Fisher’s exact test), as well as percent actuation of unedited fibers (blue), and HBG1 and/or HBG2 edited fibers (pink). Peak calls for edited reads and percent induction at each peak ([edited percent actuated - unedited percent actuated] / unedited percent actuated) are displayed at the bottom. Pink peaks and bars represent >100% induction. * indicates statistical significance (Fisher’s exact test with Benjamini-Hochberg corrected FDR < 5%, Supplemental Fig. S9).

References

    1. Abdulhay NJ, McNally CP, Hsieh LJ, Kasinathan S, Keith A, Estes LS, Karimzadeh M, Underwood JG, Goodarzi H, Narlikar GJ, et al. 2020. Massively multiplex single-molecule oligonucleosome footprinting. Elife 9. 10.7554/eLife.59404. - DOI - PMC - PubMed
    1. Akinsheye I, Alsultan A, Solovieff N, Ngo D, Baldwin CT, Sebastiani P, Chui DHK, Steinberg MH. 2011. Fetal hemoglobin in sickle cell anemia. Blood 118: 19–27. - PMC - PubMed
    1. Alriyami M, Polychronakos C. 2021. Somatic Mutations and Autoimmunity. Cells 10. 10.3390/cells10082056. - DOI - PMC - PubMed
    1. Altemose N, Maslan A, Smith OK, Sundararajan K, Brown RR, Mishra R, Detweiler AM, Neff N, Miga KH, Straight AF, et al. 2022. DiMeLo-seq: a long-read, single-molecule method for mapping protein-DNA interactions genome wide. Nat Methods 19: 711–723. - PMC - PubMed
    1. Amato A, Cappabianca MP, Perri M, Zaghis I, Grisanti P, Ponzini D, Di Biagio P. 2014. Interpreting elevated fetal hemoglobin in pathology and health at the basic laboratory level: new and known γ-gene mutations associated with hereditary persistence of fetal hemoglobin. Int J Lab Hematol 36: 13–19. - PubMed

Publication types

LinkOut - more resources