[Preprint]. 2024 Jul 8:2024.07.08.602496.
doi: 10.1101/2024.07.08.602496.

Cerebellar output neurons impair non-motor behaviors by altering development of extracerebellar connectivity

Affiliations

Cerebellar output neurons impair non-motor behaviors by altering development of extracerebellar connectivity

Andrew S Lee et al. bioRxiv. .

Update in

Abstract

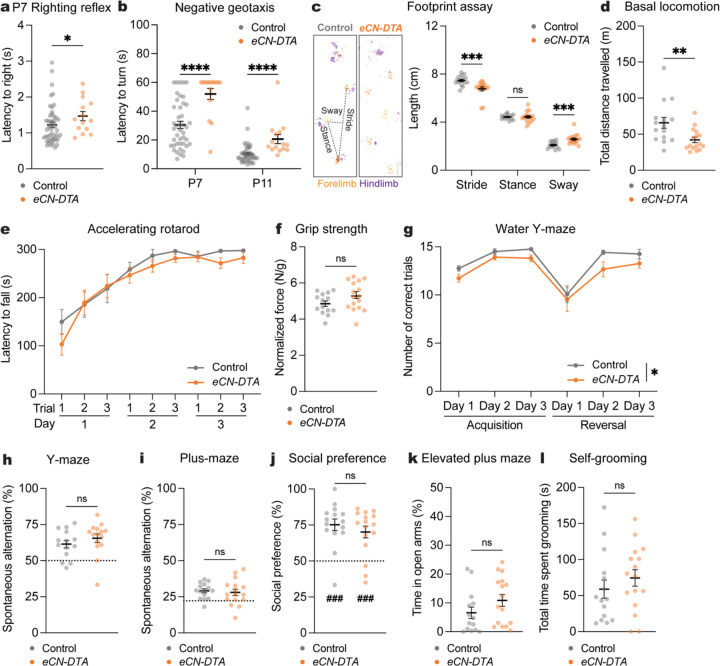
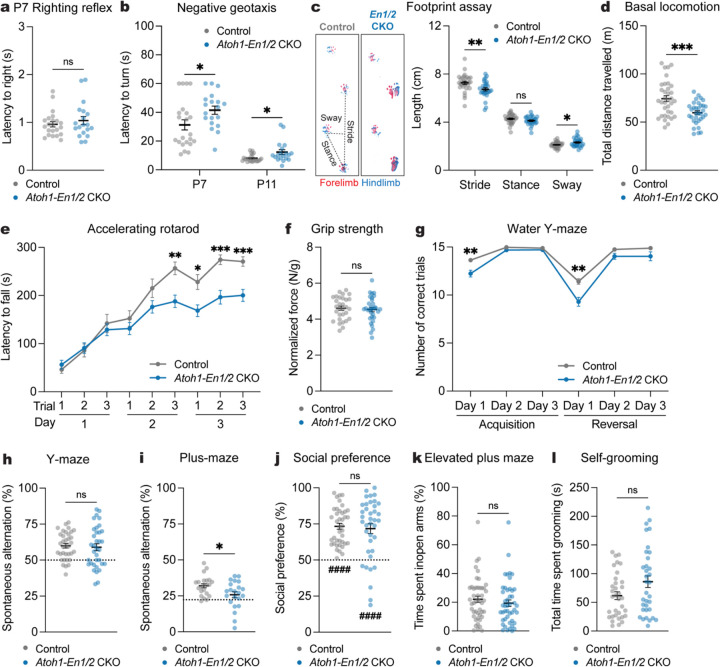
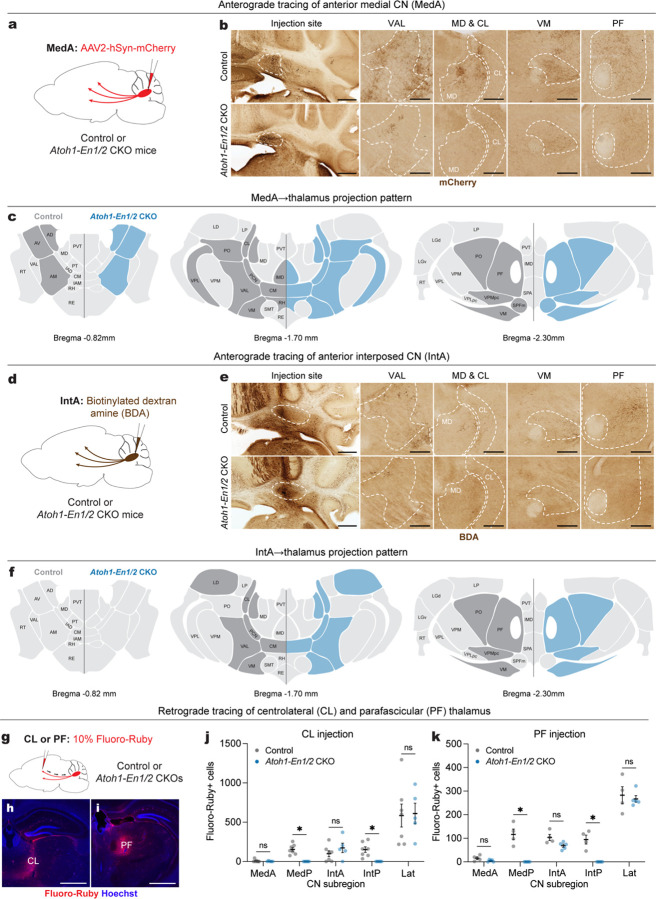
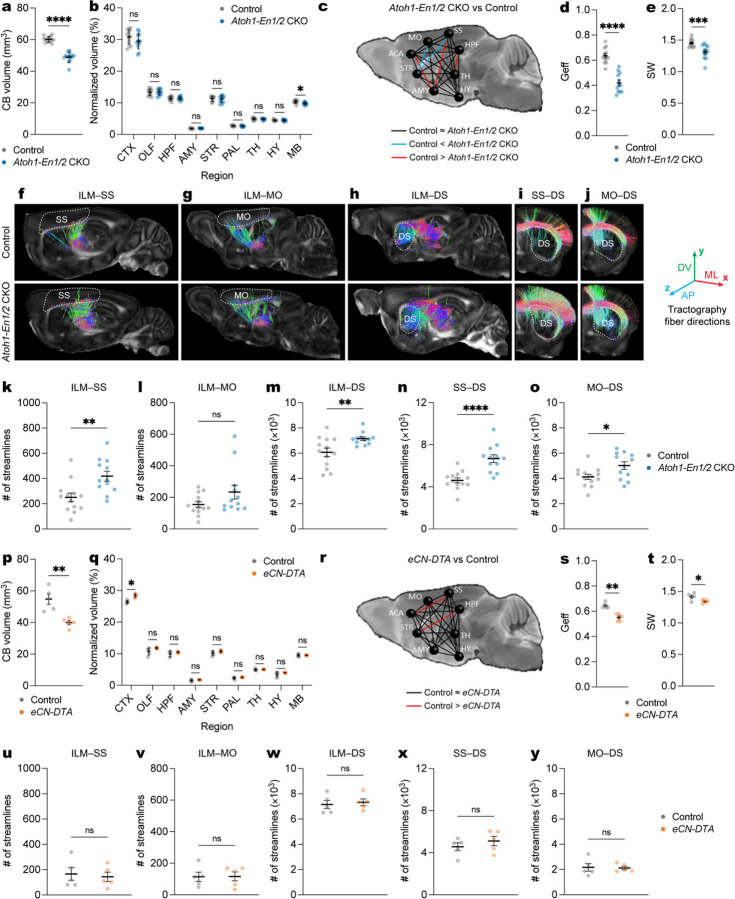
The capacity of the brain to compensate for insults during development depends on the type of cell loss, whereas the consequences of genetic mutations in the same neurons are difficult to predict. We reveal powerful compensation from outside the cerebellum when the excitatory cerebellar output neurons are ablated embryonically and demonstrate that the minimum requirement for these neurons is for motor coordination and not learning and social behaviors. In contrast, loss of the homeobox transcription factors Engrailed1/2 (EN1/2) in the cerebellar excitatory lineage leads to additional deficits in adult learning and spatial working memory, despite half of the excitatory output neurons being intact. Diffusion MRI indicates increased thalamo-cortico-striatal connectivity in En1/2 mutants, showing that the remaining excitatory neurons lacking En1/2 exert adverse effects on extracerebellar circuits regulating motor learning and select non-motor behaviors. Thus, an absence of cerebellar output neurons is less disruptive than having cerebellar genetic mutations.


Conflict of interest statement

Competing interests All authors declare to have no actual or potential conflict of interest including any financial, personal, or other relationships with other people or organizations within three years of beginning the submitted work that could inappropriately influence, or be perceived to influence, their work.

Figures

Fig. 1 |
Fig. 1 |. Acute adult chemogenetic inhibition of MedP eCN impairs reversal learning and not motor behaviors.
a, Schematic representation of a lateral sagittal plane of the mouse cerebellum on the left with vertical lines (i and ii) indicating the location of the anterior and posterior coronal schematics shown to right. b,c, Representative coronal images of tdTomato expression in the anterior CN (b) and posterior (c) CN of SepW1-Cre; Ai75D mice. CN were subdivided into five subregions based on histological distinctions (Paxinos and Franklin, 2007) and MEIS2 immunostaining. Abbreviations: MedA=Anterior medial; MedP=Posterior medial; IntA=Anterior interposed; IntP=Posterior interposed; Lat=Lateral. Scale bars = 500 um. d, Quantification of tdTomato+ cells on every second coronal section of SepW1-Cre; Ai75D mice (n=4) in the lateral CN (Lat) and subregions of the intermediate (Int) and medial (Med) CN (n=4 mice). e, Representative image of tdTomato (magenta) and MEIS2 (green) co-expressing eCN in SepW1-Cre; Ai75D mice. Scale bars = 50 um. f, Quantification of tdTomato+ cells that co-express MEIS2 and the reverse in SepW1-Cre; Ai75D mice (n=4 mice). g, Schematic of viral injection to express mCherry (control) or hM4Di-mCherry (MedP-hM4Di) in adult MedP eCN. Dashed line indicates region shown in (i). h, Representative images of MedP eCN mCherry+ axon terminals (black) in four thalamic nuclei of control mice. Fluorescent images were inverted using the look up table in Fiji. Abbreviations: MD=mediodorsal; CL=centrolateral; VM=ventromedial; PF=parafascicular. Scale bars = 250 um. i, Representative images of viral mCherry expression in MedP eCN in control (top, AAV-DIO-mCherry) and MedP-hM4Di (bottom, AAV-DIO-hM4Di-mCherry) mice. Scale bars = 250 um. j, Experimental timeline of surgery, CNO injection and behavioral tests. k, (left) Representative images of footprints from control and MedP-hM4Di mice. (right) quantification of stride, stance, and sway (n=11 per group). Multiple Mann-Whitney U tests for effect of genotype on stride (U = 48, P = 0.4385), stance (U = 34, P = 0.0843) and sway (U = 58, P = 0.8851). l, Total distance travelled during basal locomotion (n=11 per group; t20 = 0.3910, P = 0.7000). m, Latency to fall during the accelerating rotarod test (MedP-hM4Di: n=11, control: n=10). Repeated measure two-way ANOVA: main effect of time (F4.750,90.25 = 27.51, P < 0.0001), but not of chemogenetics (F1,19 = 0.9367, P = 0.3453) or interaction (F5,152 = 0.3699, P = 0.9351). n, Forelimb grip strength normalized to body weight (MedP-hM4Di: n=11, control: n=10; two-tailed unpaired t-test: t19 = 1.677, P = 0.1099). o, Total number of correct trials during the water Y-maze test (MedP-hM4Di: n=10, control: n=9). Repeated measure two-way ANOVA: main effect of time (F5,85 = 27.65, P < 0.0001) and chemogenetics (F1,17 = 9.855, P = 0.006), but not of interaction (F5,85 = 2.257, P = 0.0559); with post hoc two-tailed t-tests with Šídák correction for effect of chemogenetics on Reversal Day 1 (t102 = 3.386, P = 0.006), and not other comparisons (P ≥ 0.05). p, Percentage spontaneous alternations in the Y-maze (MedP-hM4Di: n=10, control: n=9; two-tailed unpaired t-test: t17 = 0.9024, P = 0.3794). ns, not significant: P ≥ 0.05. Data are presented as mean values ± SEM.
Fig. 2 |
Fig. 2 |. Generation of mice lacking the MedP eCN by conditional knockout of En1/2.
a, Quantification of eCN number (large (100–600 um2) NeuN+ cells) along the medial-lateral axis in adult SepW1-En1/2 CKOs (n=5) and littermate controls (n=6). Ordinary two-way ANOVA: main effect of mediolateral distance (F19,180 = 24.02, P < 0.0001), genotype (F1,180 = 86.54, P < 0.0001), and interaction (F19,180 = 2.449, P < 0.0001); with post hoc two-tailed t-tests with uncorrected Fisher’s LSD for effect of genotype for bin 5–10% (t180 = 3.180, P = 0.0017), bins 10–30% (list of t value for each bin: t180 = 4.858, 5.738, 4.218, 4.028; all P values: P < 0.0001), bin 30–35% (t180 = 2.703, P = 0.0075), bin 35–40% (t180 = 2.238, P = 0.0265), bin 75–80% (t180 = 2.002. P = 0.0468), but not other comparisons (P ≥ 0.05). Abbreviations: Med=medial; Int=interposed; Lat=lateral. b, Representative coronal images of MEIS2 labeling in the anterior and posterior CN of an adult SepW1-En1/2 CKO and littermate control as indicated. Scale bars = 500 um. c, Representative images of H&E labeled sagittal sections of vermis (Ver), paravermis (pVer), and hemisphere (Hemi) from a SepW1-En1/2 CKO and littermate control. Scale bars = 1 mm. d, Quantification of total cerebellar (CB) area of SepW1-En1/2 CKOs (n=5) compared to littermate controls (n=6) in the vermis, paravermis and hemispheres. Ordinary two-way ANOVA: main effect of region (F2,27 = 42.06, P < 0.0001) and genotype (F1,27 = 37.13, P < 0.0001), and interaction (F2,27 = 5.825, P = 0.0079); with post hoc two-tailed t-tests with uncorrected Fisher’s LSD for effect of genotype for vermis (t27 = 6.292, P < 0.0001), paravermis (t27 = 2.359, P = 0.0258), and hemisphere (P = 0.0678). e, Quantification of molecular layer (ML) area as a percent of total CB area in SepW1-En1/2 CKOs (n=5) compared to littermate controls (n=6). Ordinary two-way ANOVA: main effect of region (F2,27 = 32.11, P < 0.0001), genotype (F1,27 = 5.236, P = 0.0302), but not of interaction (P = 0.5866). f, Quantification of internal granule cell layer (IGL) area as a percent of total CB area in SepW1-En1/2 CKOs (n=5) compared to littermate controls (n=6). Ordinary two-way ANOVA: main effect of region (F2,27 = 82.04, P < 0.0001), but not of genotype (P = 0.6943) or interaction (P = 0.8641). g, Quantification of Purkinje cell (PC) density in SepW1-En1/2 CKOs (n=5) compared to littermate controls (n=6). Ordinary two-way ANOVA: main effect of region (F2,18 = 18.34, P < 0.0001), but not of genotype (P = 0.4167) or interaction (P = 0.7216). h, Quantification of PV+ MLI density in SepW1-En1/2 CKOs (n=5) compared to littermate controls (n=6). Ordinary two-way ANOVA: main effect of region (F2,27 = 16.66, P < 0.0001), but not of genotype (P = 0.8926) or interaction (P = 0.4617). i, Quantification of granule cell (GC) density in the IGL of SepW1-En1/2 CKOs (n=5) compared to littermate controls (n=6). Ordinary two-way ANOVA: no main effect of region (P = 0.9948), genotype (P = 0.8945) or interaction (P = 0.9502). j, Quantification of the estimated ratio of the number of PCs to PV+ MLIs in SepW1-En1/2 CKOs (n=5) compared to littermate controls (n=6). Ordinary two-way ANOVA: no significant main effect of region (P = 0.3807), genotype (P = 0.7618) or interaction (P = 0.7701). k, Quantification of the estimated ratio of the number of PCs to GCs in SepW1-En1/2 CKOs (n=5) compared to littermate controls (n=6). Ordinary two-way ANOVA: main effect of region (F1,27 = 4.769, P = 0.0168), but no main effect of genotype (P = 0.7368) or interaction (P = 0.2521). l, Quantification of the estimated ratio of the number of PV+ MLIs to GCs in SepW1-En1/2 CKOs (n=5) compared to littermate controls (n=6). Ordinary two-way ANOVA: main effect of region (F1,27 = 4.638, P = 0.0186), but not of genotype (P = 0.9195) or interaction (P = 0.9841). ns, not significant: P ≥ 0.05. Data are presented as mean values ± SEM.
Fig. 3 |
Fig. 3 |. Mice lacking MedP eCN have normal reversal learning as well as motor behaviors.
a, (left) Representative images of footprints from one SepW1-En1/2 CKO and littermate control. (right) Quantification of stride, stance, and sway (SepW1-En1/2 CKOs: n=27, littermate controls: n=22). Multiple Mann-Whitney U tests showing effect of genotype on sway (U = 188, P = 0.0276), but not stride (U = 234, P = 0.2087) or stance (U = 279, P = 0.7235). b, Total distance travelled during basal locomotion (SepW1-En1/2 CKOs: n=24, littermate controls: n=27; Mann-Whitney U test: U = 264, P = 0.2640). c, Latency to fall during the accelerating rotarod test (SepW1-En1/2 CKOs: n=23, littermate controls: n=27). Repeated measure two-way ANOVA: main effect of time (F4.590,220.3 = 69.92, P < 0.0001), but not of genotype (F1,48 = 0.3434, P = 0.5606) or interaction (F8,384 = 0.4280, P < 0.9041). d, Forelimb grip strength coronal normalized to body weight (SepW1-En1/2 CKOs: n=23, littermate controls: n=27; two-tailed unpaired t-test: t48 = 1.1018, P = 0.6689). e, Total number of correct trials during the water Y-maze test (SepW1-En1/2 CKOs: n=18, littermate controls: n=23). Repeated measure two-way ANOVA: main effect of time (F3.132,122.1 = 38.86, P < 0.0001), but not of genotype (F1,39 = 0.5638, P = 0.4572) or interaction (F5,195 = 1.492, P = 0.1941). f, Percentage of spontaneous alternations in the Y-maze (SepW1-En1/2 CKOs: n=23, littermate controls: n=26); two-tailed unpaired t-test: t47 = 0.8600, P = 0.3942). g, Latency to right onto four paws at P7 (SepW1-En1/2 CKOs: n=17, littermate controls: n=13; two-tailed unpaired t-test: t28 = 0.1171, P = 0.9076). h, Latency to turn upward on a negative slope at P7 and P11 (SepW1-En1/2 CKOs: n=17, littermate controls: n=13). Multiple Mann-Whitney U tests with Holm-Šídák correction for effect of genotype at P7 (U = 79, P = 0.3562) and at P11 (U = 92.50, P = 0.4634). ns, not significant: P ≥ 0.05. Data are presented as mean values ± SEM.
Fig. 4 |
Fig. 4 |. Generation of mice in which all embryonic eCN are ablated using Diphtheria toxin.
a, Intersectional approach to pharmacogenetically ablate the embryonic eCN. A doxycycline (Dox)-controlled and recombinase activated gene overexpression allele (DRAGON) for attenuated diphtheria toxin fragment A (DTA) (Igs7DRAGON-DTA) combined with an Atoh1-tTA transgene and En1Cre knock-in allele results in embryonic killing of eCN when Dox is administered starting at E13.5 via expression of DTA. The genotypes of littermate controls are Atoh1-tTA or En1Cre along with the lgs7DRAGON-DTA allele. b, Representative images of sagittal sections stained for MEIS2 (white) in medial and lateral cerebellum of an E17.5 eCN-DTA and littermate control. Scale bars = 250 um. c, Quantification of total number of MEIS2+ cells on every 10th sagittal section of E17.5 eCN-DTA mice (n=3) compared to littermate controls (n=3) (two-tailed unpaired t-test: t4 = 15.62, P < 0.0001). d, Mediolateral distribution of NeuN+ large cells (100–600 um) in adult eCN-DTA mice (n=5) compared to littermate controls (n=6). Repeated measure two-way ANOVA: main effect of mediolateral distance (F19,180 = 6.669, P < 0.0001), genotype (F1,180 = 359.5, P < 0.0001), and interaction (F19,180 = 5.745, P < 0.0001); with post hoc two-tailed t-tests with uncorrected Fisher’s LSD for effect of genotype show significance for bin 10–15% (t180 = 3.327, P = 0.0163), bin 15–20% (t180 = 4.439, P = 0.0011), bins 20–85% (list of t value for each bin: t180 = 4.349, 4.684, 5.539, 5.676, 6.22, 4.587, 5.939, 6.153, 6.76, 6.181, 7.551, 6.744, 4.676; all P values: P < 0.0001), bin 85–90% (t180 = 2.229, P = 0.027), but not other comparisons (P ≥ 0.05). Abbreviations: Med=medial; Int=interposed; Lat=lateral. e, Representative images of RNA in situ analysis of coronal sections for Slc17a6 expression in the CN of eCN-DTA mice and littermate controls. Dotted outlines indicate the CN subregions. Images are single channel inverted using lookup table in Fiji. Scale bars = 500 um. f, Representative images of triple RNA in situ of coronal sections in the medial CN showing some neurons co-express Slc32a1, Slc17a6, and Slc6a5. Arrowhead and asterisk indicate neurons expressing only Slc32a1 or Slc17a6 in controls, respectively. Scale bars = 50 um. g, Representative images of H&E labeled vermis (Ver), paravermis (pVer), and hemisphere (Hemi) sagittal sections from an eCN-DTA and littermate control. Scale bars = 1 mm. h, Quantification of total cerebellar (CB) area in eCN-DTA mice (n=5) and littermate controls (n=6) in the vermis, paravermis and hemispheres. Ordinary two-way ANOVA: main effect of region (F2,27 = 32.08, P < 0.0001) and genotype (F1,27 = 89.64, P < 0.0001), but not of interaction (P = 0.9488); with post hoc two-tailed t-tests with uncorrected Fisher’s LSD for effect of genotype for vermis (t27 = 5.260, P < 0.0001), paravermis (t27 = 5.425, P < 0.0001), and hemisphere (t27 = 5.713, P < 0.0001). i, Quantification of molecular layer (ML) area as a percent of total CB area in eCN-DTA mice (n=5) compared to littermate controls (n=6). Ordinary two-way ANOVA: main effect of region (F2,27 = 37.84, P < 0.0001), but not of genotype (P = 0.3540) or interaction (P = 0.1589). j, Quantification of IGL area as a percent of total CB area in eCN-DTA mice (n=5) compared to littermate controls (n=6). Ordinary two-way ANOVA: main effect of region (F2,27 = 7.249, P = 0.003), but not of genotype (P = 0.0545) or interaction (P = 0.1911); with post hoc two-tailed t-tests with uncorrected Fisher’s LSD for effect of genotype for hemisphere (t27 = 2.220, P = 0.0350), but not other comparisons (P ≥ 0.05). k, Quantification of PC density in eCN-DTA mice (n=5) compared to littermate controls (n=6). Ordinary two-way ANOVA: main effect of region (F2,18 = 10.23, P = 0.0011), but not of genotype (P = 0.1660) or interaction (P = 0.2277). l, Quantification of PV+ MLI density in eCN-DTA mice (n=5) compared to littermate controls (n=6). Ordinary two-way ANOVA: no main effect of region (P = 0.2153), genotype (P = 0.1660) or interaction (P = 0.2277). m, Quantification of GC density in eCN-DTA mice (n=5) compared to littermate controls (n=6). Ordinary two-way ANOVA: main effect of region (F2,18 = 10.08, P = 0.0012), but not of genotype (P = 0.6051) or interaction (P = 0.9220). n, Quantification of the estimated ratio of the number of PCs to PV+ MLIs in eCN-DTA mice (n=5) compared to littermate controls (n=6). Ordinary two-way ANOVA: no significant main effect of region (P = 0.4484), genotype (P = 0.2061) or interaction (P = 0.5916). o, Quantification of the estimated ratio of the number of PCs to GCs in eCN-DTA mice (n=5) compared to littermate controls (n=6). Ordinary two-way ANOVA: main effect of genotype (F1,27 = 7.013, P = 0.0134), but not of region (P = 0.0913) or interaction (P = 0.7645). p, Quantification of the estimated ratio of the number of PV+ MLIs to GCs in eCN-DTA mice (n=5) compared to littermate controls (n=6). Ordinary two-way ANOVA: no significant main effect of region (P = 0.0680), genotype (P = 0.4415) or interaction (P = 0.6184). ns, not significant: P ≥ 0.05. Data are presented as mean values ± SEM.
Fig. 5 |
Fig. 5 |. Loss of all eCN impairs motor coordination, but not motor learning and non-motor behaviors.
a, Latency to right onto four paws at P7 (eCN-DTA mice: n=15, littermate controls: n=43; Mann-Whitney U test: U = 226, P = 0.0436). b, Latency to turn upward on a negative slope at P7 and P11 (eCN-DTA mice: n=15, littermate controls: n=43). Multiple Mann-Whitney U tests with Holm-Šídák correction for effect of genotype at P7 (U = 109, P < 0.0001) and at P11 (U = 89, P < 0.0001). c, (left) Representative images of footprints from an eCN-DTA and littermate control. (right) Quantification of stride, stance, and sway (eCN-DTA mice: n=16, littermate controls: n=15). Multiple Mann-Whitney U tests for effect of genotype on stride (U = 33, P = 0.00028) and sway (U = 32, P = 0.00023), but not stance (U = 113.5, P = 0.8073). d, Total distance travelled during basal locomotion (eCN-DTA mice: n=16, littermate controls: n=15; two-tailed unpaired t-test: t29 = 2.865, P = 0.0077). e, Latency to fall in the accelerating rotarod test (eCN-DTA mice: n=15; littermate controls: n=15). Repeated measure two-way ANOVA: main effect of time (F3.426,95.92 = 34.31, P < 0.0001), but not of genotype (P = 0.3873) or interaction (P = 0.6987). f, Forelimb grip strength normalized to body weight (eCN-DTA mice: n=16, littermate controls: n=15; two-wailed unpaired t-test: t28 = 1.684, P = 0.1033). g, Total number of correct trials during the water Y-maze test (eCN-DTA mice: n=15, littermate controls: n=12). Repeated measure two-way ANOVA: main effect of time (F1.667,41.67 = 17.92, P < 0.0001) and genotype (F1,25 = 4.898, P = 0.0362), but not of interaction (P = 0.9183); with post hoc two-tailed t-tests with Šídák correction for effect of genotype all being P ≥ 0.05. h, Percentage of spontaneous alternations in the Y-maze (eCN-DTA mice: n=15, littermate controls: n=14; Mann-Whitney U test: U = 76.50, P = 0.2209). Chance level performance is 50% (dotted line). i, Percentage of spontaneous alternations in the plus-maze (eCN-DTA mice: n=16, littermate control: n=15; two-tailed unpaired t-test: t29 = 0.4309, P = 0.6698). Chance level performance is 22.2% (dotted line). j, Social preference (percent time nose spent within novel mouse contact zone) during the three-chamber social approach test (eCN-DTA mice: n=16, littermate controls: n=15; Mann-Whitney U test: U = 102, P = 0.4945). Wilcoxon test against a null hypothesis (50%) in eCN-DTA mice (W = 122, P = 0.0006) and littermate controls (W = 116, P = 0.0002). k, Percentage of time spent in the open arms of an elevated plus maze (eCN-DTA mice: n=16, littermate controls: n=14; Mann-Whitney U test: U = 74, P = 0.1179). l, Total time spent self-grooming (eCN-DTA mice: n=16, littermate controls: n=15; Mann-Whitney U test: U = 92, P = 0.2770). ns, not significant: P ≥ 0.05. Data are presented as mean values ± SEM.
Fig. 6 |
Fig. 6 |. Loss of En1/2 in all eCN impairs motor coordination and learning, cognitive flexibility, and spatial working memory.
a, Latency to right onto four paws at P7 (Atoh1-En1/2 CKOs: n=19, littermate controls: n=22; Mann-Whitney U test: U = 192.5, P = 0.6741). b, Latency to turn upward on a negative slope at P7 and P11 (Atoh1-En1/2 CKOs: n=19, littermate controls: n=22). Multiple Mann-Whitney U tests with Holm-Šídák correction for effect of genotype at P7 (U = 128, P = 0.0245) and P11 (U = 114.5, P = 0.033). c, (left) Representative images of footprints from an Atoh1-En1/2 CKO and littermate control. (right) Quantification of stride, stance, and sway (Atoh1-En1/2 CKOs: n=28, littermate controls: n=30). Multiple Mann-Whitney U tests for effect of genotype on stride (U = 237, P = 0.0039) and sway (U = 292.5, P = 0.047), but not stance (U = 312, P = 0.0936). d, Total distance travelled during basal locomotion (Atoh1-En1/2 CKOs: n=33, littermate controls: n=35; two-tailed unpaired t-test: t66 = 3.931, P = 0.0002). e, Latency to fall in the accelerating rotarod test (Atoh1-En1/2 CKOs: n=32, littermate controls: n=30). Repeated measure two-way ANOVA: main effect of time (F5.648,338.9 = 90.56, P < 0.0001), genotype (F1,60 = 7.791, P = 0.0070), and interaction (F8,480 = 5.827, P < 0.0001); with post hoc two-tailed t-tests with Šídák correction for effect of genotype on day 2-trial 3 (t59.83 = 3.721, P = 0.0040), day 3-trial 1 (t55.69 = 3.019, P = 0.0338), day 3-trial 2 (t55.46 = 4.502, P = 0.0003), day 3-trial 3 (t57.98 = 4.416, P = 0.0004), and other comparisons (P ≥ 0.05). f, Forelimb grip strength normalized to body weight (Atoh1-En1/2 CKOs: n=32, littermate controls: n=30; two-tailed unpaired t-test: t60 = 0.4298, P = 0.6689). g, Total number of correct trials during the water Y-maze test (Atoh1-En1/2 CKOs: n=31, littermate controls: n=35). Repeated measure two-way ANOVA: main effect of time (F3.003,192.2 = 118.4, P < 0.0001), genotype (F1,64 = 21.47, P < 0.0001), and interaction (F5,320 = 5.101, P = 0.0002); with post hoc two-tailed t-tests with Šídák correction for effect of genotype on Acquisition Day 1 (t42.50 = 3.583, P = 0.0052), Reversal Day 1 (t52.14 = 3.821, P = 0.0021), and no other comparisons (P ≥ 0.05). h, Percentage of spontaneous alternations in the Y-maze (n=35 per genotype; two-tailed unpaired t-test: t68 = 0.3622, P = 0.7183). Chance level performance is 50% (dotted line). i, Percentage of spontaneous alternations in the plus-maze (n=22 per genotype; two-tailed unpaired t-test: t42 = 2.486, P = 0.0170). Chance level performance is 22.2% (dotted line). j, Social preference (percent time nose spent within novel mouse contact zone) during the three-chamber social approach test (Atoh1-En1/2 CKOs: n=38, littermate controls: n=40; Mann-Whitney U test: U = 723, P = 0.7167). Wilcoxon test against a null hypothesis (50%) in Atoh1-En1/2 CKOs (W = 605, P < 0.0001) and littermate controls (W = 820, P < 0.0001). k, Percentage of time spent in the open arms of an elevated plus maze (Atoh1-En1/2 CKOs: n=46, littermate control: n=47; Mann-Whitney U test: U = 923, P = 0.2266). j, Total time spent self-grooming (n=34 per genotype; Mann-Whitney U test: U = 455, P = 0.1336). ns, not significant: P ≥ 0.05. Data are presented as mean values ± SEM.
Fig. 7 |
Fig. 7 |. Atoh1-En1/2 CKOs have reduced cerebellothalamic projections, but no ectopic cerebellothalamic projections.
a, Schematic of anterograde tracing of MedA CN cells in adult Atoh1-En1/2 CKOs and littermate controls. b, Representative images of coronal sections showing injection site and mCherry+ axon terminals (brown) in various thalamic regions from an Atoh1-En1/2 CKO and littermate control. Scale bar: injection site = 1 mm and mCherry images = 250 um. c, Summary of mCherry+ axon terminals observed in thalamic nuclei of Atoh1-En1/2 CKOs (blue) versus littermate controls (dark grey) on three representative coronal planes adapted from Allen Brain Atlas. Blue indicates reduced density. d, Schematic of anterograde tracing of anterior interposed CN (IntA) cells in adult Atoh1-En1/2 CKOs and littermate controls. e, Representative images of coronal sections showing injection site and biotinylated dextran amine (BDA)+ axon terminals (brown) in various thalamic regions from an Atoh1-En1/2 CKO and littermate control. Scale bar: injection site = 1 mm and BDA images = 250 um. f, Summary of BDA+ axon terminals observed in thalamic nuclei of Atoh1-En1/2 CKOs (blue) and littermate controls (dark grey) versus on three representative coronal planes adapted from Allen Brain Atlas. Blue indicates reduced density. g, (top) Schematic of retrograde tracing in adult Atoh1-En1/2 CKOs and littermate controls. h,i, Representative images of the injection site of Fluoro-Ruby (red) and Hoechst (blue) in centrolateral thalamus (CL, h) and parafascicular thalamus (PF, i). Scale bars = 1 mm. j, Quantification of Fluoro-Ruby+ cells in CN subregions that are retrogradely labeled from CL injection. Multiple Mann-Whitney U tests with Holm-Šídák correction for effect of genotype on MedP (U = 0, P = 0.0126) and IntP (U = 0, P = 0.0126), but not on MedA (U = 15.5, P = 0.9400), IntA (U = 11, P = 0.6882), and Lat (U = 15, P = 0.9400). k, Quantification of Fluoro-Ruby+ cells in CN subregions that are retrogradely labeled from PF injection. Multiple Mann-Whitney U tests with Holm-Šídák correction for effect of genotype on MedP (U = 0, P = 0.0390) and IntP (U = 0, P = 0.0390), but not on MedA (U = 3.5, P = 0.2516), IntA (U = 1, P = 0.0922), and Lat (U = 10, P > 0.9999). Abbreviations: AD=Anterodorsal nucleus; AM=Anteromedial nucleus; AV=Anteroventral nucleus of thalamus; CL=Central lateral nucleus; CM=Central medial nucleus; IAD=Interanterodorsal nucleus; IAM=Interanteromedial nucleus; IMD=Intermediodorsal nucleus; LD=Lateral dorsal nucleus of thalamus; LGv=Ventral part of the lateral geniculate complex; LP=Lateral posterior nucleus; MD=Mediodorsal nucleus of thalamus; PCN=Paracentral nucleus; PF=Parafascicular nucleus; PO=Posterior complex; PT=Parataenial nucleus; PVT=Paraventricular nucleus; RE=Nucleus of reuniens; RH=Rhomboid nucleus; RT=Reticular nucleus; SMT=Submedial nucleus; SPFm=Subparafascicular nucleus, magnocellular part; VAL=Ventral anterior-lateral complex; VM=Ventral medial nucleus; LGd=Dorsal part of the lateral geniculate complex; VPM=Ventral posteromedial nucleus; VPL=Ventral posterolateral nucleus; SPA=Subparafascicular area; VPMpc=Ventral posteromedial nucleus, parvicellular part; VPLpc=Ventral posterolateral nucleus, parvicellular part. ns, not significant: P ≥ 0.05. Data are presented as mean values ± SEM.
Fig 8 |
Fig 8 |. Diffusion MRI shows Atoh1-En1/2 CKOs have connectivity changes outside the cerebellum that are distinct from eCN-DTA mice.
a, Quantification of cerebellar (CB) volume in Atoh1-En1/2 CKOs (n=12) compared to littermate controls (n=13) (two-tailed unpaired t-test: t23 = 11.15, P < 0.0001). b, Quantification of regional volumes normalized to forebrain plus midbrain combined volume in Atoh1-En1/2 CKOs (n=12) compared to littermate controls (n=13). Two-tailed unpaired t-tests to test for effect of genotype on MB (t23 = 2.834, P = 0.0094) and other comparisons P ≥ 0.05. c, Schematic representation of global connectivity in Atoh1-En1/2 CKOs compared to littermate controls. Black lines indicate no significant difference, red lines indicate reduced connectivity in Atoh1-En1/2 CKOs and blue lines indicate increased connectivity in Atoh1-En1/2 CKOs compared to littermate controls (two-tailed unpaired t-tests with Welch’s correction). d, Quantification of global efficiency (Geff; Atoh1-En1/2 CKOs: n=12, littermate controls: n=13; two-tailed unpaired t-test: t23 = 7.876, P < 0.0001). e, Quantification of small worldness (SW; Atoh1-En1/2 CKOs: n=12, littermate controls: n=13; two-tailed unpaired t-test: t23 = 3.913, P = 0.0007). f-j, Representative images of ILM-SS (f), ILM-MO (g), ILM-DS (h), SS-DS (i), MO-DS (j) tractographies in right hemisphere of one Atoh1-En1/2 CKO and littermate control. Target regions are outlined in dotted lines. The color of streamlines indicates their orientations, as indicated by the colored arrows on the right. Abbreviations: AP=anteroposterior; ML=mediolateral; DV=dorsoventral. k-o, Quantification of average (left plus right hemispheres) of ILM-SS tractography (k, two-tailed unpaired t-test: t23 = 3.225, P = 0.0038), ILM-MO tractography (I, two-tailed unpaired t-test: t23 = 1.701, P = 0.1024), ILM-DS tractography (m, two-tailed unpaired t-test: t23 = 2.902, P = 0.0080), SS-DS tractography (n, two-tailed unpaired t-test: t23 = 4.813, P < 0.0001), and MO-DS tractography (o, two-tailed unpaired t-test: t23 = 2.515, P = 0.0194) in Atoh1-En1/2 CKO compared to littermate controls (Atoh1-En1/2 CKOs: n=12, littermate controls: n=13). p, Quantification of cerebellar (CB) volume in eCN-DTA mice compared to littermate controls (n=5 per genotype; two-tailed unpaired t-test: t8 = 4.295, P = 0.0026). q, Quantification of regional volume normalized to forebrain plus midbrain combined volume in eCN-DTA mice (n=5) compared to littermate controls (n=5). Two-tailed unpaired t-tests to test for effect of genotype on CTX (t8 = 5.876, P = 0.0004) and other comparisons P ≥ 0.05. r, Schematic representation of global connectivity for eCN-DTA mice compared to littermate controls. Black lines indicate no significant difference and red lines indicate reduced connectivity in eCN-DTA mice compared to littermate controls (two-tailed unpaired t-tests with Welch’s correction). s, Quantification of global efficiency (Geff; n=5 per genotype; two-tailed unpaired t-test: t8 = 2.535, P = 0.035). t, Quantification of small worldness (SW; n=5 per genotype; two-tailed unpaired t-test: t8 = 1.591, P = 0.1503). u-y, Quantification of average (left and right hemispheres) ILM-SS tractography (u, two-tailed unpaired t-test: t8 = 0.3742, P = 0.7180), ILM-SS tractography (v, two-tailed unpaired t-test: t8 = 0.0516, P = 0.9601), ILM-SS tractography (w, two-tailed unpaired t-test: t8 = 0.4177, P = 0.6871), ILM-SS tractography (x, two-tailed unpaired t-test: t8 = 0.9447, P = 0.3725), and ILM-SS tractography (y, two-tailed unpaired t-test: t8 = 0.1414, P = 0.8911) in eCN-DTA mice compared to littermate controls (n=5 per genotype). Abbreviations: CTX=cerebral cortex; OLF=olfactory bulb; HPF=hippocampal formation; AMY=amygdala; STR=striatum; PAL=pallidum; TH=thalamus; HY=hypothalamus; MB=midbrain; HB=hindbrain; CB=cerebellum; ILM=intralaminar nuclei; SS=primary somatosensory cortex; MO=primary motor cortex; DS=dorsal striatum. ns, not significant: P ≥ 0.05. Data are presented as mean values ± SD for a, j and mean value ± SEM for d,e,ko,sy.

References

    1. Albazron FM, et al. Pediatric postoperative cerebellar cognitive affective syndrome follows outflow pathway lesions. Neurology 93, e1561–e1571 (2019). - PMC - PubMed
    1. Korah MP, et al. Incidence, risks, and sequelae of posterior fossa syndrome in pediatric medulloblastoma. Int J Radiat Oncol Biol Phys 77, 106–112 (2010). - PubMed
    1. Robertson PL, et al. Incidence and severity of postoperative cerebellar mutism syndrome in children with medulloblastoma: a prospective study by the Children’s Oncology Group. J Neurosurg 105, 444–451 (2006). - PubMed
    1. Stoodley CJ, Limperopoulos C. Structure-function relationships in the developing cerebellum: Evidence from early-life cerebellar injury and neurodevelopmental disorders. Semin Fetal Neonatal Med 21, 356–364 (2016). - PMC - PubMed
    1. van der Heijden ME, et al. Glutamatergic cerebellar neurons differentially contribute to the acquisition of motor and social behaviors. Nat Commun 14, 2771 (2023). - PMC - PubMed

Publication types