. 2024 Jul;14(7):3049-3067.
doi: 10.1016/j.apsb.2024.04.017. Epub 2024 Apr 24.

PIM1-HDAC2 axis modulates intestinal homeostasis through epigenetic modification

Affiliations

PIM1-HDAC2 axis modulates intestinal homeostasis through epigenetic modification

Jianming Yang et al. Acta Pharm Sin B. 2024 Jul.

Abstract

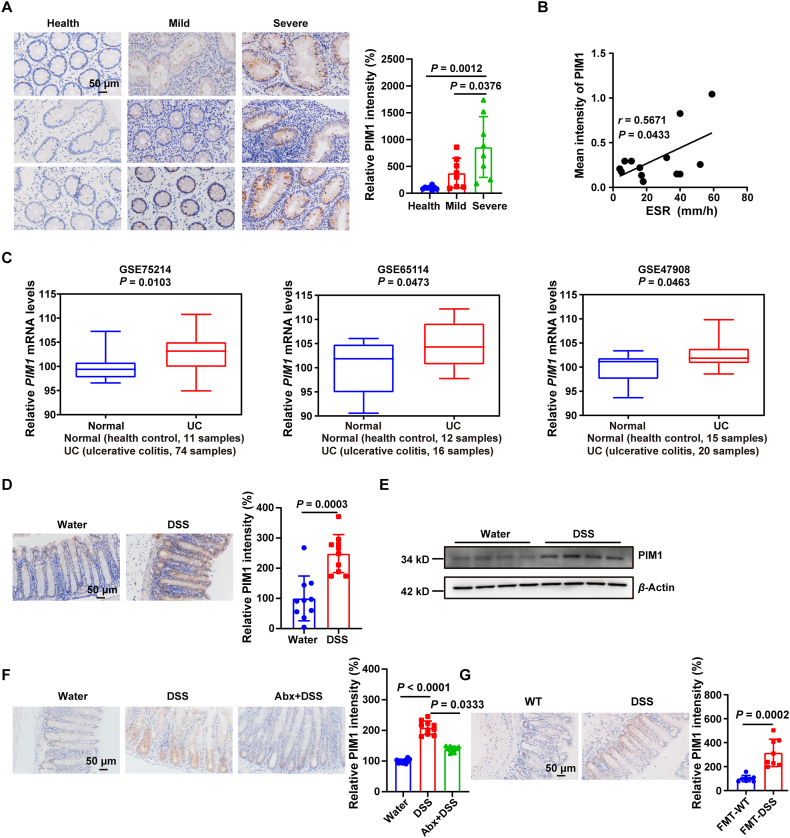
The mucosal barrier is crucial for intestinal homeostasis, and goblet cells are essential for maintaining the mucosal barrier integrity. The proviral integration site for Moloney murine leukemia virus-1 (PIM1) kinase regulates multiple cellular functions, but its role in intestinal homeostasis during colitis is unknown. Here, we demonstrate that PIM1 is prominently elevated in the colonic epithelia of both ulcerative colitis patients and murine models, in the presence of intestinal microbiota. Epithelial PIM1 leads to decreased goblet cells, thus impairing resistance to colitis and colitis-associated colorectal cancer (CAC) in mice. Mechanistically, PIM1 modulates goblet cell differentiation through the Wnt and Notch signaling pathways. Interestingly, PIM1 interacts with histone deacetylase 2 (HDAC2) and downregulates its level via phosphorylation, thereby altering the epigenetic profiles of Wnt signaling pathway genes. Collectively, these findings investigate the unknown function of the PIM1-HDAC2 axis in goblet cell differentiation and ulcerative colitis/CAC pathogenesis, which points to the potential for PIM1-targeted therapies of ulcerative colitis and CAC.

Keywords: CAC; Epigenetic modification; Goblet cell; Gut microbiota; HDAC2; Intestinal homeostasis; PIM1; Ulcerative colitis.


Conflict of interest statement

The authors declare no competing interests.

Figures

Image 1
Graphical abstract
Figure 1
Figure 1
PIM1 is upregulated in the colon tissue of UC patients and mice with colitis. (A) Immunohistochemistry staining and quantitation of PIM1 in the colon tissue samples from healthy controls (n = 9) and patients with mild UC (n = 8) and severe UC (n = 8). (B) Pearson's correlation analysis between the PIM1 expression of colonic biopsies and ESR (erythrocyte sedimentation rate) from 13 patients with UC (Spearman's rank correlation coefficient, r = 0.5671, statistical analysis is performed using linear regression, P = 0.0433). (C) Box plot of PIM1 mRNA expression in healthy controls and UC patients from the GEO database. (D) Immunohistochemistry staining and quantitation of PIM1 in the colon tissue from wild-type mice with or without DSS treatment. n = 10 from 3 independent experiments. (E) Western blotting of PIM1 expression in the colon tissue from mice without or with DSS treatment (n = 4). (F, G) Immunohistochemistry staining and quantitation of PIM1 in the colon tissue from the indicated mice (n = 10 from 3 independent experiments). Scale bar: 50 μm. The data represent the mean ± SD. Statistical significance was determined by one-way ANOVA (A, F) or unpaired Student's t-test (C, D, and G).
Figure 2
Figure 2
PIM1 deficiency attenuates DSS-induced colitis symptoms. (A–F) WT and Pim1+/− mice were administered 1.5% DSS in drinking water for 7 days to induce colitis (n = 10 from 3 independent experiments). (A) Body weight loss of WT and Pim1+/− mice. (B) Disease activity index of WT and Pim1+/− mice. (C) Measurement and quantification of colon length in WT and Pim1+/− mice. (D) Representative H&E staining of colons and quantitation of histologic scores in colonic sections from DSS-challenged WT and Pim1+/− mice. (E) Alcian blue-Periodic acid Schiff (AB-PAS; goblet cells) staining and quantification in colonic sections from DSS-challenged WT and Pim1+/− mice. (F) Immunohistochemistry staining and quantitation of MUC2 in colonic sections from DSS-challenged WT and Pim1+/− mice. (G) Fluorescein isothiocyanate (FITC)-dextran measurement in plasma from WT and Pim1+/− mice at day 6 post-DSS treatment (n = 10 from 3 independent experiments). (H) Real-time PCR analysis of mRNA levels of the indicated proinflammatory cytokines in the colon tissue from DSS-challenged WT and Pim1+/− mice (n = 9 from 3 independent experiments). (I) Representative flow cytometry analysis of the indicated cells (left) and percentage (right) of indicated cells in mesenteric lymph nodes (MLN) and colonic lamina propria (cLP) from DSS-challenged WT and Pim1+/− mice (n = 10 from 3 independent experiments). Scale bar: 50 μm. The data represent the mean ± SD. Statistical significance was determined by two-way ANOVA (A, B) or unpaired Student's t-test (C–I).
Figure 3
Figure 3
Epithelial PIM1 overexpression promotes susceptibility to DSS-induced colitis. (A–F) WT and Pim1KIVillin-Cre mice were administered 1.5% DSS in drinking water for 7 days (n = 8 from 2 independent experiments. (A) Body weight loss of DSS-treated WT and Pim1KIVillin-Cre mice. (B) Disease activity index of DSS-treated WT and Pim1KIVillin-Cre mice. (C) Measurement and quantification of colon length in DSS-treated WT and Pim1KIVillin-Cre mice. (D) Representative H&E staining of colons and quantitation of histologic scores in colonic sections from DSS-challenged WT and Pim1KIVillin-Cre mice. (E) AB-PAS staining and quantification in colonic sections from DSS-challenged WT and Pim1KIVillin-Cre mice. (F) Immunohistochemistry staining and quantitation of MUC2 in colonic sections from DSS-challenged WT and Pim1KIVillin-Cre mice. (G) FITC-dextran measurement in plasma from WT and Pim1KIVillin-Cre mice on Day 6 post DSS treatment (n = 8 from 2 independent experiments). (H) Real-time PCR analysis of the relative mRNA levels of the indicated genes in the colon tissues from DSS-challenged WT and Pim1KIVillin-Cre mice (n = 8 from 2 independent experiments). (I) Representative flow cytometry analysis of the indicated cells (left) and percentage (right) of indicated cells in MLN and cLP from DSS-challenged WT and Pim1KIVillin-Cre mice (n = 8 from 2 independent experiments). Scale bar: 50 μm. The data represent the mean ± SD. Statistical significance was determined by two-way ANOVA (A, B) or unpaired Student's t-test (C–I).
Figure 4
Figure 4
PIM1 deficiency results in down-regulation of the Wnt and Notch signaling pathways. (A–G) Transcriptomic profiling of IECs from WT and Pim1+/− mice (n = 4 for each genotype). (A) Volcano plot displaying the differentially expressed genes in IECs from Pim1+/− mice compared with WT mice. Red indicates up-regulated genes; green indicates down-regulated genes; gray indicates non-differentially expressed genes (No-DEGS). (B) KEGG analysis of downregulated genes in IECs from Pim1+/− mice. (C) Heatmap depicting the relative expression of goblet cell signature genes. (D, E) Heatmap showing the relative expression of Wnt (D) and Notch (E) signaling pathway-related genes. (F, G) GSEA analysis showing enrichment of the Wnt (F) and Notch (G) signaling pathway gene set. (H, I) Representative confocal images and quantification of MUC2 staining (red) and DAPI (blue) in Caco2 cells as indicated (n = 3 from 3 independent experiments). Scale bar: 10 μm. The data represent the mean ± SD. Statistical significance was determined by one-way ANOVA (H, I).
Figure 5
Figure 5
PIM1 alters goblet cell differentiation by downregulating HDAC2 expression. (A) Silver staining and mass spectrometry analysis of PIM1 binding proteins in the indicated Caco2 cells. (B) Co-IP analysis of the interactions between FLAG-PIM1 and MYC-HDAC2 in Caco2 cells. (C) Endogenous Co-IP analysis of the interactions between PIM1 and HDAC2 in Caco2 cells. (D) In vitro pulldown assay examining the interactions between FLAG-PIM1 and MYC-HDAC2. (E) Proximity ligation assay in Caco2 cells expressing FLAG-PIM1 or Vector. (F) Western blotting analysis of HDAC2 phosphorylation with anti-phosphoserine or anti-phosphothreonine antibodies after IP assay with anti-MYC antibody in Caco2 cells. (G, H) Western blotting analysis of the protein levels of HDAC2 in Caco2 cells infected with FLAG-PIM1 overexpression (G) or PIM1 knockdown (H). The signal densities of HDAC2 were normalized to those of β-actin. Three independent experiments. (I) Immunohistochemistry staining and quantitation of HDAC2 in colonic sections from untreated WT and Pim1+/− mice (n = 10 from 2 independent experiments). (J) Immunohistochemistry staining and quantitation of HDAC2 in colonic sections from untreated WT and Pim1KIVillin-Cre mice (n = 8 from 2 independent experiments). (K) Immunohistochemistry staining and quantitation of HDAC2 using colonic biopsies from healthy controls (n = 9) and patients with UC (n = 11) (left). Pearson's correlation analysis between HDAC2 and PIM1 protein expression of colonic biopsies from 11 patients with UC (Spearman's rank correlation coefficient, r = −0.6201, statistical analysis is performed using linear regression, P = 0.0418) (right). (L) Pearson's correlation analysis between HDAC2 and PIM1 mRNA expression in intestinal biopsies of healthy controls and UC patients from the publicly available GEO database (Spearman's rank correlation coefficient, r = −0.318, statistical analysis is performed using linear regression, P = 0.0058). (M) Representative confocal images and quantification of MUC2 staining (red) and DAPI (blue) in the indicated Caco2 cells (n = 3 from 3 independent experiments). Scale bar: 10 μm. The data represent the mean ± SD. Statistical significance was determined by unpaired Student's t-test (I–K) or one-way ANOVA (M).
Figure 6
Figure 6
HDAC2 participates in PIM1-regulated goblet cell differentiation through the Wnt signaling pathway. (A–G) ChIP-seq analysis of HDAC2 in Caco2 cells infected with FLAG-PIM1 overexpression. (A) Aggregate plots of HDAC2 signals in the region −3 kb from the TSS to +3 kb from the TES. (B) Heatmap of HDAC2 peak signals with peaks subset into those upregulated (top) or downregulated (bottom) in the PIM1 group. (C) Venn diagram showing the number of HDAC2 unique peaks in the vector or PIM1 group. (D) Genome-wide distribution of differential HDAC2 peaks between the vector and PIM1 group. (E) DNA motif enrichment from downregulated HDAC2 peaks in the PIM1 group relative to the vector group. (F) KEGG analysis of downregulated genes in the PIM1 group. (G) Representative IGV tracks of Wnt signaling-related genes. (H) ChIP-qPCR analysis for HDAC2 at the promotor of Wnt signaling-related genes. (I) Heatmap showing the relative expression of Wnt signaling pathway-related genes in Caco2 cells with PIM1 overexpression. (J) Real-time PCR analysis of mRNA levels of Wnt signaling pathway-related genes in Caco2 cells with PIM1 overexpression (n = 5 from 3 independent experiments). (K) Heatmap showing the relative expression of Wnt signaling pathway-related genes in IECs from WT and Pim1+/− mice. (L) Real-time PCR analysis of mRNA levels of Wnt signaling pathway-related genes in IECs from WT and Pim1+/− mice (n = 8 from 2 independent experiments). The data represent the mean ± SD. Statistical significance was determined by unpaired Student's t-test (H, J, and L).
Figure 7
Figure 7
Epithelial PIM1 overexpression promotes AOM/DSS-induced CAC. (A–E) WT and Pim1KIVillin-Cre mice were treated with AOM-DSS (n = 10 from 2 independent experiments). (A) Schematic overview of the AOM/DSS-induced CAC model. (B) Body weight loss of AOM/DSS-treated WT and Pim1KIVillin-Cre mice. (C) Quantitation of tumor number and load in colonic tissues from WT and Pim1KIVillin-Cre mice. (D) Representative images of H&E staining in colonic tumor tissues from WT and Pim1KIVillin-Cre mice. (E) Immunohistochemistry staining and quantitation of Ki-67 in colonic tumor tissues from WT and Pim1KIVillin-Cre mice. (F) PIM1 mRNA expression levels in the CRC cohort from TCGA (left). PIM1 mRNA expression levels at different tumor stages (right). (G) Kaplan–Meier analysis of the overall survival of the CRC cohort from TCGA. (H) Box plot of PIM1 mRNA expression in normal tissues and CRC tissues from the GEO database. (I, J) Immunohistochemistry staining and quantitation of PIM1 (I) and HDAC2 (J) in para-carcinoma and cancer tissues (left) (n = 44). PIM1 and HDAC2 expression levels at different tumor stages from Ⅰ to Ⅳ (right). Scale bar: 50 μm or 100 μm. The data represent the mean ± SD. Statistical significance was determined by two-way ANOVA (B), unpaired Student's t-test (C, E, F, and H), one-way ANOVA (F, I, and J), or paired Student's t-test (I, J).

References

    1. Kobayashi T., Siegmund B., Le Berre C., Wei S.C., Ferrante M., Shen B., et al. Ulcerative colitis. Nat Rev Dis Prim. 2020;6:74. - PubMed
    1. Burisch J., Zhao M., Odes S., De Cruz P., Vermeire S., Bernstein C.N., et al. The cost of inflammatory bowel disease in high-income settings: a Lancet Gastroenterology & Hepatology Commission. Lancet Gastroenterol Hepatol. 2023;8:458–492. - PubMed
    1. Du L., Ha C. Epidemiology and pathogenesis of ulcerative colitis. Gastroenterol Clin N Am. 2020;49:643–654. - PubMed
    1. An J., Liu Y., Wang Y., Fan R., Hu X., Zhang F., et al. The role of intestinal mucosal barrier in autoimmune disease: a potential target. Front Immunol. 2022;13 - PMC - PubMed
    1. Gelmez E., Jeron A., Bruder D. Negative elongation factor: a key factor in the maintenance of intestinal epithelial barrier integrity. Cell Mol Immunol. 2022;19:453–455. - PMC - PubMed

LinkOut - more resources