. 2024 Jul;14(7):3027-3048.
doi: 10.1016/j.apsb.2024.03.008. Epub 2024 Mar 12.

ASF1A-dependent P300-mediated histone H3 lysine 18 lactylation promotes atherosclerosis by regulating EndMT

Affiliations

ASF1A-dependent P300-mediated histone H3 lysine 18 lactylation promotes atherosclerosis by regulating EndMT

Mengdie Dong et al. Acta Pharm Sin B. 2024 Jul.

Abstract

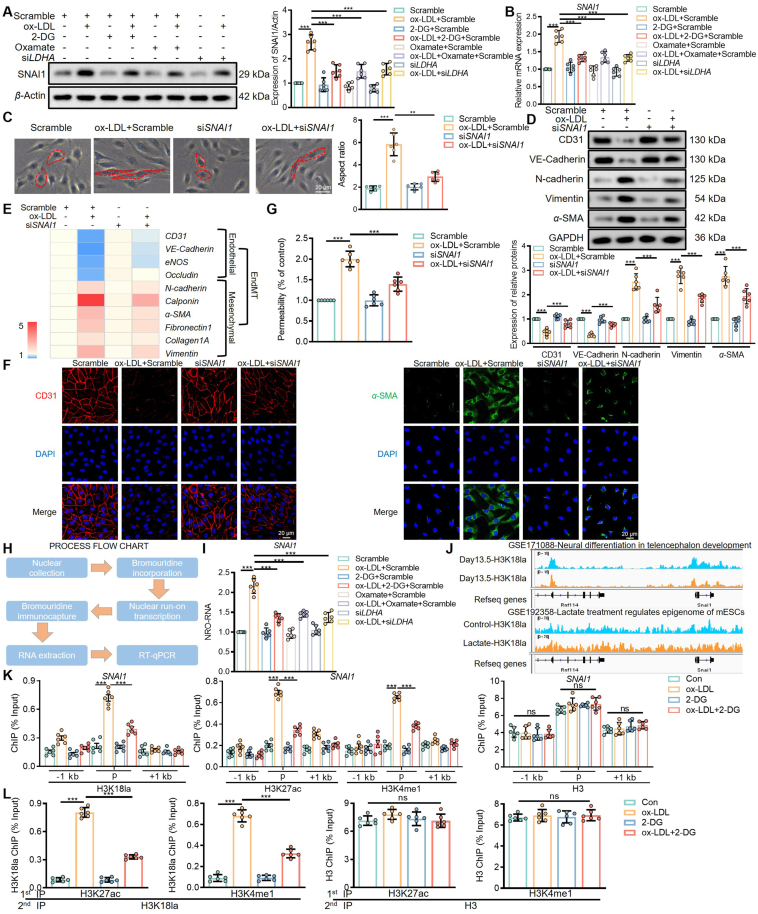
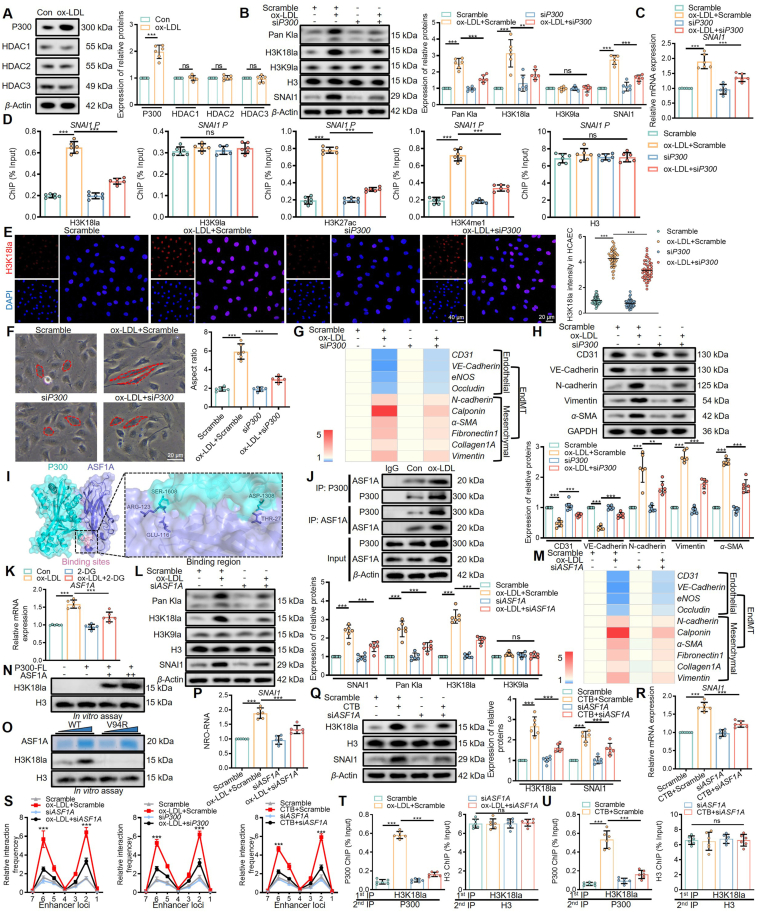
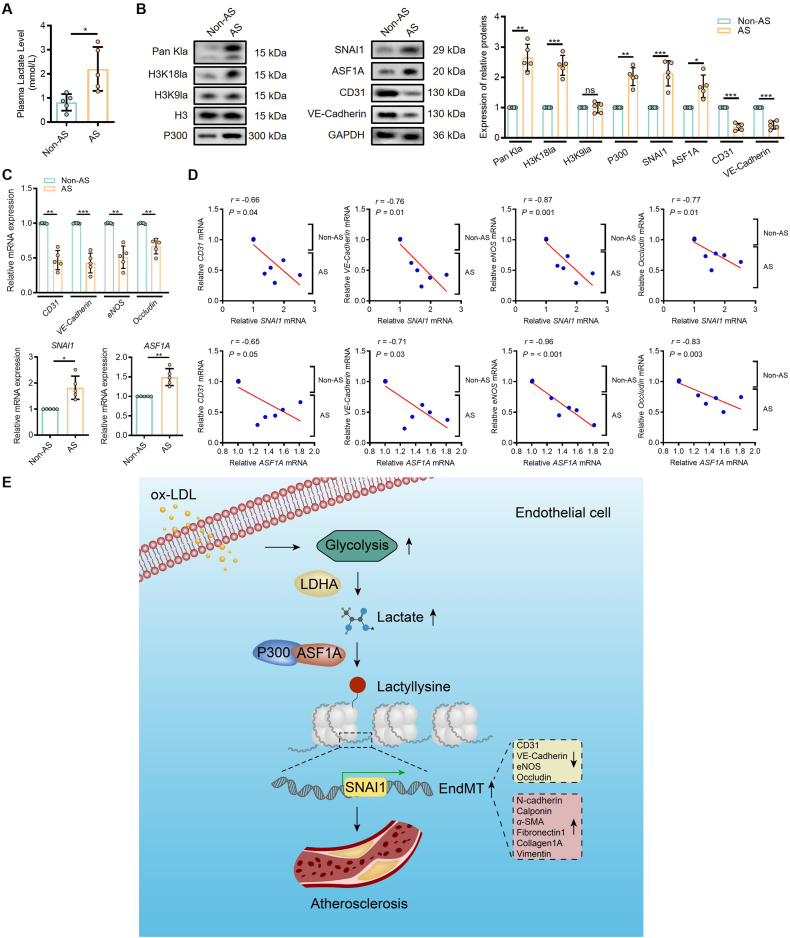
Endothelial-to-mesenchymal transition (EndMT) is a key driver of atherosclerosis. Aerobic glycolysis is increased in the endothelium of atheroprone areas, accompanied by elevated lactate levels. Histone lactylation, mediated by lactate, can regulate gene expression and participate in disease regulation. However, whether histone lactylation is involved in atherosclerosis remains unknown. Here, we report that lipid peroxidation could lead to EndMT-induced atherosclerosis by increasing lactate-dependent histone H3 lysine 18 lactylation (H3K18la) in vitro and in vivo, as well as in atherosclerotic patients' arteries. Mechanistically, the histone chaperone ASF1A was first identified as a cofactor of P300, which precisely regulated the enrichment of H3K18la at the promoter of SNAI1, thereby activating SNAI1 transcription and promoting EndMT. We found that deletion of ASF1A inhibited EndMT and improved endothelial dysfunction. Functional analysis based on Apoe KO Asf1a ECKO mice in the atherosclerosis model confirmed the involvement of H3K18la in atherosclerosis and found that endothelium-specific ASF1A deficiency inhibited EndMT and alleviated atherosclerosis development. Inhibition of glycolysis by pharmacologic inhibition and advanced PROTAC attenuated H3K18la, SNAI1 transcription, and EndMT-induced atherosclerosis. This study illustrates precise crosstalk between metabolism and epigenetics via H3K18la by the P300/ASF1A molecular complex during EndMT-induced atherogenesis, which provides emerging therapies for atherosclerosis.

Keywords: ASF1A; Atherosclerosis; Endothelial dysfunction; Endothelial-to-mesenchymal transition; Epigenetic; Histone lactylation; Lactate; SNAI1.


Conflict of interest statement

The authors declare no conflicts of interest.

Figures

Image 1
Graphical abstract
Figure 1
Figure 1
Lipid peroxidation promotes EndMT by increasing lactate level. (A) Expression profiling by array assessing changes in endothelial cell markers in ox-PAPC-treated human aortic endothelial cells (GSE72633). The results are presented as a heat map, arranged from blue (low values) to red (high values). (B) Lactate levels in untreated and 50 μg/mL ox-LDL-treated HCAECs for 24 h (n = 6). (C) The morphology of HCAECs after ox-LDL and lactate treatment (n = 6). (D) EC markers VE-cadherin and CD31, as well as EndMT markers α-SMA, N-cadherin, and Vimentin, were detected in ox-LDL and lactate-treated ECs by Western blot (n = 6). (E) RT-qPCR analysis of EndMT markers in ox-LDL and lactate-treated HCAECs (n = 6). Each box color in the heat map corresponds to the average of the data from the corresponding 6 independent experiments. The column graphs with individual values and significance tests for each mRNA in the heat map are shown in Fig. S1A. (F) Real-time ECAR in control and ox-LDL cells with or without siLDHA treatment were measured at 20, 40, 60, 80, and 100 min by using the Seahorse Bioscience Extra Cellular Flux Analyzer (n = 6). (G) Lactate levels in 2-DG, oxamate, and siLDHA-treated ECs (n = 6). (H) The morphology of HCAECs after 2 mmol/L 2-DG, 10 mmol/L oxamate, and siLDHA treatment for 24 h (n = 6). (I)–(K) ECs markers and EndMT markers were detected in 2-DG, oxamate and siLDHA-treated HCAECs by Western blot (n = 6). (L) RT-qPCR analysis of EndMT markers in siLDHA-treated ECs (n = 6). Each box color in the heat map corresponds to the average of the data from the corresponding 6 independent experiments. The column graphs with individual values and significance tests for each mRNA in the heat map are shown in Fig. S1D. (M) Cell permeability of HCAECs after 2-DG, oxamate, and siLDHA treatment (n = 6). (N) Cellular immunofluorescence analysis of ECs permeability after 2-DG treatment (n = 6). (B) was analyzed by unpaired two-tailed student's t-test. (C)–(M) were analyzed by Ordinary one-way ANOVA with Tukey's multiple comparisons test. Data are shown as mean ± SD; ∗∗P < 0.01, ∗∗∗P < 0.001. VE-cadherin: vascular endothelial cadherin; eNOS: endothelial nitric oxide synthases; HCAECs: human coronary artery endothelial cells; ox-LDL: oxidized low-density lipoprotein; ECAR: extracellular acidification rate; 2-DG: 2-deoxy-d-glucose; LDHA: lactate dehydrogenase A.
Figure 2
Figure 2
Increased histone H3K18 lactylation is involved in endothelial dysfunction induced by lipid peroxidation. (A) Pan Kla was detected in ox-LDL and lactate-treated HCAECs and MAECs by Western blot (n = 6). (B) Pan Kla, H3K18la, H3K56la, H3K9la, and H3K14la were detected in ox-LDL-treated HCAECs and MAECs by Western blot (n = 6). (C) H3K18la levels were visualized by immunofluorescence staining (n = 6). Scale bar, 20 μm. (D) Pan Kla and H3K18la were detected in the aortic tissues from atherosclerotic patients or non-atherosclerotic patients by Western blot (n = 5 human samples per group). (E) H3K18la levels were observed by enface staining of animal aortic tissues (n = 6 mice per group). Scale bar, 20 μm. (F)–(H) Pan Kla and H3K18la were detected in 2-DG, oxamate, and siLDHA-treated HCAECs by Western blot (n = 6). (B)–(D) were analyzed by Unpaired t-test with Welch's correction. (F)–(H) were analyzed by Ordinary one-way ANOVA with Tukey's multiple comparisons test. Data are shown as mean ± SD; ∗P < 0.05, ∗∗P < 0.01, ∗∗∗P < 0.001; ns, not significant. Pan Kla: pan-lysine lactylation; H3K18la: histone H3 lysine 18 lactylation; MAECs: mouse aortic endothelial cells; AS: atherosclerosis; Apoe: apolipoprotein E; NC: normal chow; HFD: high-fat diet.
Figure 3
Figure 3
Lipid peroxidation induces EndMT through H3K18la-enriched SNAI1. (A) SNAI1 was detected in 2-DG, oxamate, and siLDHA-treated HCAECs by Western blot (n = 6). (B) RT-qPCR analysis of SNAI1 in HCAECs (n = 6). (C) The morphology of ox-LDL-treated HCAECs after interfering with SNAI1 (n = 6). (D) EndMT markers were detected in ox-LDL-treated HCAECs after interfering with SNAI1 by Western blot (n = 6). (E) RT-qPCR analysis of EndMT markers (n = 6). Each box color in the heat map corresponds to the average of the data from the corresponding 6 independent experiments. The column graphs with individual values and significance tests for each mRNA in the heat map are shown in Fig. S2C. (F) CD31 and α-SMA levels were visualized by immunofluorescence staining (n = 6). Scale bar, 20 μm. (G) Cell permeability of ox-LDL-treated HCAECs after siSNAI1 treatment (n = 6). (H) Workflow chart for NRO, bromouridine immunocapture, and RT-qPCR. (I) Transcriptional regulation of SNAI1 was analyzed by NRO assay (n = 6). (J) ChIP-seq peaks around SNAI1 from GSE171088 and GSE192358. (K) ChIP detection of binding sites of H3K18la at −1 kb from the promoter, the promoter, and +1 kb from the promoter region of SNAI1. ChIP detection of the degree of binding of control H3 to SNAI1 (n = 6). (L) Re-ChIP was performed with the first round including H3K27ac or H3K4me1 antibodies and a second round of pull-down with H3K18la antibodies (n = 6). (A)–(E), (G), (I), (K), and (L) were analyzed by Ordinary one-way ANOVA with Tukey's multiple comparisons test. (C) was analyzed by Brown–Forsythe and Welch ANOVA followed by Dunnett's T3 multiple comparisons test. Data are shown as mean ± SD; ∗∗P < 0.01, ∗∗∗P < 0.001. NRO: nuclear run-on; ChIP: chromatin Immunoprecipitation.
Figure 4
Figure 4
The P300–ASF1A complex constitutes a chromosomal microenvironment to regulate the expression of SNAI1 via H3K18la. (A) P300 and HDAC1–3 were detected in ox-LDL-treated HCAECs by Western blot (n = 6). (B) Pan Kla, H3K18la, H3K9la, and SNAI1 levels were detected in ox-LDL-treated HCAECs after interfering with P300 by Western blot (n = 6). (C) RT-qPCR analysis of SNAI1 in ox-LDL-treated HCAECs after interfering with P300 (n = 6). (D) ChIP analysis of the enrichment at the promoter of SNAI1 (n = 6). (E) H3K18la levels were visualized by immunofluorescence staining (n = 6). Scale bar, 20 μm. (F) The morphology of ox-LDL-treated HCAECs after interfering with P300 (n = 6). (G) RT-qPCR analysis of endothelial mesenchymal transition markers in ox-LDL-treated HCAECs after interfering with P300 (n = 6). Each box color in the heat map corresponds to the average of the data from the corresponding 6 independent experiments. The column graphs with individual values and significance tests for each mRNA in the heat map are shown in Fig. S3B. (H) Endothelial-like cell markers VE-Cadherin and CD31, as well as mesenchymal-like cells α-SMA and Vimentin were detected in ox-LDL-treated HCAECs after interfering with P300 by Western blot (n = 6). (I) Molecular docking diagram (http://hdock.phys.hust.edu.cn/) of ASF1A and P300. (J) Co-immunoprecipitation analysis of ASF1A-P300 binding in ox-LDL-treated HCAECs (n = 6). (K) RT-qPCR analysis of ASF1A expression in ox-LDL and 2-DG-treated ECs (n = 6). (L) Pan Kla, H3K18la, H3K9la, and SNAI1 were detected in ox-LDL and siASF1A-treated HCAECs by Western blot (n = 6). (M) RT-qPCR analysis of endothelial mesenchymal transition markers in ox-LDL-treated HCAECs after interfering with ASF1A (n = 6). Each box color in the heat map corresponds to the average of the data from the corresponding 6 independent experiments. The column graphs with individual values and significance tests for each mRNA in the heat map are shown in Fig. S3E. (N) In vitro assays to monitor H3K18 lactylation with H3–H4 substrates in the presence of full-length P300 (P300-FL) in the presence or absence of ASF1A (n = 6). (O) In vitro, assays were performed with P300 in the presence of increasing concentrations of wild-type (WT) ASF1A or ASF1A-V94R mutant (defective in interaction with histones). ASF1A proteins are shown by Coomassie brilliant blue staining. H3K18la was detected by Western blot (n = 6). (P) The transcription of SNAI1 in HCAECs treated with ox-LDL or siASF1A was analyzed by NRO-RNAs (n = 6). (Q) H3K18la and SNAI1 were detected in CTB and siASF1A-treated HCAECs by Western blot (n = 6). (R) RT-qPCR analysis of SNAI1 expression in CTB-treated HCAECs after interfering with ASF1A (n = 6). (S) 3C-qPCR analysis of long–range interactions between the SNAI1 promoter and seven binding sites in ox-LDL-treated HCAECs combined with the deficiency of ASF1A or P300 and CTB-treated HCAECs after interfering with ASF1A (n = 6). (T) Re-ChIP was performed with the first round with H3K18la antibody and a second round of pull-down with P300 antibodies in HCAECs treated with ox-LDL or siASF1A (n = 6). (U) Re-ChIP was performed with the first round with H3K18la antibody and a second round of pull-down with P300 antibodies in HCAECs treated with CTB or siASF1A (n = 6). (A) was analyzed by unpaired t-test with Welch's correction. (B)–(D), (G) and (H), (K)–(M), (P)–(R), and (T) were analyzed by Ordinary one-way ANOVA with Tukey's multiple comparisons test. (E), (F) and (U) were analyzed by Brown–Forsythe and Welch ANOVA followed by Dunnett's T3 multiple comparisons test. (S) was analyzed by Two-way ANOVA followed by a post hoc test. Data are shown as mean ± SD; ∗P < 0.05, ∗∗P < 0.01, ∗∗∗P < 0.001; ns, not significant. HDAC: histone deacetylase; 3C-qPCR: chromatin conformation capture assay-qPCR; ASF1A: anti-silencing function 1A; CTB: cholera toxin B.
Figure 5
Figure 5
Asf1a-specific deletion in ECs ameliorates EndMT and atherosclerosis in ApoeKO mice. (A) Blood lactate levels in NC-fed and HFD-fed ApoeKO mice (n = 10 mice per group). (B) Pan Kla, H3K9la, and H3K18la were detected in NC-fed and HFD-fed ApoeKO mice by Western blot (n = 6 mice per group). (C) Representative images of aortas stained with Oil Red O from ApoeKOAsf1aWT and ApoeKOAsf1aECKO mice fed with an NC or HFD. The quantitative data of Oil Red O staining of mouse blood vessels (n = 6 mice per group). (D) Atherosclerotic lesion formation was detected by H&E, Oil Red O, Sirius red, and Masson's trichrome staining (n = 6 mice per group). Scale bar, 100 μm. Quantification of lesions area and Oil Red O area. Percentage of necrotic core and collagen area. (E) Confocal microscopic image of double immunofluorescence staining with CD31 (green) and α-SMA (red); nuclei were counter-stained with DAPI (blue) (n = 6 mice per group). Scale bars, 50 μm. (F) Confocal microscopic image of double immunofluorescence staining with CD31 (green) and H3K18la (red); nuclei were counter-stained with DAPI (blue) (n = 6 mice per group). Scale bars, 20 μm. (G) The morphology of MAECs extracted from the aorta of ApoeKOAsf1aWT and ApoeKOAsf1aECKO mice fed with an NC or HFD (n = 6 mice per group). (H) ECAR of NC-fed and HFD-fed ApoeKOAsf1aECKO mice were monitored by using the Seahorse Bioscience Extra Cellular Flux Analyzer in real-time. Real-time ECAR was measured at 20, 40, 60, 80, and 100 min (n = 6 mice per group). (I) Pan Kla, H3K18la, H3K9la, VE-Cadherin, CD31, N-cadherin, α-SMA, and Vimentin levels were detected in MAECs extracted from ApoeKOAsf1aWT and ApoeKOAsf1aECKO mice by Western blot (n = 6 mice per group). (J) RT-qPCR analysis of EndMT markers in NC-fed and HFD-fed ApoeKOAsf1aECKO mice (n = 10 mice per group). Each box color in the heat map corresponds to the average of the data from the corresponding 10 independent experiments. The column graphs with individual values and significance tests for each mRNA in the heat map are shown in Fig. S4D. (K) ChIP analysis of the enrichment of P300 and H3K18la at the promoter region of Snai1 in MAECs extracted from ApoeKOAsf1aWT and ApoeKOAsf1aECKO mice (n = 6 mice per group). (L) 3C-qPCR analysis of long-distance interactions between the Snai1 promoter region and seven loci in MAECs extracted from ApoeKOAsf1aWT and ApoeKOAsf1aECKO mice (n = 6 mice per group). (M) Re-ChIP was performed with the first round with H3K18la antibody and a second round of pull-down with P300 antibody in MAECs extracted from ApoeKOAsf1aWT and ApoeKOAsf1aECKO mice (n = 6 mice per group). (A) was analyzed by unpaired two-tailed student's t-test. (B) was analyzed by unpaired t-test with Welch's correction. (C) and (D), (G), (I)–(K), and (M) were analyzed by Ordinary one-way ANOVA with Tukey's multiple comparisons test. (L) was analyzed by Two-way ANOVA followed by a post hoc test. Data are shown as mean ± SD; ∗∗P < 0.01, ∗∗∗P < 0.001; ns, not significant. H&E: hematoxylin & eosin.
Figure 6
Figure 6
Pharmacological inhibition of lactate levels reduces EndMT and atherosclerosis in ApoeKO mice. (A) The plasma levels of T-CHO, LDL-C, TG, and HDL-C levels in HFD-fed ApoeKO mice fed with or without 2-DG (50 mg/kg, q.d. for 12 weeks) measured by corresponding kits (n = 6 mice per group). (B) Representative images of aortas stained with Oil Red O from HFD-fed ApoeKO mice fed with or without 2-DG. The quantitative data of Oil Red O staining of mouse blood vessels (n = 6 mice per group). (C) Atherosclerotic lesion formation detected by H&E, Oil Red O, Sirius red, and Masson's trichrome staining (n = 6 mice per group). Scale bar, 100 μm. Quantification of lesions area and Oil Red O area. Percentage of necrotic core and collagen area. (D) Confocal microscopy images of mouse blood vessel cross-sections double immunofluorescence stained with CD31 (green) and α-SMA (red); nuclei counterstained with DAPI (blue) (n = 6 mice per group). Scale bar, 50 μm. (E) Western blot analysis of Pan Kla and H3K18la in the MAECs extracted from HFD-fed ApoeKO after 2-DG treatment (n = 6 mice per group). (F) RT-qPCR analysis of EndMT markers in MAECs extracted from HFD-fed ApoeKO after 2-DG treatment (n = 10 mice per group). (G) ChIP analysis of the enrichment of P300 and H3K18la at the promoter region of Snai1 in MAECs extracted from HFD-fed ApoeKO after 2-DG treatment (n = 6 mice per group). (H) Re-ChIP was performed with the first round with H3K18la antibody and a second round of pull-down with P300 antibodies in MAECs extracted from HFD-fed ApoeKO after 2-DG treatment (n = 6 mice per group). (A)–(C), (G), and (H) were analyzed by unpaired two-tailed student's t-test. (E) and (F) were analyzed by unpaired t-test with Welch's correction. Data are shown as mean ± SD; ∗∗P < 0.01, ∗∗∗P < 0.001; ns, not significant. HDL-C: high-density lipoprotein cholesterol; LDL-C: low-density lipoprotein cholesterol; T-CHO: total cholesterol; TG: triglyceride.
Figure 7
Figure 7
PROTAC HK2 Degrader-1 reduces EndMT and atherosclerosis in ApoeKO mice. (A) Chemical Structure and schematic of PROTAC HK2 Degrader-1 mode of action. (B) Western blot analysis of HK2 in HCAECs treated with the indicated concentration of PROTAC HK2 Degrader-1 for 36 h (n = 6). (C) Western blot analysis of HK2 in HCAECs treated with 0.5 μmol/L PROTAC HK2 Degrader-1 for the indicated incubation time (n = 6). (D) Viability of HCAECs after treatment with PROTAC HK2 Degrader-1 for 48 h by CCK-8 assay (n = 6). (E) Western blot analysis of HK2 in HCAECs pretreated with 2 μmol/L MG132 for 2 h before being treated with 0.5 μmol/L PROTAC HK2 Degrader-1 for 36 h (n = 6). (F) Western blot analysis of HK1 and HK2 protein levels in HCAECs after incubation with 0.5 μmol/L PROTAC HK2 Degrader-1 for 36 h. (n = 6). (G) Lactate level of HCAECs treated with 0.5 μmol/LPROTAC HK2 Degrader-1 for 36 h (n = 6). (H) Representative images of aortas stained with Oil Red O from HFD-fed ApoeKO mice given intraperitoneal injections with Vehicle control or PROTAC HK2 Degrader-1 (5 mg/kg, q.o.d. for 12 weeks). The quantitative data of Oil Red O staining of mouse blood vessels (n = 6 mice per group). (I, J) Atherosclerotic lesion formation detected by H&E, Oil Red O, Sirius red, and Masson's trichrome staining (n = 6 mice per group). Scale bar, 100 μm. Quantification of lesions area and Oil Red O area. Percentage of necrotic core and collagen area. (K) Western blot analysis of H3K18la and EndMT markers in the MAECs extracted from HFD-fed ApoeKO after PROTAC HK2 Degrader-1 treatment (n = 6 mice per group). (L) RT-qPCR analysis of EndMT markers in MAECs extracted from HFD-fed ApoeKO after PROTAC HK2 Degrader-1 treatment (n = 10 mice per group). (B), (C), (D), (E), and (G) were analyzed by Ordinary one-way ANOVA with Tukey's multiple comparisons test. (H)–(J) were analyzed by unpaired two-tailed student's t-test. (K), (F), and (L) were analyzed by unpaired t-test with Welch's correction. Data are shown as mean ± SD; ∗∗P < 0.01, ∗∗∗P < 0.001; ns, not significant. PROTAC: proteolysis-targeting chimera; HK2: Hexokinase 2.
Figure 8
Figure 8
H3K18la and ASF1A may be clinically involved in EndMT and atherosclerosis. (A) Plasma lactate level in patients with atherosclerosis (n = 5 human samples per group). (B) Pan Kla, H3K18la, H3K9la, P300, endothelial-like cell markers VE-cadherin and CD31, SNAI1, and ASF1A levels were detected in human atherosclerotic arteries by Western blot (n = 5 human samples per group). (C) RT-qPCR analysis of vascular endothelial markers, ASF1A, and SNAI1 in human atherosclerotic arteries (n = 5 human samples per group). (D) Linear regression analysis of SNAI1 and ASF1A with EndMT markers. (E) Model of the crosstalk between glycolysis metabolism and H3K18la, detailed in discussion. (A) was analyzed by unpaired two-tailed student's t-test. (B) and (C) were analyzed by unpaired t-test with Welch's correction. Data are shown as mean ± SD; ∗P < 0.05, ∗∗P < 0.01, ∗∗∗P < 0.001; ns, not significant.

References

    1. Herrington W., Lacey B., Sherliker P., Armitage J., Lewington S. Epidemiology of atherosclerosis and the potential to reduce the global burden of atherothrombotic disease. Circ Res. 2016;118:535–546. - PubMed
    1. Cen X., Wang B., Liang Y., Chen Y., Xiao Y., Du S., et al. Small molecule SMU-CX24 targeting toll-like receptor 3 counteracts inflammation: a novel approach to atherosclerosis therapy. Acta Pharm Sin B. 2022;12:3667–3681. - PMC - PubMed
    1. Xu S., Ilyas I., Little P.J., Li H., Kamato D., Zheng X., et al. Endothelial dysfunction in atherosclerotic cardiovascular diseases and beyond: from mechanism to pharmacotherapies. Pharmacol Rev. 2021;73:924–967. - PubMed
    1. Li X., Chen X., Zheng L., Chen M., Zhang Y., Zhu R., et al. Non-canonical STING–PERK pathway dependent epigenetic regulation of vascular endothelial dysfunction via integrating IRF3 and NF-κB in inflammatory response. Acta Pharm Sin B. 2023;13:4765–4784. - PMC - PubMed
    1. Bischoff J. Endothelial-to-mesenchymal transition. Circ Res. 2019;124:1163–1165. - PMC - PubMed

LinkOut - more resources