. 2024 Jul;14(7):3232-3250.
doi: 10.1016/j.apsb.2024.03.005. Epub 2024 Mar 8.

A novel marine-derived anti-acute kidney injury agent targeting peroxiredoxin 1 and its nanodelivery strategy based on ADME optimization

Affiliations

A novel marine-derived anti-acute kidney injury agent targeting peroxiredoxin 1 and its nanodelivery strategy based on ADME optimization

Ping Yu et al. Acta Pharm Sin B. 2024 Jul.

Abstract

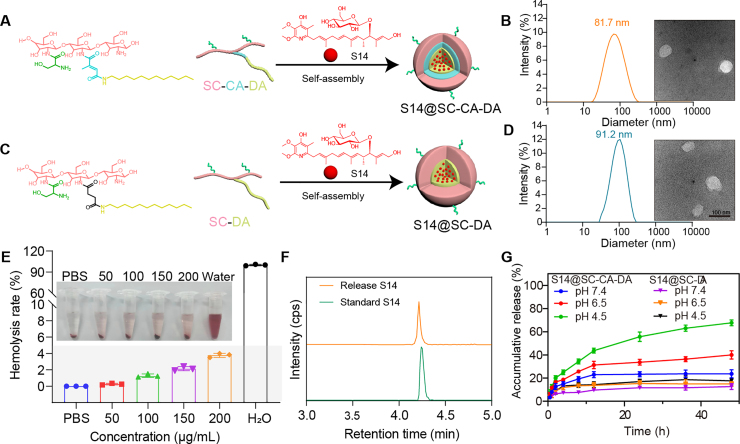
Insufficient therapeutic strategies for acute kidney injury (AKI) necessitate precision therapy targeting its pathogenesis. This study reveals the new mechanism of the marine-derived anti-AKI agent, piericidin glycoside S14, targeting peroxiredoxin 1 (PRDX1). By binding to Cys83 of PRDX1 and augmenting its peroxidase activity, S14 alleviates kidney injury efficiently in Prdx1-overexpression (Prdx1-OE) mice. Besides, S14 also increases PRDX1 nuclear translocation and directly activates the Nrf2/HO-1/NQO1 pathway to inhibit ROS production. Due to the limited druggability of S14 with low bioavailability (2.6%) and poor renal distribution, a pH-sensitive kidney-targeting dodecanamine-chitosan nanoparticle system is constructed to load S14 for precise treatment of AKI. l-Serine conjugation to chitosan imparts specificity to kidney injury molecule-1 (Kim-1)-overexpressed cells. The developed S14-nanodrug exhibits higher therapeutic efficiency by improving the in vivo behavior of S14 significantly. By encapsulation with micelles, the AUC0‒t , half-life time, and renal distribution of S14 increase 2.5-, 1.8-, and 3.1-fold, respectively. The main factors contributing to the improved druggability of S14 nanodrugs include the lower metabolic elimination rate and UDP-glycosyltransferase (UGT)-mediated biotransformation. In summary, this study identifies a new therapeutic target for the marine-derived anti-AKI agent while enhancing its ADME properties and druggability through nanotechnology, thereby driving advancements in marine drug development for AKI.

Keywords: ADME; Acute kidney injury; Druggability; Kim-1 targeted; Marine drug; Nanodrug; Peroxiredoxin 1; Piericidin glycoside.


Conflict of interest statement

The authors declare no conflicts of interest.

Figures

Image 1
Graphical abstract
Figure 1
Figure 1
PRDX1 overexpression attenuated AKI and S14 relieves renal function in UIRI mice via upregulating PRDX1. (A) Chemical structure of S14. (B) Scheme of S14 treatment. (C) Kidney photographs from Control and Prdx1-OE mice in the UIRI group. (D) H&E staining from Control and Prdx1-OE mice in the indicated groups (scale bar = 100 μm). (E) Immunohistochemistry for PRDX1 in kidney tissues (scale bar = 100 μm). (F) The mRNA expression of Kim-1, Il-6, and Tnf-a in the kidney from Control and Prdx1-OE mice in each group. Data are mean ± SD (n = 5). (G, H) Serum creatinine (Scr) and BUN levels from Control and Prdx1-OE mice in the indicated groups. Data are mean ± SD (n = 5). (I) MDA and GSH levels from Control and Prdx1-OE mice in the indicated groups. (J) Protein expression of PRDX1, Nrf2, and NQO1 in the kidney from Control and Prdx1-OE mice in the indicated groups. (K) Quantification of the protein immunoblots of PRDX1, Nrf2, and NQO1. Data are presented as mean ± SD (n = 3). ∗P < 0.05, ∗∗P < 0.01, ∗∗∗P < 0.001 and ∗∗∗∗P < 0.0001.
Figure 2
Figure 2
S14 reduced H2O2-induced cell apoptosis through regulating PRDX1/Nrf2 in HK-2. (A) The viability of HK-2 cells after H2O2 treatment and treatment with or without S14. Data are presented as mean ± SD (n = 5) (B) The mRNA expression of KIM-1, IL-6, and TNF-a in HK-2 cells. Data are presented as mean ± SD (n = 3). (C) Representative Western blot results for PRDX1, Nrf2, NQO1, and HO-1 in HK-2 after H2O2 treatment and treatment with or without S14. (D) Quantification of the Western blot data from (C). (E) Fluorescence images of the DCFH-DA probe for hydrogen peroxide in HK-2 cells (scale bar = 100 μm). (F) Fluorescence images of JC-1 staining in HK-2 cells (scale bar = 20 μm). (G) The ROS mean fluorescence intensity of (E). (H) The mean ratio of fluorescence intensity of JC-1 aggregates and JC-1 monomers in (F). (I) Protein expression of PRDX1 in HK-2 cells was transiently transfected with PRDX1 siRNA (50 nmol/L) for 48 h. Data are presented as mean ± SD (n = 3). (J) The intracellular ROS detection in HK-2 cells was transiently transfected with PRDX1 siRNA, followed by treatment with S14 for another 24 h (scale bar = 100 μm). Data are mean ± SD (n = 3). (K) The ROS mean fluorescence intensity of (J). (L) Representative immunoblots results for Nrf2 and PRDX1 in HK-2 cells transfected with PRDX1-siRNA after H2O2 treatment and treatment with or without S14. (M) Quantification of the immunoblots data from (L). (N) Representative images for immunofluorescent staining of HK-2 treated with S14 after co-incubating for 24 h (scale bar = 20 μm). PRDX1 (green), nuclei (blue). Data are mean ± SD (n = 3) (O) Immunoblot analysis of PRDX1 protein in nuclear and cytosol extracts of HK-2 cells treated with S14. (P) Quantification of the immunoblots data from (O). (Q) Representative immunoprecipitation analysis of the binding of PRDX1 to Nrf2 in HK-2 and treatment with or without S14. (R) Confocal microscopy images of Nrf2 (green) and PRDX1 (red) (scale bar = 20 μm). Data are mean ± SD (n = 3). P-values are indicated as ∗P < 0.05, ∗∗P < 0.01, ∗∗∗P < 0.01 and ∗∗∗∗P < 0.0001. ns, not significant. #P < 0.05, ##P < 0.01 and ###P < 0.001 as compared with H2O2 group.
Figure 3
Figure 3
S14 binds to the PRDX1 protein. (A) The affinity activities of S14 to PRDX1 protein were analyzed using the SPR assay. (B) Cellular thermal shift assay (CETSA)-Western blot to test the interactions of S14 and PRDX1. (C) The relative immunoblotting band density is analyzed. (D) Cellular thermal shift assay of WT PRDX1 or mutated PRDX1 in HK-2 cells treated with or without S14. (E–H) The relative immunoblotting band density is analyzed. Data are mean ± SD (n = 3).
Figure 4
Figure 4
Preparation and characterization of the micelles. (A) The preparation of S14@SC-CA-DA micelles. (B) Size distribution and TEM image of S14@SC-CA-DA micelles. (C) The preparation of S14@SC-DA micelles. (D) Size distribution and TEM image of S14@SC-DA micelles. (E) Relative hemolysis ratio of various concentrations of S14@SC-CA-DA micelles. (F) Absorption peaks of released S14 monitored by LC–MS/MS. (G) The release rates of S14 from S14@SC-CA-DA and S14@SC-DA micelles at different pH values. Data are mean ± SD (n = 3).
Figure 5
Figure 5
Kim-1–associated endocytosis of SC-CA-DA in vitro and in vivo. (A) Fluorescence microscopic assay of micelles uptake by normal or H2O2-stimulated HK-2 cells for 2 or 6 h. The data are the means ± SD (n = 3). ∗∗P < 0.01. ∗∗∗P < 0.001. ns, not significant. (B) Confocal microscopy images of Kim-1 (green) and Cy5-C-CA-DA or Cy5-SC-CA-DA (red) in HK-2 cells (scale bar = 20 μm). (C) Fluorescence microscopy images of Kim-1 (green) and Cy5-SC-CA-DA (red) on kidney sections from AKI-injured mice (scale bar = 50 μm).
Figure 6
Figure 6
Lysosome escape of S14@SC-CA-DA micelles. (A) Fluorescent images of HK-2 cells after incubating with DID or DID@SC-CA-DA, respectively, for 4, 6, and 8 h (scale bar = 10 μm). (B) Pearson correlation coefficients of DID and Lyso-Tracker green fluorescence intensity, The data are the means ± SD (n = 3). ∗∗P < 0.01. (C) The level of overlay of DID and Lyso-Tracker is green.
Figure 7
Figure 7
S14@SC-CA-DA reduced oxidative stress and apoptosis in vitro. (A) Fluorescence images of mitochondrial ROS detected by MitoSOX (scale bar = 20 μm. (B) Fluorescence images of JC-1 staining in HK-2 cells (scale bar = 20 μm). (C) WB analysis of caspase-3, cleaved caspase-3, caspase-9, cleaved caspase-9, Bax, and Bcl-2 proteins in HK-2 cells. (D) Flow cytometric analysis of HK-2 cells using apoptosis detection kit. (E) The MitoSOX mean fluorescence intensity of (A). (F) The mean ratio of fluorescence intensity of JC-1 aggregates and JC-1 monomers in (B). (G–J) Quantification of the protein immunoblots of cleaved caspase-3, cleaved caspase-9, Bax, and Bcl-2. (K) Apoptosis rate in various groups. Data are the means ± SD (n = 3). ∗P < 0.05, ∗∗P < 0.01 and ∗∗∗P < 0.001 as compared with H2O2 group. #P < 0.05, ##P < 0.01 and ###P < 0.001 between groups as indicated.
Figure 8
Figure 8
Efficacy of S14@SC-CA-DA in the alleviation of renal function in vivo. (A) Schematic diagram of the establishment and treatment of an AKI model in C57BL/6 mice. (B) The kidney fluorescence imaging of DID and DID@SC-CA-DA at 2, 6, 12, and 24 h. (C) Mean fluorescence intensity of kidney. Data are mean ± SD (n = 3). (D, E) Serum analysis of creatinine (D) and BUN (E) levels. Data are mean ± SD (n = 6). (F) H&E staining of kidney tissues (scale bar = 100 μm). Renal tubular vacuolization (green arrows). Red arrowheads donate renal tubular epithelial cell necrosis and sloughing, forming cellular debris or casts. ∗P < 0.05, ∗∗P < 0.01, ∗∗∗P < 0.001 and ∗∗∗∗P < 0.0001 as compared with saline. #P < 0.05, ##P < 0.01 and ###P < 0.001 between groups as indicated.
Figure 9
Figure 9
S14@SC-CA-DA protects mitochondria from damage and reduces oxidative stress, inflammation, and apoptosis in AKI mice. (A) Bio-TEM image of mitochondria of tubular cells (scale bar = 1 μm), Zoom out image (scale bar = 500 nm) is shown. Swollen mitochondrion with disturbed cristae structure (green arrowheads). The mitochondrial membrane ruptures and matrix material is released into the cytoplasm (red arrowheads). (B) TUNEL staining (scale bar = 50 μm). (C) WB analysis of caspase-3, cleaved caspase-3, Caspase-9, cleaved caspase-9, Bax, and Bcl-2 proteins in kidney tissue. (D) Quantification of TUNEL-positive cells in (B). (E–H) Quantification of the protein immunoblots of cleaved caspase-3, cleaved caspase-9, Bax, and Bcl-2. Data are mean ± SD (n = 3). (I–K) MDA, TNF-α, and IL-6 level changes in AKI mice after different treatments. Data are mean ± SD (n = 5). ∗P < 0.05, ∗∗P < 0.01, ∗∗∗P < 0.001 and ∗∗∗∗P < 0.0001 as compared with saline. #P < 0.05 and ##P < 0.01 between groups as indicated.
Figure 10
Figure 10
Pharmacokinetics, tissue distribution, metabolism, and safety evaluation of S14@SC-CA-DA. (A) CYP and UGT contribution of S14 in human liver microsome. (B) The reaction formula generates S14-glucuronide. (C) Mean plasma concentration vs. time profiles of S14 and S14@SC-CA-DA. (D) S14-glucuronide of S14 and S14@SC-CA-DA in plasma. (E) tissue distribution profile. (F) S14-glucuronide of S14 and S14@SC-CA-DA in tissue. (G) Kinetics of S14-glucuronide in human liver microsome (HLM) and human kidney microsome (HKM) at different concentrations. Data are mean ± SD (n = 3). (H) Elimination rate of S14 in human liver microsome (HLM) and human kidney microsome (HKM). (I) H&E staining of major organs after treatment (scale bar = 100 μm). Data are mean ± SD (n = 5). ∗P < 0.05 and ∗∗P < 0.01.
Figure 11
Figure 11
Schematic illustration of S14@SC-CA-DA for alleviating AKI. After intravenous administration, S14@SC-CA-DA travels through the bloodstream to the injured kidney. Overexpression of Kim-1 in injured renal tubular cells enhances the internalization of S14@SC-CA-DA. In the acidic microenvironment of the AKI kidney, S14@SC-CA-DA pH-dependent releases S14, S14 targets PRDX1 and regulates PRDX1/Nrf2 to reduce ROS levels, promotes the restoration of mitochondrial homeostasis and improves pharmacokinetics behavior of S14, thereby ameliorates AKI.

References

    1. Bellomo R., Kellum J.A., Ronco C. Acute kidney injury. Lancet. 2012;380:756–766. - PubMed
    1. Poston J.T., Koyner J.L. Sepsis associated acute kidney injury. BMJ. 2019;364:k4891–k4908. - PMC - PubMed
    1. Gerhardt L.M.S., Liu J., Koppitch K., Cippà P.E., McMahon A.P. Single-nuclear transcriptomics reveals diversity of proximal tubule cell states in a dynamic response to acute kidney injury. Proc Natl Acad Sci U S A. 2021;118 - PMC - PubMed
    1. Linkermann A., Chen G., Dong G., Kunzendorf U., Krautwald S., Dong Z. Regulated cell death in AKI. J Am Soc Nephrol. 2014;25:2689–2701. - PMC - PubMed
    1. Agarwal A., Dong Z., Harris R., Murray P., Parikh S.M., Rosner M.H., et al. Cellular and molecular mechanisms of AKI. J Am Soc Nephrol. 2016;27:1288–1299. - PMC - PubMed

LinkOut - more resources