. 2024 Jun 3;15(28):10867-10881.
doi: 10.1039/d4sc02513j. eCollection 2024 Jul 17.

Photophysics and photochemistry of thermally activated delayed fluorescence emitters based on the multiple resonance effect: transient optical and electron paramagnetic resonance studies

Affiliations

Photophysics and photochemistry of thermally activated delayed fluorescence emitters based on the multiple resonance effect: transient optical and electron paramagnetic resonance studies

Xi Chen et al. Chem Sci. .

Abstract

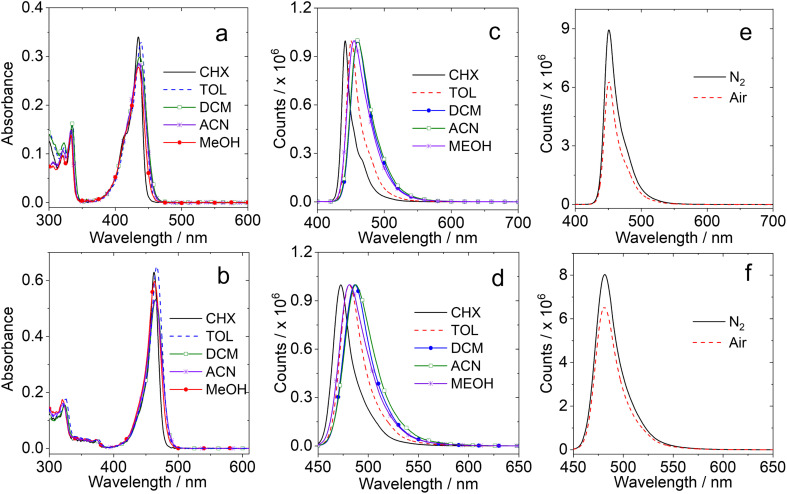
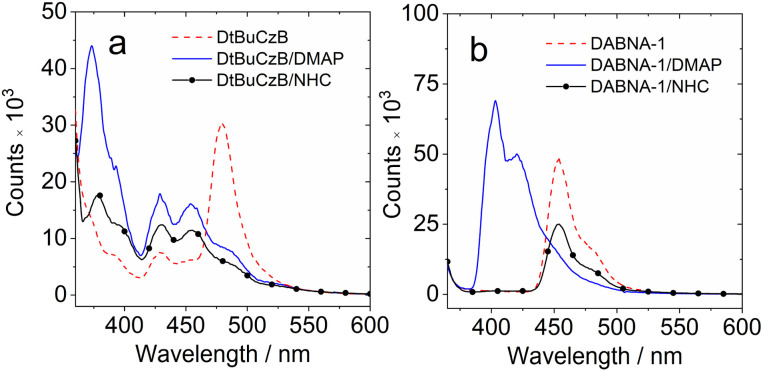
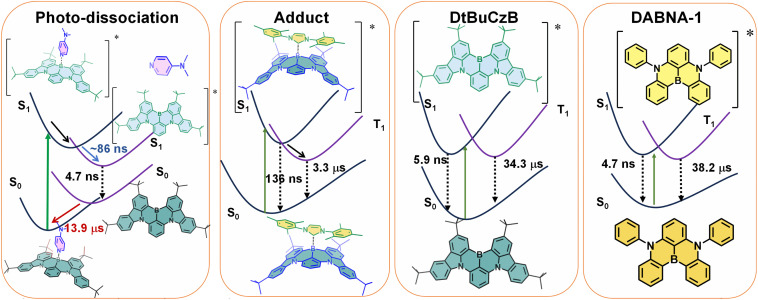
The photochemistry of two representative thermally activated delayed fluorescence (TADF) emitters based on the multiple resonance effect (MRE) (DABNA-1 and DtBuCzB) was studied. No significant TADF was observed in fluid solution, although the compounds have a long-lived triplet state (ca. 30 μs). We found that these planar boron molecules bind with Lewis bases, e.g., 4-dimethylaminopyridine (DMAP) or an N-heterocyclic carbene (NHC). A new blue-shifted absorption band centered at 368 nm was observed for DtBuCzB upon formation of the adduct; however, the fluorescence of the adduct is the same as that of the free DtBuCzB. We propose that photo-dissociation occurs for the DtBuCzB-DMAP adduct, which is confirmed by femtosecond transient absorption spectra, implying that fluorescence originates from DtBuCzB produced by photo-dissociation; the subsequent in situ re-binding was observed with nanosecdon transient absorption spectroscopy. No photo-dissociation was observed for the NHC adduct. Time-resolved electron paramagnetic resonance (TREPR) spectra show that the triplet states of DABNA-1 and DtBuCzB have similar zero field splitting (ZFS) parameters (D = 1450 MHz). Theoretical studies show that the slow ISC is due to small SOC and weak Herzberg-Teller coupling, although the S1/T1 energy gap is small (0.14 eV), which rationalizes the lack of TADF.


Conflict of interest statement

There are no conflicts to declare.

Figures

Scheme 1
Scheme 1. Molecular structures of the MRE emitters DtBuCzB, DABNA-1, CzB-H, and DABNA-H used in calculations. The molecular structures of the Lewis bases DMAP and NHC used in the study are also presented.
Fig. 1
Fig. 1. UV-vis absorption spectra of (a) DABNA-1 and (b) DtBuCzB in cyclohexane (CHX), toluene (TOL), dichloromethane (DCM), acetonitrile (ACN), and methanol (MeOH), c = 1.0 × 10⁻⁵ M. Normalized fluorescence spectra of (c) DABNA-1 (λex = 335 nm) and (d) DtBuCzB, (λex = 440 nm) in different solvents, and (e) DABNA-1 and (f) DtBuCzB in toluene in different atmospheres. Optically matched solutions were used, A ≈ 0.10.
Fig. 2
Fig. 2. (a) Evolution of the UV-vis absorption spectra of DtBuCzB with an incremental amount of DMAP added. (b) The titration isotherms of DABNA-1 (monitored at 439 nm) and DtBuCzB (monitored at 467 nm). The solid lines are the fitting for the binding constants of DABNA-1 or DtBuCzB toward DMAP. (c) Fluorescence spectra of DtBuCzB with an incremental amount of DMAP added. (d) UV-vis absorption spectra of DtBuCzB with an incremental amount of NHC added. (e) Fluorescence spectra of DtBuCzB with different concentrations of NHC in toluene, λex = 333 nm (isosbestic point of the UV-vis absorption spectra). (f) The digital photographs of the solution of DtBuCzB upon addition of NHC (40 eq.) under dim light and UV light (365 nm) illumination, respectively. c = 1.0 × 10⁻⁵ M, 20 °C.
Fig. 3
Fig. 3. Fluorescence decay traces of (a) DtBuCzB (480 nm); (b) DtBuCzB with DMAP (481 nm); (c) DtBuCzB with NHC (388 nm); (d) DABNA-1 (450 nm); (e) DABNA-1 with DMAP (450 nm); (f) DABNA-1 with NHC (450 nm) in different atmospheres in toluene. Excited with a picosecond pulsed laser, λex = 340 nm, c = 1.0 × 10⁻⁵ M, 20 °C.
Fig. 4
Fig. 4. Luminescence spectra of the compounds and the adducts in a frozen solution of (a) DtBuCzB alone, and in the presence of DMAP (50 eq.) or NHC (50 eq.) and (b) DABNA-1 alone and in the presence of DMAP (50 eq.) and NHC (50 eq.) in 2-methyltetrahydrofuran at 77 K. Excited with a picosecond pulsed laser (λex = 340 nm), c = 1.0 × 10⁻⁴ M.
Fig. 5
Fig. 5. Fs-TA spectra recorded in toluene for (a) DABNA-1 excited at 400 nm and (b) DtBuCzB excited at 340 nm. Panels (c) and (d) present the EADS obtained from global analysis of the transient absorption data.
Fig. 6
Fig. 6. (a) Fs-TA spectra of the DtBuCzB-DMAP (50 eq.) adduct recorded in toluene upon excitation at 370 nm. (b) The EADS obtained from global analysis of the transient absorption data.
Fig. 7
Fig. 7. Ns-TA spectra in DCM of (a) DtBuCzB and (c) DABNA-1. Decay traces of (b) DtBuCzB at 750 nm; (d) DABNA-1 at 650 nm. Excited at 440 nm and 420 nm, respectively. c = 2.0 × 10⁻⁵ M, 20 °C.
Fig. 8
Fig. 8. Ns-TA spectra in toluene of DtBuCzB with 4-N,N-dimethylaminopyridine (DMAP. 50 eq.) added. (a) Recorded in the long delay time range of 0–78.6 μs and (c) in the short delay time range of 0–309 ns. Decay traces at 470 nm of DtBuCzB in the presence of DMAP (50 eq.) in toluene: (b) long delay time range and (d) short delay time range. c [DtBuCzB] = 2.0 × 10⁻⁵ M, λex = 355 nm, 20 °C.
Fig. 9
Fig. 9. Experimental and simulation TREPR spectra of (a) DABNA-1, (b) DtBuCzB in toluene/2-MeTHF (1 : 1), (c) DABNA-1 + 50 eq. DMAP, and (d) DtBuCzB + 50 eq. DMAP. At 80 K. c [DABNA-1] = 5.0 × 10⁻⁴ M, c [DtBuCzB] = 5.0 × 10⁻⁴ M, the laser energy is 1 mJ per pulse at 355 nm. The delay after laser flash (DAF) is 300 ns.
Fig. 10
Fig. 10. The optimized T1 state geometry of (a) DABNA-1 and (b) CzB-H, and the electron spin-density surfaces of the T1 state of DABNA-1 (c) and CzB-H (d). Calculations with the UB3LYP/def2-SVP method.
Fig. 11
Fig. 11. ISC (black curve) and rISC (blue curve) rate constants of DABNA-H calculated with CIS/def2-SVP wavefunctions for the optimized geometries of S1 and T1, as a function of the energy gap. The dashed line is the Franck–Condon contribution, and the solid line includes Herzberg–Teller coupling. The vertical line marks an experimental energy gap of 1200 cm−1.
Scheme 2
Scheme 2. Simplified Jablonski diagram illustrating the photophysical processes involved in DtBuCzB-DMAP, DtBuCzB-NHC, DtBuCzB and DABNA-1 upon photoexcitation.

References

    1. Verhoeven J. W. J. Photochem. Photobiol., C. 2006;7:40–60. doi: 10.1016/j.jphotochemrev.2006.04.001. - DOI
    1. Fukuzumi S. Pure Appl. Chem. 2007;79:981–991. doi: 10.1351/pac200779060981. - DOI
    1. Devižis A. De Jonghe-Risse J. Hany R. Nüesch F. Jenatsch S. Gulbinas V. Moser J.-E. J. Am. Chem. Soc. 2015;137:8192–8198. doi: 10.1021/jacs.5b03682. - DOI - PubMed
    1. Bartynski A. N. Gruber M. Das S. Rangan S. Mollinger S. Trinh C. Bradforth S. E. Vandewal K. Salleo A. Bartynski R. A. Bruetting W. Thompson M. E. J. Am. Chem. Soc. 2015;137:5397–5405. doi: 10.1021/jacs.5b00146. - DOI - PubMed
    1. Xu Y. Zheng J. Lindner J. O. Wen X. Jiang N. Hu Z. Liu L. Huang F. Würthner F. Xie Z. Angew. Chem., Int. Ed. 2020;59:10363–10367. doi: 10.1002/anie.202001231. - DOI - PMC - PubMed

LinkOut - more resources