

GIS-based spatio-temporal analysis of rainfall trends under climate change in different agro-ecological zones of Wolaita zone, south Ethiopia
- PMID: 39027508
- PMCID: PMC467070
- DOI: 10.1016/j.heliyon.2024.e33235
GIS-based spatio-temporal analysis of rainfall trends under climate change in different agro-ecological zones of Wolaita zone, south Ethiopia
Abstract
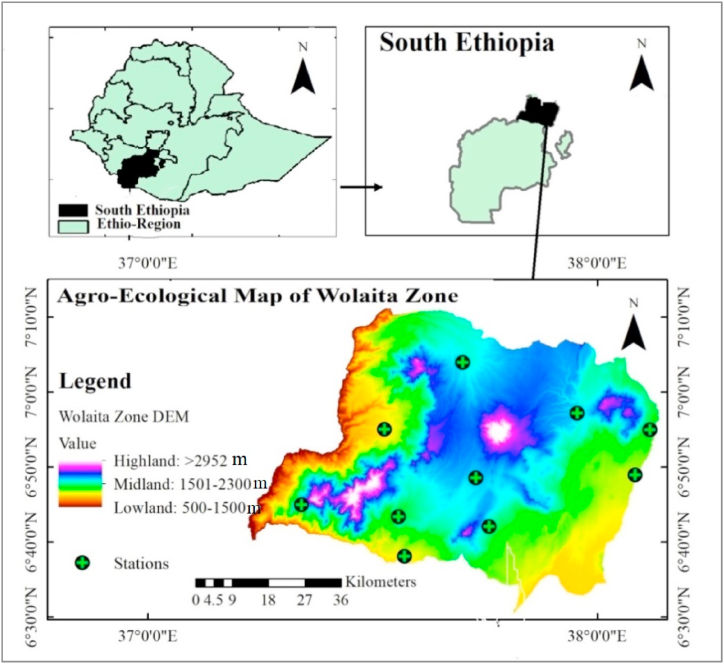
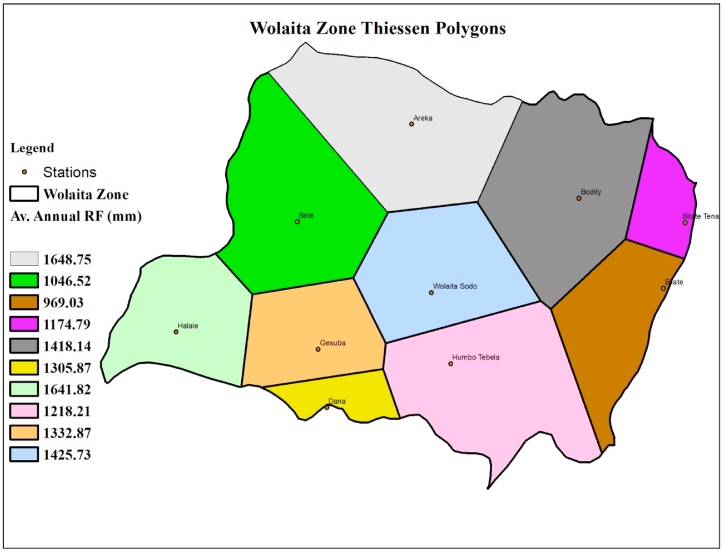
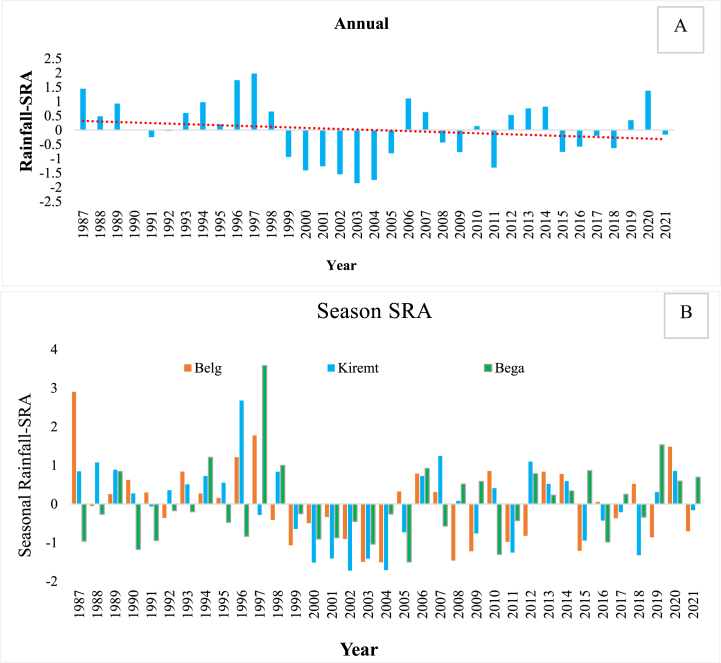
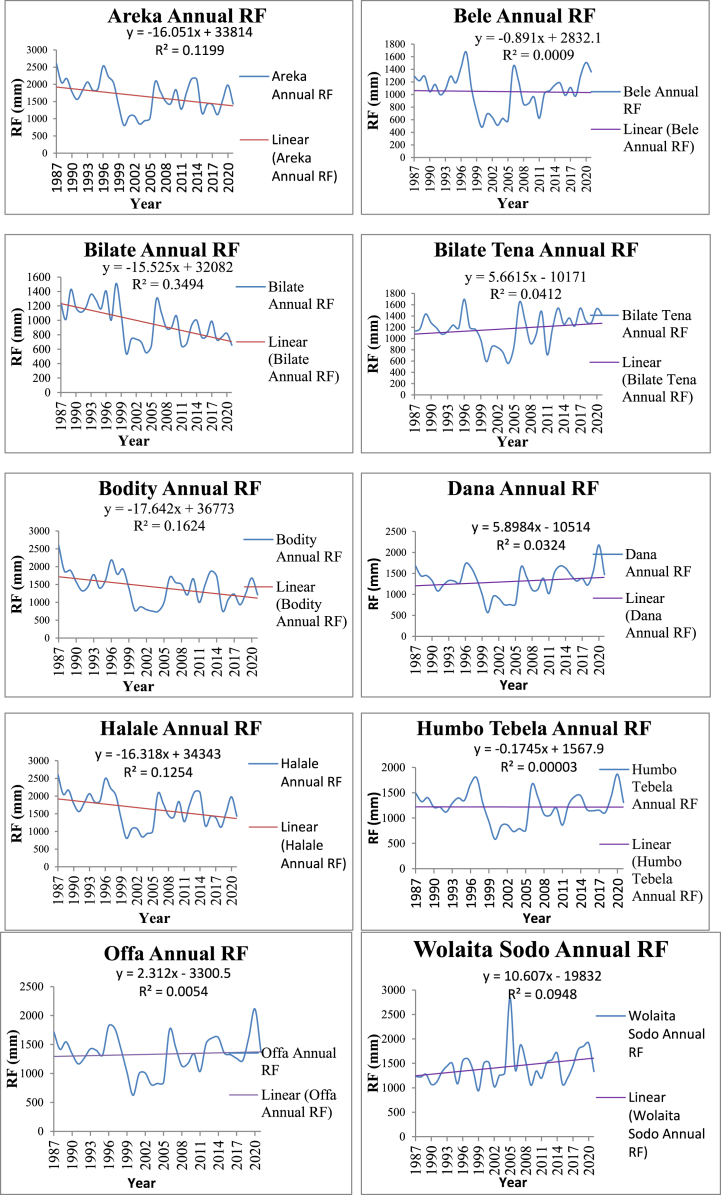
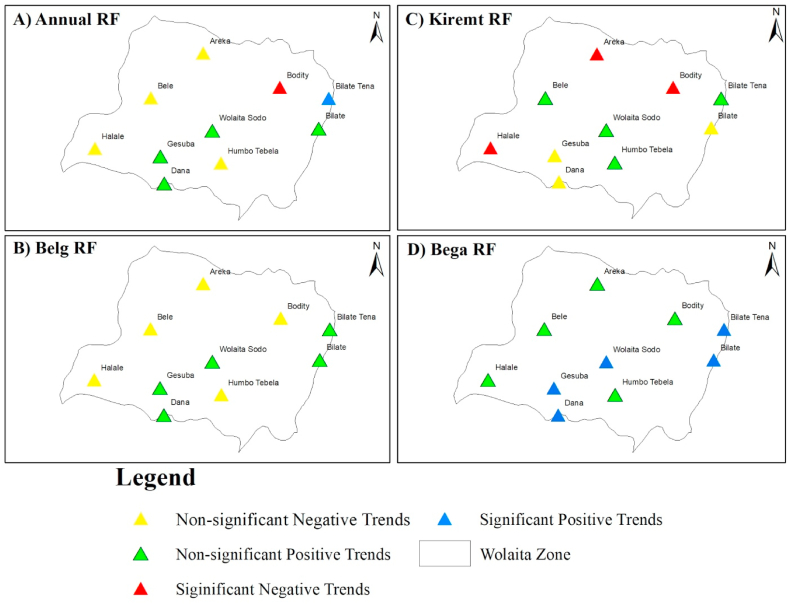
Understanding the spatiotemporal dynamics of climatic conditions within a region is paramount for informed rural planning and decision-making processes, particularly in light of the prevailing challenges posed by climate change and variability. This study undertook an assessment of the spatial and temporal patterns of rainfall trends across various agro-ecological zones (AEZs) within Wolaita, utilizing data collected from ten strategically positioned rain gauge stations. The detection of trends and their magnitudes was facilitated through the application of the Mann-Kendall (MKs) test in conjunction with Sen's slope estimator. Spatial variability and temporal trends of rainfall were further analyzed utilizing ArcGIS10.8 environment and XLSTAT with R programming tools. The outcomes derived from ordinary kriging analyses unveiled notable disparities in the coefficient of variability (CV) for mean annual rainfall across distinct AEZs. Specifically, observations indicated that lowland regions exhibit relatively warmer climates and lower precipitation levels compared to their highland counterparts. Within the lowland AEZs, the majority of stations showcased statistically non-significant positive trends (p > 0.05) in annual rainfall, whereas approximately two-thirds of midland AEZ stations depicted statistically non-significant negative trends. Conversely, over half of the stations situated within highland AEZs displayed statistically non-significant positive trends in annual rainfall. During the rainy season, highland AEZs experienced higher precipitation levels, while the south-central midland areas received a moderate amount of rainfall. In contrast, the northeast and southeast lowland AEZs consistently received diminished rainfall across all seasons compared to other regions. This study underscores the necessity for the climate resilient development and implementation of spatiotemporally informed interventions through implementing region-specific adaptation strategies, such as water conservation measures and crop diversification, to mitigate the potential impact of changing rainfall patterns on agricultural productivity in Wolaita.
Keywords: Agro-ecology; Kriging-interpolation; Mann-kendall; Rainfall; Sen's slope; Spatiotemporal analysis; Wolaita zone.
© 2024 The Authors.
Conflict of interest statement
The authors declare that they have no known competing financial interests or personal relationships that could have appeared to influence the work reported in this paper.
Figures


References
-
- Zachariah M., Kotroni V., Kostas L., Barnes C., Kimutai J., Kew S.…Otto F. Interplay of climate change-exacerbated rainfall, exposure and vulnerability led to widespread impacts in the Mediterranean region. 2023. https://climateattribution.org/resources/interplay-of-climate-change-exa...
-
- Cao Z., Wang S., Luo P., Xie D., Zhu W. Watershed ecohydrological processes in a changing environment: opportunities and challenges. Water. 2022;14(9):1502. doi: 10.3390/w14091502. - DOI
-
- Sun G., Hallema D., Asbjornsen H. Ecohydrological processes and ecosystem services in the Anthropocene: a review. Ecological Processes. 2017;6(1):1–9. doi: 10.1186/s13717-017-0104-6. - DOI
-
- Etana D., Snelder D.J., van Wesenbeeck C.F., de Cock Buning, T. Trends of climate change and variability in three agro-ecological settings in central Ethiopia: contrasts of meteorological data and farmers' perceptions. Climate. 2020;8(11):121. doi: 10.3390/cli8110121. - DOI
LinkOut - more resources
Full Text Sources
