. 2024 Aug 6;13(15):e031515.
doi: 10.1161/JAHA.123.031515. Epub 2024 Jul 19.

Effect of Intramyocardial Administration of Baculovirus Encoding the Transcription Factor Tbx20 in Sheep With Experimental Acute Myocardial Infarction

Affiliations

Effect of Intramyocardial Administration of Baculovirus Encoding the Transcription Factor Tbx20 in Sheep With Experimental Acute Myocardial Infarction

María del Rosario Bauzá et al. J Am Heart Assoc. .

Abstract

Background: Gene therapy has been proposed as a strategy to induce cardiac regeneration following acute myocardial infarction (AMI). Given that Tbx20, a transcription factor of the T-box subfamily, stimulates cell proliferation and angiogenesis, we designed a baculovirus overexpressing Tbx20 (Bv-Tbx20) and evaluated its effects in cultured cardiomyocytes and in an ovine model of AMI.

Methods and results: Cell proliferation and angiogenesis were measured in cardiomyocytes transduced with Bv-Tbx20 or Bv-Null (control). Subsequently, in sheep with AMI, Bv-Tbx20 or Bv-Null was injected in the infarct border. Cardiomyocyte cell cycle activity, angioarteriogenesis, left ventricular function, and infarct size were assessed. Cardiomyocytes transduced with BvTbx20 increased cell proliferation, cell cycle regulatory and angiogenic gene expression, and tubulogenesis. At 7 days posttreatment, sheep treated with Bv-Tbx20 showed increased Tbx20, promitotic and angiogenic gene expression, decreased levels of P21, increased Ki67- (17.09±5.73 versus 7.77±7.24 cardiomyocytes/mm2, P<0.05) and PHH3 (phospho-histone H3)-labeled cardiomyocytes (10.10±3.51 versus 5.23±2.87 cardiomyocytes/mm2, P<0.05), and increased capillary (2302.68±353.58 versus 1694.52±211.36 capillaries/mm2, P<0.001) and arteriolar (146.95±53.14 versus 84.06±16.84 arterioles/mm2, P<0.05) densities. At 30 days, Bv-Tbx20 decreased infarct size (9.89±1.92% versus 12.62±1.33%, P<0.05) and slightly improved left ventricular function. Baculoviral gene transfer-mediated Tbx20 overexpression exerted angiogenic and cardiomyogenic effects in vitro.

Conclusions: In sheep with AMI, Bv-Tbx20 induced angioarteriogenesis, cardiomyocyte cell cycle activity, infarct size limitation, and a slight recovery of left ventricular function, suggesting that Bv-Tbx20 gene therapy may contribute to cardiac regeneration following AMI.

Keywords: Tbx20; acute myocardial infarction; baculovirus; gene therapy; sheep.


Figures
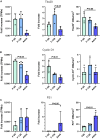
Figure 1
Figure 1. Endogenous expression of Tbx20, Cyclin D1, and P21 at different proliferative stages in ovine hearts measured by RNA‐seq, RT‐qPCR, and immunohistochemistry.
RNA‐seq quantified as normalized transcripts per million with Gapdh mRNA level (TPMn, left), RT‐qPCR quantified as relative mRNA expression (middle), and immunohistochemistry quantified as positive cardiomyocytes per mm2 (right) of Tbx20 (A), Cyclin D1 (B), and P21 (C). Groups were compared by Kruskal–Wallis test and the post hoc Dunn's multiple comparisons test (n=3 for transcriptome and n=4 for RT‐qPCR and immunohistochemistry). Individual data are shown as dots, and group data are expressed as mean±SD. Adult indicates adult heart; CMs, cardiomyocytes; F‐90, fetal heart of 90 days; F‐120: fetal heart of 120 days; RNA‐seq, RNA sequencing; and RT‐qPCR indicates reverse transcription‐quantitative polymerase chain reaction.
Figure 2
Figure 2. Cell proliferation and endogenous expression profile of Tbx20, Cyclin D1, and P21 at 3, 5, and 8 days of cardiomyocyte culture.
A, Cell proliferation measured by MTS assay. Expression levels of Tbx20 (B), Cyclin D1 (C), and P21 (D) measured by RT‐qPCR (relative mRNA fold increase) and immunocytochemistry (percentage of positive cardiomyocytes). Groups were compared by Kruskal–Wallis test and the post hoc Dunn's multiple comparisons test (n=6, independent assays per time). Individual data are shown as dots, and group data are expressed as mean±SD. CMs indicates cardiomyocytes; MTS, 4,5‐dimethylthiazol‐2‐yl2H‐tetrazolium; and RT‐qPCR indicates reverse transcription‐quantitative polymerase chain reaction.
Figure 3
Figure 3. Cell proliferation and Tbx20 expression in cardiomyocytes at 2 and 5 days posttransduction.
A, Cell proliferation measured by MTS assay. (B), Relative mRNA expression of the human Tbx20 transgene measured by RT‐qPCR. (C), Tbx20 protein expression measured by immunocytochemistry. Mann–Whitney test (n=4 independent assays per group). Individual data are shown as dots, and group data are expressed as mean±SD. CM‐BvNull indicates cardiomyocytes transduced with baculovirus devoid of inserts; CM‐BvTbx20, cardiomyocytes transduced with baculovirus overexpressing Tbx20; CM‐Control, cardiomyocytes incubated with PBS; MTS, 4,5‐dimethylthiazol‐2‐yl2H‐tetrazolium; and RT‐qPCR indicates reverse transcription‐quantitative polymerase chain reaction.
Figure 4
Figure 4. Cycling cardiomyocytes and in vitro angiogenic induction at 2 and 5 days posttransduction.
Percentage of cardiomyocytes positive for Ki67 (A), phospho‐histone H3 (B), and aurora kinase B (C) measured by immunocytochemistry, and representative images of cardiomyocytes immunostained at 2 days posttransduction; bars=20 μm. (D), Crown formation per mm2 and representative images, measured by tubulogenesis assay in incubated HMEC1 with supernatants of both groups at 2 days posttransduction; bars=1 mm. Mann–Whitney test (n=4 for immunocytochemistry and n=6 for tubulogenesis, independent assays). Individual data are shown as dots, and group data are expressed as mean±SD. AKB indicates aurora kinase B; CM‐BvNull, cardiomyocytes transduced with baculovirus devoid of inserts; CM‐BvTbx20, cardiomyocytes transduced with baculovirus overexpressing Tbx20; HMEC1, human microvascular endothelial cell line 1; and PHH3, phospho‐histone H3.
Figure 5
Figure 5. Infarct size and left ventricular function.
A, Infarct size measured as percentage of left ventricular infarcted area, and representative images of infarcted left ventricles for each group are shown at 30 days post‐AMI. Bars=2 cm. (B), Percentage of ejection fraction (%EF) and circumferential shortening fraction (%CSF) measured by echocardiography at baseline, 3, 15, and 30 days post‐AMI in both groups. Groups were compared by Student's t test or 2‐way ANOVA‐Bonferroni (n=6 per group). # P<0.05 vs Null group at 15 days post‐AMI, ***P<0.005, **P<0.01, and *P<0.05 vs baseline in each group. Data are expressed as mean±SD. AMI indicates acute myocardial infarction.
Figure 6
Figure 6. Microvascular density and cycling cardiomyocytes at 7 days post‐AMI in peri‐infarct tissues of sheep treated with Bv‐Tbx20 or Bv‐Null.
Capillary (A) and arteriolar (B) densities and representative images showing capillaries (stained with a biotinylated lectin) and arterioles (stained with an antibody against smooth muscle actin); bars=50 μm. Ki67‐ (C) and phospho‐histone H3– (D) positive cardiomyocyte densities and representative images of both groups showing Ki67‐positive or PHH3‐positive nuclei (brown) and sarcomeric actin‐positive cytoplasm (violet), bars=100 μm. Boxes indicate cycling nuclei in adult cardiomyocytes, magnified in the inset (bar=20 μm). Groups were compared by Mann–Whitney test (n=6 per group). Individual data are shown as dots, and group data are expressed as mean±SD. AMI indicates acute myocardial infarction; Bv‐Tbx20, baculovirus overexpressing Tbx20; CMs, cardiomyocytes; and PHH3, phospho‐histone H3.

References

    1. Chareonthaitawee P, Christian TF, Hirose K, Gibbons RJ, Rumberger JA. Relation of initial infarct size to extent of left ventricular remodeling in the year after acute myocardial infarction. J Am Coll Cardiol. 1995;25:567–573. doi: 10.1016/0735-1097(94)00431-O - DOI - PubMed
    1. Brooks G, Poolman RA, Li JM. Arresting developments in the cardiac myocyte cell cycle: role of cyclin‐dependent kinase inhibitors. Cardiovasc Res. 1998;39:301–311. doi: 10.1016/S0008-6363(98)00125-4 - DOI - PubMed
    1. López AE, Bauzá MDR, Cuniberti L, Crottogini AJ, Olea FD, Locatelli P. Gene therapy: targeting cardiomyocyte proliferation to repopulate the ischemic heart. J Cardiovasc Pharmacol. 2021;78:346–360. doi: 10.1097/FJC.0000000000001072 - DOI - PubMed
    1. Woo YJ, Panlilio CM, Cheng RK, Liao GP, Atluri P, Hsu VM, Cohen JE, Chaudhry HW. Therapeutic delivery of cyclin A2 induces myocardial regeneration and enhances cardiac function in ischemic heart failure. Circulation. 2006;114:I206–I213. doi: 10.1161/CIRCULATIONAHA.105.000455 - DOI - PubMed
    1. Stennard FA, Costa MW, Elliott DA, Rankin S, Haast SJ, Lai D, McDonald LP, Niederreither K, Dolle P, Bruneau BG, et al. Cardiac T‐box factor Tbx20 directly interacts with Nkx2‐5, GATA4, and GATA5 in regulation of gene expression in the developing heart. Dev Biol. 2004;262:206–224. doi: 10.1016/S0012-1606(03)00385-3 - DOI - PubMed

MeSH terms

Substances

LinkOut - more resources