. 2024 Jan-Dec;16(1):2379560.
doi: 10.1080/19420862.2024.2379560. Epub 2024 Jul 19.

Modulation of the high concentration viscosity of IgG1 antibodies using clinically validated Fc mutations

Affiliations

Modulation of the high concentration viscosity of IgG1 antibodies using clinically validated Fc mutations

Joel Heisler et al. MAbs. 2024 Jan-Dec.

Abstract

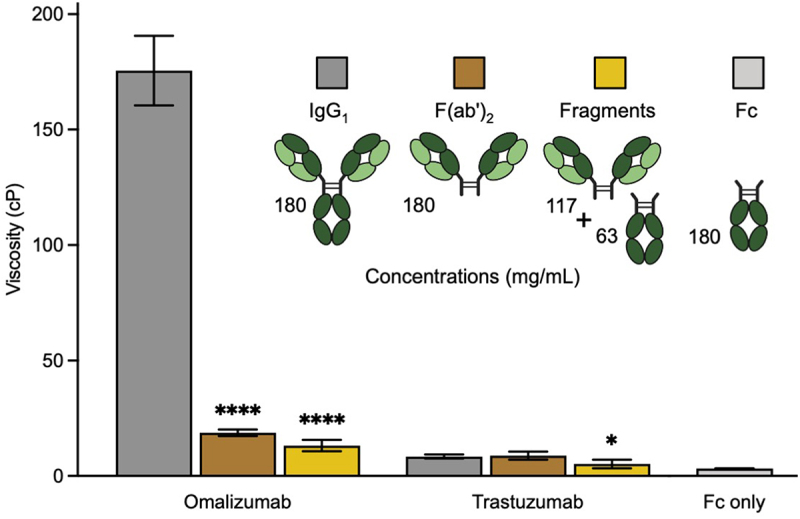
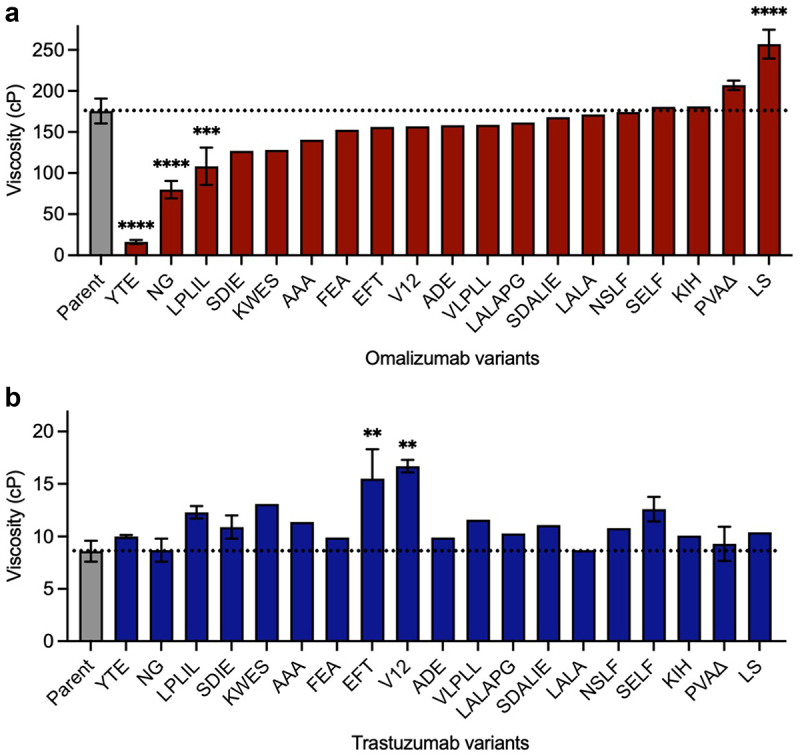
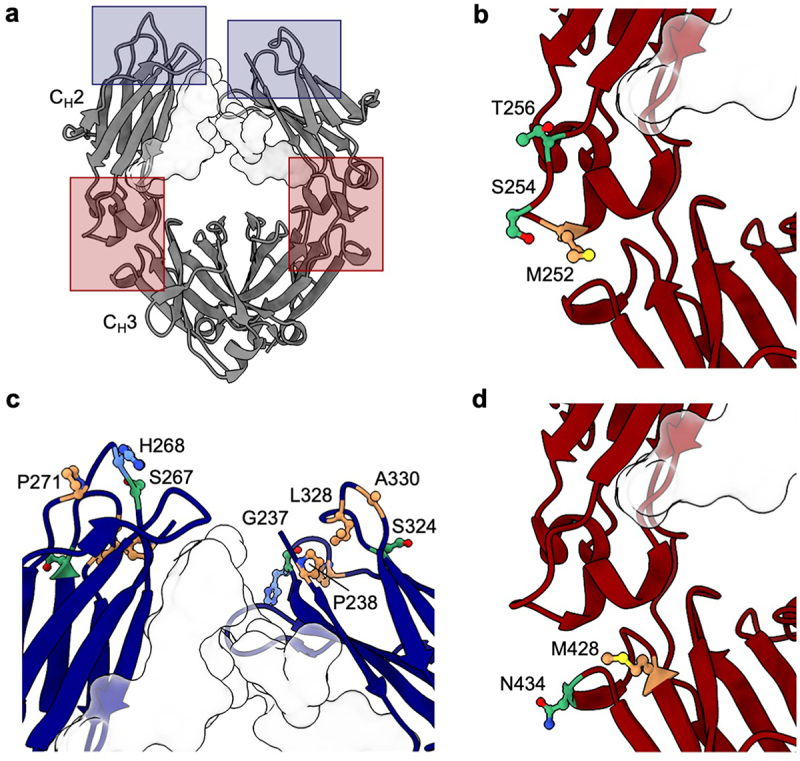
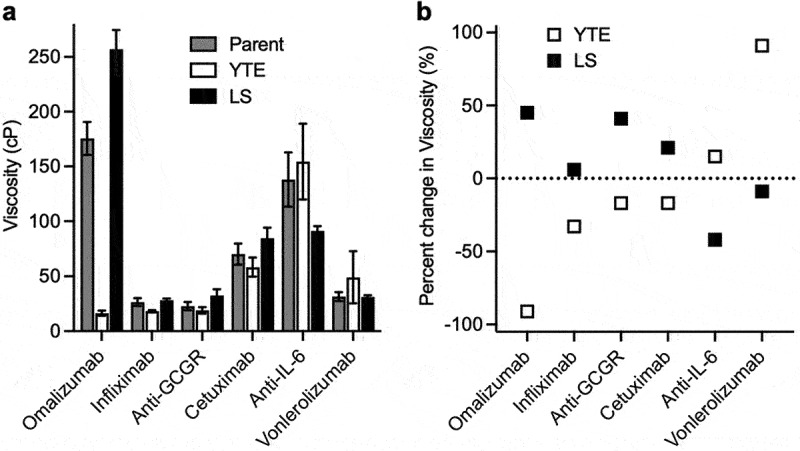
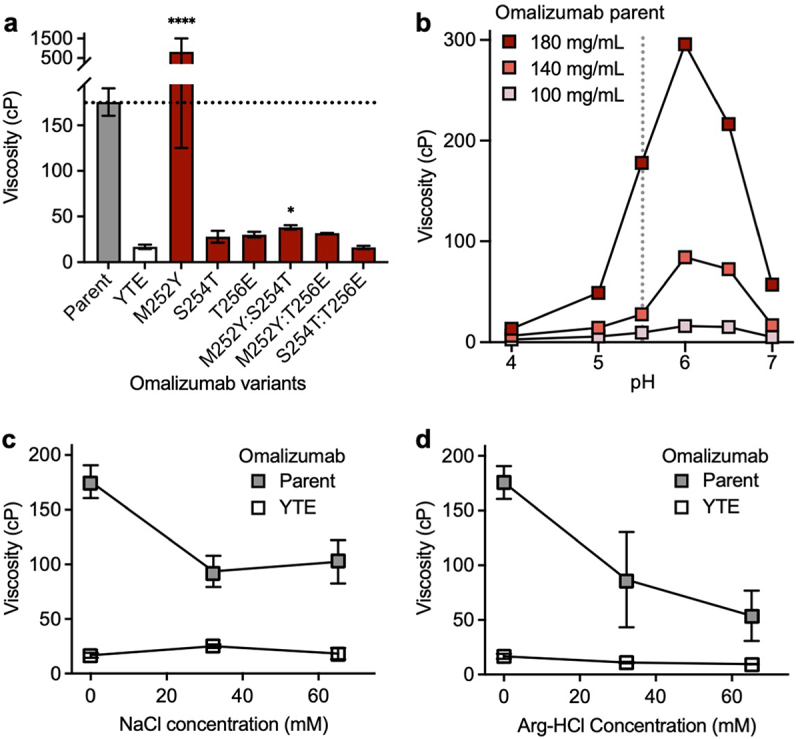
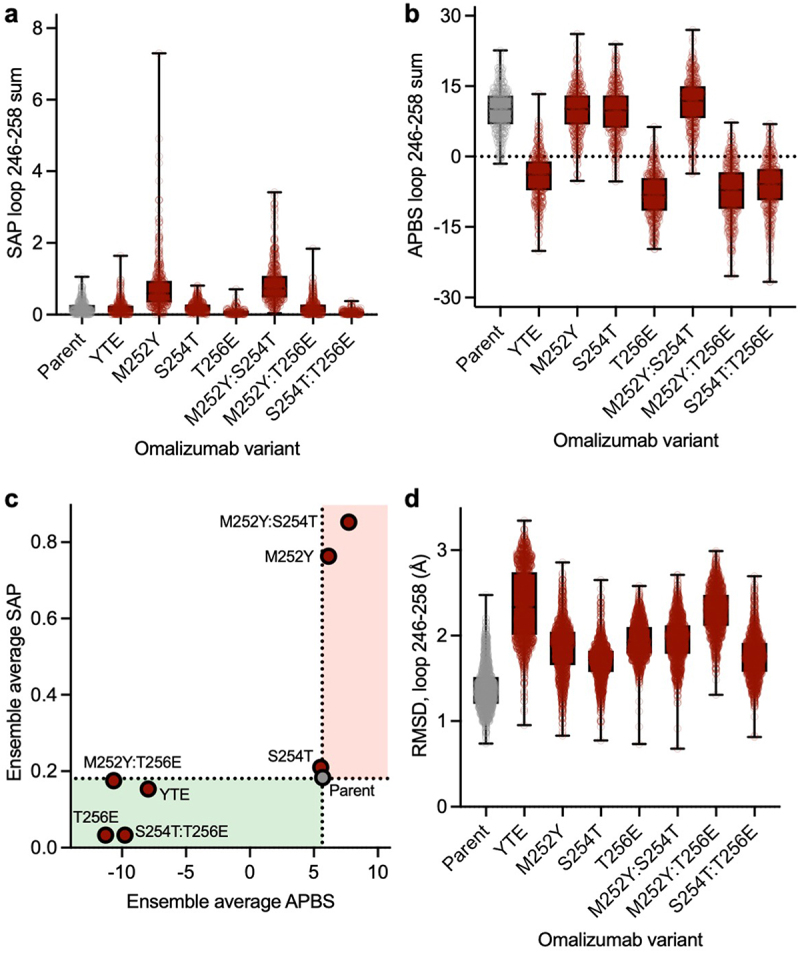
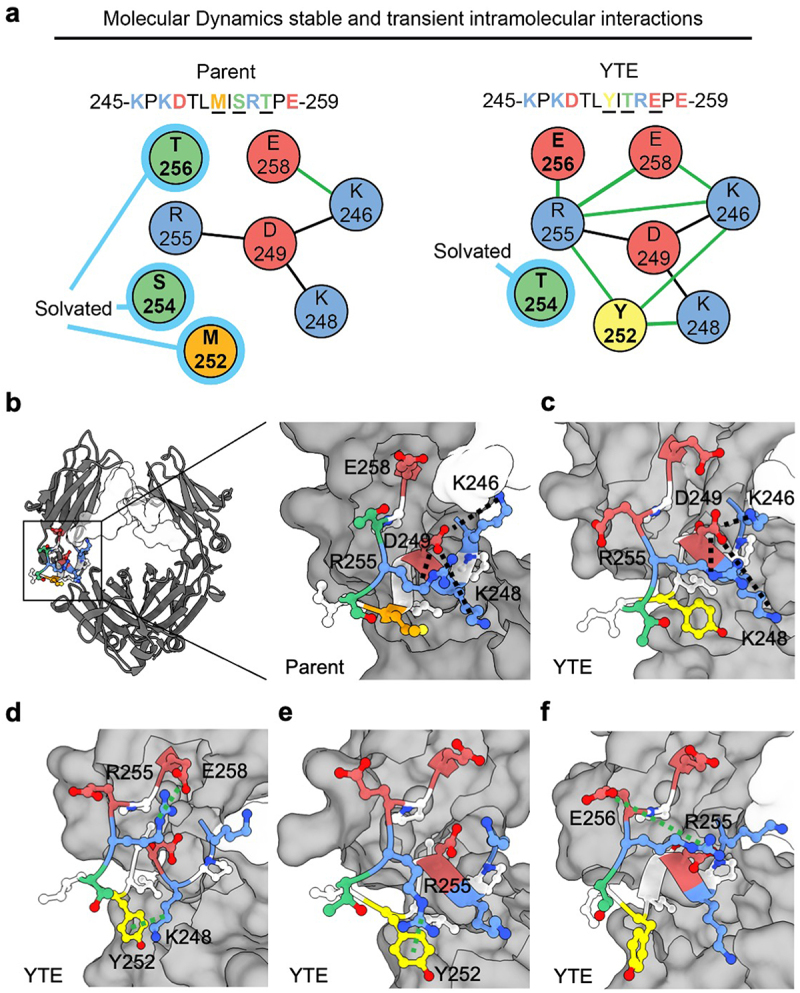
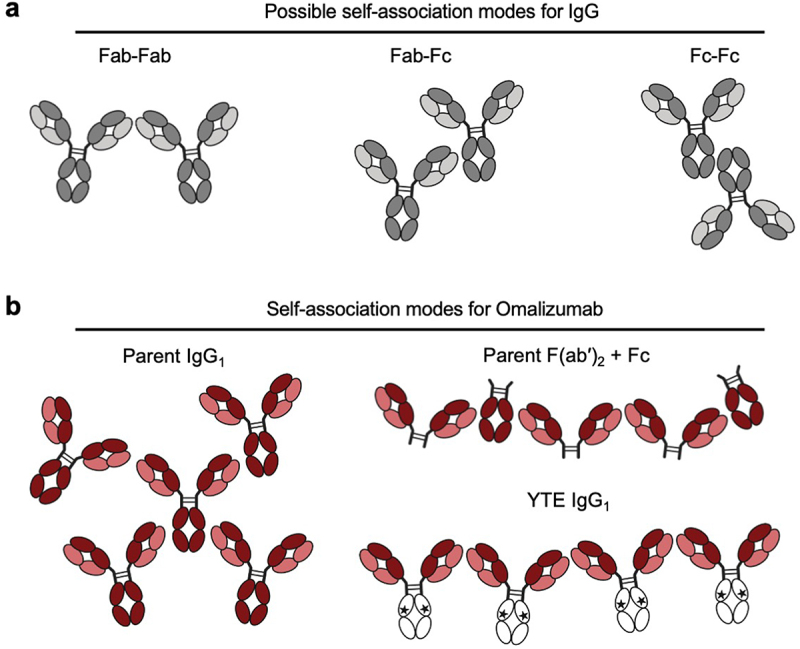
The self-association of therapeutic antibodies can result in elevated viscosity and create problems in manufacturing and formulation, as well as limit delivery by subcutaneous injection. The high concentration viscosity of some antibodies has been reduced by variable domain mutations or by the addition of formulation excipients. In contrast, the impact of Fc mutations on antibody viscosity has been minimally explored. Here, we studied the effect of a panel of common and clinically validated Fc mutations on the viscosity of two closely related humanized IgG1, κ antibodies, omalizumab (anti-IgE) and trastuzumab (anti-HER2). Data presented here suggest that both Fab-Fab and Fab-Fc interactions contribute to the high viscosity of omalizumab, in a four-contact model of self-association. Most strikingly, the high viscosity of omalizumab (176 cP) was reduced 10.7- and 2.2-fold by Fc modifications for half-life extension (M252Y:S254T:T256E) and aglycosylation (N297G), respectively. Related single mutations (S254T and T256E) each reduced the viscosity of omalizumab by ~6-fold. An alternative half-life extension Fc mutant (M428L:N434S) had the opposite effect in increasing the viscosity of omalizumab by 1.5-fold. The low viscosity of trastuzumab (8.6 cP) was unchanged or increased by 2-fold by the different Fc variants. Molecular dynamics simulations provided mechanistic insight into the impact of Fc mutations in modulating electrostatic and hydrophobic surface properties as well as conformational stability of the Fc. This study demonstrates that high viscosity of some IgG1 antibodies can be mitigated by Fc mutations, and thereby offers an additional tool to help design future antibody therapeutics potentially suitable for subcutaneous delivery.

Keywords: Intermolecular interactions; intramolecular interactions; molecular dynamics; rheology; self-association; subcutaneous delivery; viscosity.


Conflict of interest statement

All authors are current employees of Genentech, Inc., which develops and commercializes therapeutics including antibodies.

Figures

Figure 1.
Figure 1.
Contribution of Fab arms and Fc region to the viscosity of omalizumab and trastuzumab IgG1 antibodies. Cartoon representation of antibody formats highlighting corresponding protein concentrations used in viscosity experiments including the equimolar fragmented mixture of F(ab’)2 and Fc. Viscosity data were obtained by rheometry at a total protein concentration of 180 mg/mL in 20 mM histidine acetate, pH 5.5 at 25.0°C for omalizumab and trastuzumab. Data shown are the mean viscosity values (n = 2–5) ± SD analyzed using one-way ANOVA with *p ≤ 0.05, **p ≤ 0.01, ***p ≤ 0.001, ****p ≤ 0.0001 versus the corresponding parent antibody.
Figure 2.
Figure 2.
Survey of some commonly used Fc variants (Table 1) on the high concentration viscosity of (a) omalizumab and (b) trastuzumab. Viscosity measurements were made by rheometry with 180 mg/mL IgG1 antibody variant solutions in 20 mM histidine acetate, pH 5.5 at 25.0°C. Data shown are mean viscosity values (n = 1–5) ± SD analyzed using one-way ANOVA with *p ≤ 0.05, **p ≤ 0.01, ***p ≤ 0.001, ****p ≤ 0.0001 versus the corresponding parent antibody.
Figure 3.
Figure 3.
Location of Fc residues where mutations modulate the viscosity of omalizumab and trastuzumab. The Fc structure was visualized using UCSF ChimeraX software, with the Fc glycan at N297 highlighted as a light gray surface. (a) Molecular structure of Fc region (PDB structure 7LBL) highlighting areas where mutations resulted in the largest changes in viscosity for omalizumab (red boxes) and trastuzumab (blue boxes). CH2/CH3 elbow region indicating the location of residues (b) M252, S254, and T256 mutated in the YTE variant that decreases the viscosity of omalizumab and (d) residues M428 and N434 mutated in the LS variant that increases the viscosity of omalizumab. (c) Upper CH2 residues that when mutated resulted in the largest increases in viscosity for trastuzumab. Polar (green), nonpolar (orange), and positively charged (blue) side chains are highlighted.
Figure 4.
Figure 4.
Viscosity of different IgG1 antibodies as parent, YTE, and LS variants. Viscosity measurements were made by rheometry with 180 mg/mL IgG1 antibody solutions in 20 mM histidine acetate, pH 5.5 at 25.0°C presented as (a) raw viscosity values. Data shown are the mean values (n = 2–5) ± SD. (b) percent-change in viscosity from antibodies containing the parent Fc.
Figure 5.
Figure 5.
Viscosity of omalizumab and YTE-related variants in the presence or absence formulation excipients. Rheometry measurements were obtained at 180 mg/mL IgG1 antibody solutions in 20 mM histidine acetate, pH 5.5 at 25.0°C. Data shown are mean viscosity values (n = 2–5) ± SD. (a) The viscosity of omalizumab parent IgG1 (gray bar) was compared to the YTE triple mutant (open bar) and component single and double mutants (red bars). Data were analyzed using one-way ANOVA with *p ≤ 0.05, **p ≤ 0.01, ***p ≤ 0.001, ****p ≤ 0.0001 versus the YTE (M252Y:S254T:T256E) variant. (b) Viscosity measurements for omalizumab parent IgG1 at different concentrations and pH values. Viscosity measurements of omalizumab parent IgG1 and YTE mutant at 180 mg/mL IgG1 in the presence of either (c) NaCl or (d) Arg-HCl.
Figure 6.
Figure 6.
Impact of mutations on surface properties and conformational stability of the elbow loop in the Fc (a) distribution of SAP scores summed over the elbow loop (residues 246–258) during MD simulations. (b) Distribution of the electrostatic potential calculated using APBS summed over the residues in the elbow (residues 246–258) during MD simulations. (c) The value of SAP and APBS values calculated for the elbow loop averaged over all the MD frames. The green region highlights lowered hydrophobicity and more negative Fc, thus reducing viscosity. The red region shows increased hydrophobicity and more positive Fc, increasing the risk of viscosity. (d) Distribution of RMSD of heavy atoms of the elbow residues relative to the starting structure during MD simulations.
Figure 7.
Figure 7.
Modulations in intramolecular interaction network in the parent Fc and YTE variant. (a) Representative comparison of intramolecular interaction networks for parent Fc and YTE variant. A stable salt-bridge network (black line between residues) primarily involving residues R255, K248, K246, and D249 is shown for each while residues M252, S254, and T256 remain predominantly solvated (light blue highlight) in the parental Fc. In contrast, the introduction of M252Y and/or T256E mutations in the YTE variant disrupts this stability, leading to the formation of transient intramolecular interactions (green lines between residues). (b) Molecular structure of Fc with focus on CH2/CH3 elbow region depicting intramolecular salt-bridge network. (c-f) selected frames of MD simulation highlighting (c) retained R255, K248, K246, and D249 salt-bridge, (d) Y252 cation-π interaction with K248, R255 salt-bridge with E258, (e) additional Y252 cation-π interaction with R255 and (f) E256 forms favorable interactions primarily with R255, with lesser involvement with other basic residues through salt-bridge formations. An occasional interaction between E258 and K246 was observed but not shown explicitly in the selected frames. Polar (green), nonpolar (orange), aromatic (yellow), negatively charged (red), and positively charged (blue) side chains are highlighted.
Figure 8.
Figure 8.
Model for potential interaction sites for (a) IgG and (b) omalizumab including its corresponding F(ab′)2 fragment plus Fc mixture and the omalizumab YTE variant.

References

    1. Carter PJ, Rajpal A.. Designing antibodies as therapeutics. Cell. 2022;185(15):2789–15. doi:10.1016/j.cell.2022.05.029. - DOI - PubMed
    1. The Antibody Society. Therapeutic monoclonal antibodies approved or in regulatory review . accessed 2024 May 3]. www.antibodysociety.org/antibody-therapeutics-product-data.
    1. Ghosh I, Gutka H, Krause ME, Clemens R, Kashi RS.. A systematic review of commercial high concentration antibody drug products approved in the US: formulation composition, dosage form design and primary packaging considerations. MAbs. 2023;15(1):2205540. doi:10.1080/19420862.2023.2205540. - DOI - PMC - PubMed
    1. Strickley RG, Lambert WJ. A review of formulations of commercially available antibodies. J Pharm Sci. 2021;110(7):2590–608 e2556. doi:10.1016/j.xphs.2021.03.017. - DOI - PubMed
    1. Shire SJ, Shahrokh Z, Liu J. Challenges in the development of high protein concentration formulations. J Pharm Sci. 2004;93(6):1390–402. doi:10.1002/jps.20079. - DOI - PubMed

MeSH terms

LinkOut - more resources