. 2024 Aug 14;15(8):e0137624.
doi: 10.1128/mbio.01376-24. Epub 2024 Jul 19.

Accounting for cellular-level variation in lysis: implications for virus-host dynamics

Affiliations

Accounting for cellular-level variation in lysis: implications for virus-host dynamics

Marian Dominguez-Mirazo et al. mBio. .

Abstract

Viral impacts on microbial populations depend on interaction phenotypes-including viral traits spanning the adsorption rate, latent period, and burst size. The latent period is a key viral trait in lytic infections. Defined as the time from viral adsorption to viral progeny release, the latent period of bacteriophage is conventionally inferred via one-step growth curves in which the accumulation of free virus is measured over time in a population of infected cells. Developed more than 80 years ago, one-step growth curves do not account for cellular-level variability in the timing of lysis, potentially biasing inference of viral traits. Here, we use nonlinear dynamical models to understand how individual-level variation of the latent period impacts virus-host dynamics. Our modeling approach shows that inference of the latent period via one-step growth curves is systematically biased-generating estimates of shorter latent periods than the underlying population-level mean. The bias arises because variability in lysis timing at the cellular level leads to a fraction of early burst events, which are interpreted, artefactually, as an earlier mean time of viral release. We develop a computational framework to estimate latent period variability from joint measurements of host and free virus populations. Our computational framework recovers both the mean and variance of the latent period within simulated infections including realistic measurement noise. This work suggests that reframing the latent period as a distribution to account for variability in the population will improve the study of viral traits and their role in shaping microbial populations.IMPORTANCEQuantifying viral traits-including the adsorption rate, burst size, and latent period-is critical to characterize viral infection dynamics and develop predictive models of viral impacts across scales from cells to ecosystems. Here, we revisit the gold standard of viral trait estimation-the one-step growth curve-to assess the extent to which assumptions at the core of viral infection dynamics lead to ongoing and systematic biases in inferences of viral traits. We show that latent period estimates obtained via one-step growth curves systematically underestimate the mean latent period and, in turn, overestimate the rate of viral killing at population scales. By explicitly incorporating trait variability into a dynamical inference framework that leverages both virus and host time series, we provide a practical route to improve estimates of the mean and variance of viral traits across diverse virus-microbe systems.

Keywords: bacteriophage lysis; cellular variability; inference; latent period; mathematical modeling; phage ecology; population dynamics; viral traits.


Conflict of interest statement

The authors declare no conflict of interest.

Figures
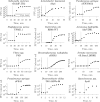
Fig 1
Fig 1
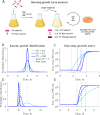
The one-step growth curve protocol for inferring lysis timing. The one-step growth curve is used to estimate burst size and latent period by observing a single round of infection. In such experiments, virus is added to a microbial population and left to adsorb until the majority of the cells are infected. The population is diluted or viruses are removed to prevent the occurrence of new infections. From this point, plaque-forming units (PFUs) are measured over time. The time of first visible burst, when PFU counts start to increase due to cell lysis and viral progeny release, is commonly reported as the latent period (18, 21). The latent period of multiple virus–microbe pairs has been characterized using this method. Here, we show examples of different microbe–virus pairs where the time of first burst was reported as the latent period ranging from 15 min to 4 h. The dotted line represents the reported value in the corresponding study. The list of data sources (10, 22–32) is available in Table S1.
Fig 2
Fig 2
The latent period distribution connects individual variation to population-level microbe–virus dynamics. (A) Using our microbe–virus dynamical model, we simulated one-step growth curves following standard protocols, as described in Materials and Methods. (B) Populations in each simulation have the same traits (Table 1), i.e., microbial growth rate, carrying capacity, adsorption rate, burst size, and LP mean (4 h, dashed gray line), and only differ in the CV of the latent period distribution, which varies across simulations with larger CV depicted in lighter shades of blue. (C) The one-step growth curves for the different simulations show different free virus dynamics. The standard estimates of the latent period, as measured by the time of first burst (dotted lines), vary across simulations. Latent period variability affects the one-step growth curves for otherwise identical populations. (D) In this set of simulations, the populations have the same traits (Table 1), i.e., microbial growth rate, carrying capacity, adsorption rate, and burst size, but differ in latent period distributions with varying latent period mean and CV. (E) Systems with visibly different latent period distributions can result in similar first burst estimates derived from one-step growth curves.
Fig 3
Fig 3
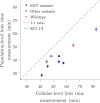
Population-level measurements systematically underestimate the lysis time in λ phage lysogens. The measured lysis time, i.e., time to lysis after prophage induction, of λ lysogens is systematically shorter in population-scale turbidity assays (13) when compared to the mean lysis time obtained from microscope observations of single-cell lysis events (35). The lysogens are isogenic with mutations in holin and antiholin coding genes that result in changes in lysis time. Solid circles represent S107 mutants where antiholin expression is abolished. The dashed line shows a one-to-one relationship. Confidence intervals were calculated by multiple resampling using experimental mean and standard deviation assuming normality, as explained in reference . Data recovered from references , are available in Table S2.
Fig 4
Fig 4
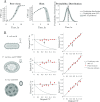
Latent period distribution identifiability when using one-step growth curves. (A) Simulated one-step growth curves (see Materials and Methods) obtained from microbe–virus pairs with different underlying latent period distributions can resemble each other. When we compare a reference curve (red cross) to curves obtained from systems with different distributions, we observe that curves that resemble the reference the most are found along an ascending slope. These correspond to combinations of larger mean, larger CV (green cross) or smaller mean, smaller CV (purple cross). (B) Example of different combinations of latent period mean and CV that produce similar curves. One-step growth curves become harder to differentiate when taking experimental noise into account. Changes in host density, represented by colony-forming units per volume unit, resulting from viral lysis in a single cycle of infection are insignificant owing to the low multiplicity of infection (MOI) utilized in protocols. (C) Corresponding latent period distributions for panels A and B. All nonlatent period traits, i.e., microbial growth rate, carrying capacity, adsorption rate, and burst size, are the same across simulations (Table 2).
Fig 5
Fig 5
Multi-cycle response curves provide a better alternative for latent period distribution identification. (A) We simulate an experimental protocol where infecting viral particles are added to a microbial population at MOI 0.01 (see Materials and Methods). Free virus and host cells are quantified at multiple time points after infection. Unlike one-step growth curve protocols, there is no removal of free viral particles after an incubation period. The simulated time captures multiple rounds of infection. (B) Free virus dynamics of three simulations with different latent period distributions but otherwise the same viral and host parameters (Table 2). Note that multiple rounds of infection are observed. (C) Corresponding host dynamics for the three simulations. While the one-step growth curves for the same parameters are highly similar (Fig. 4), the multi-cycle response curves differ from each other.
Fig 6
Fig 6
Latent period distribution estimated from simulated multi-cycle response curves. (A) Estimation of the latent period distribution of a virus–microbe system by fitting a nonlinear dynamical model to the simulated time series with added noise. In this example, we estimate the latent period distribution of free virus and host time series simulated data with added noise (left and middle panels). Thus, we have a priori knowledge of the underlying latent period distribution (black curve) of the system to evaluate our framework. We can accurately estimate the original mean (mean LP = 1 h, black line) and CV = 0.25 and therefore estimate the original latent period distribution (compare black curve and confidence interval estimations). Gray shaded region indicates 95% confidence intervals. (B) We use parameter values that capture the interactions of three biologically relevant systems: Escherichia coli and λ phage, Prochlorococcus and P-HM2, and Emiliania huxleyi and EhV (Table 3). We model these systems assuming different latent period distribution dispersions. The dashed lines represent the original mean and CV values of the distribution used to create the data, red dots represent point estimates of the latent period mean (T) and CV, and error bars show 95% confidence intervals that fall within one order of magnitude of the original value across all simulations. The time of first burst obtained from the corresponding simulated one-step growth curves (dotted line) systematically underestimates the population mean, while our approach predicts the parameter value more accurately.

References

    1. Levin BR, Stewart FM, Chao L. 1977. Resource-limited growth, competition, and predation: a model and experimental studies with bacteria and bacteriophage. Amer Nat 111:3–24. doi:10.1086/283134 - DOI
    1. Lindell D, Jaffe JD, Coleman ML, Futschik ME, Axmann IM, Rector T, Kettler G, Sullivan MB, Steen R, Hess WR, Church GM, Chisholm SW. 2007. Genome-wide expression dynamics of a marine virus and host reveal features of co-evolution. Nature 449:83–86. doi:10.1038/nature06130 - DOI - PubMed
    1. Correa AMS, Howard-Varona C, Coy SR, Buchan A, Sullivan MB, Weitz JS. 2021. Revisiting the rules of life for viruses of microorganisms. Nat Rev Microbiol 19:501–513. doi:10.1038/s41579-021-00530-x - DOI - PubMed
    1. Breitbart M, Bonnain C, Malki K, Sawaya NA. 2018. Phage puppet masters of the marine microbial realm. Nat Microbiol 3:754–766. doi:10.1038/s41564-018-0166-y - DOI - PubMed
    1. Danovaro R, Corinaldesi C, Dell’anno A, Fuhrman JA, Middelburg JJ, Noble RT, Suttle CA. 2011. Marine viruses and global climate change. FEMS Microbiol Rev 35:993–1034. doi:10.1111/j.1574-6976.2010.00258.x - DOI - PubMed

MeSH terms

LinkOut - more resources