. 2024 Oct;20(7):1954-1970.
doi: 10.1007/s12015-024-10764-w. Epub 2024 Jul 19.

Trophoblast Side-Population Markers are Dysregulated in Preeclampsia and Fetal Growth Restriction

Affiliations

Trophoblast Side-Population Markers are Dysregulated in Preeclampsia and Fetal Growth Restriction

Georgia P Wong et al. Stem Cell Rev Rep. 2024 Oct.

Abstract

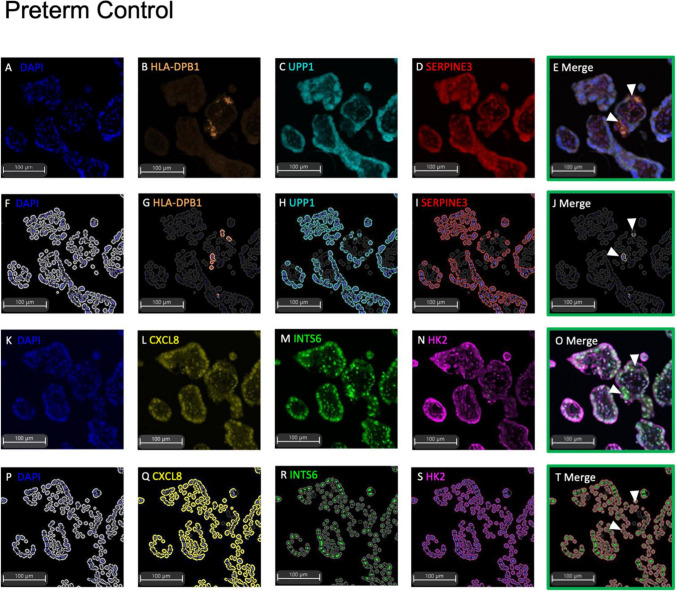
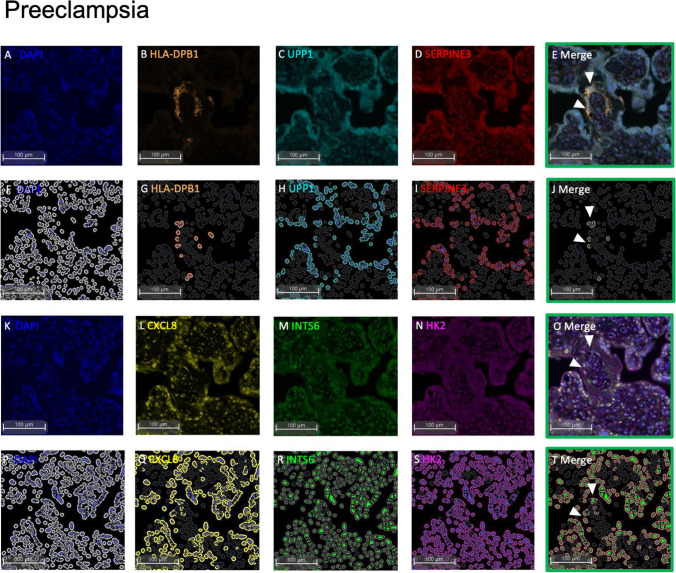
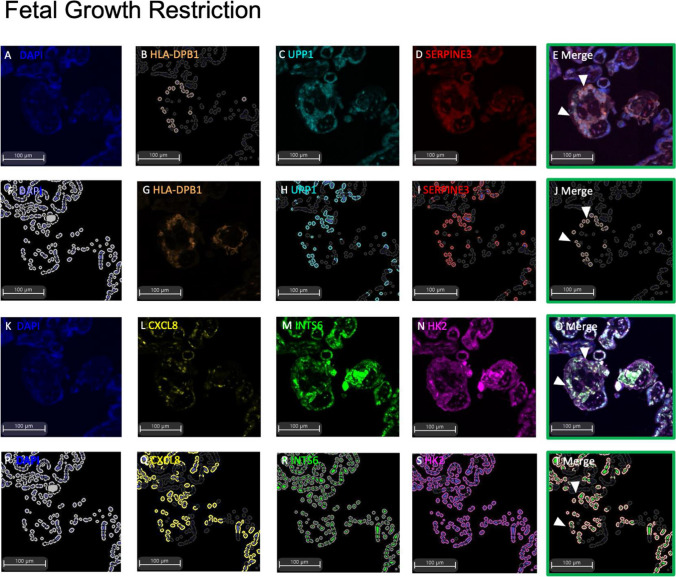
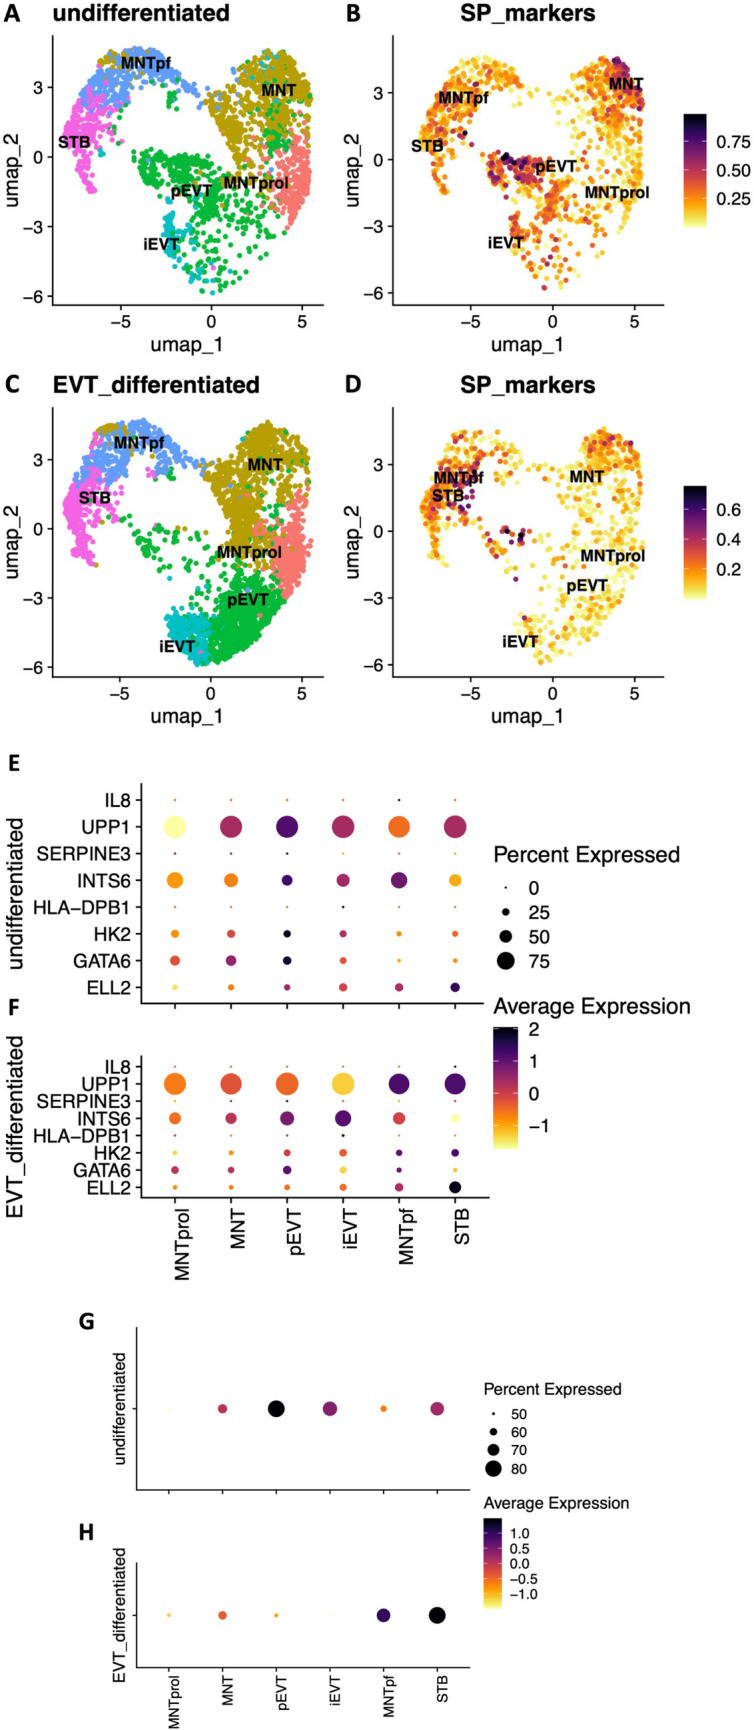
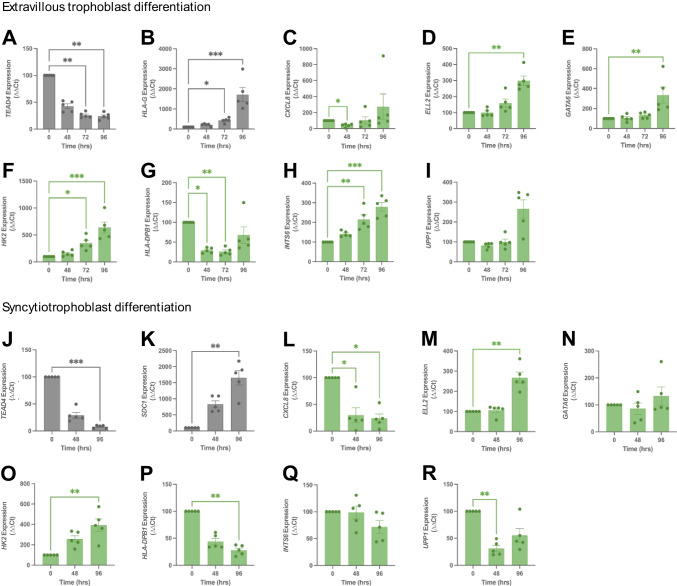
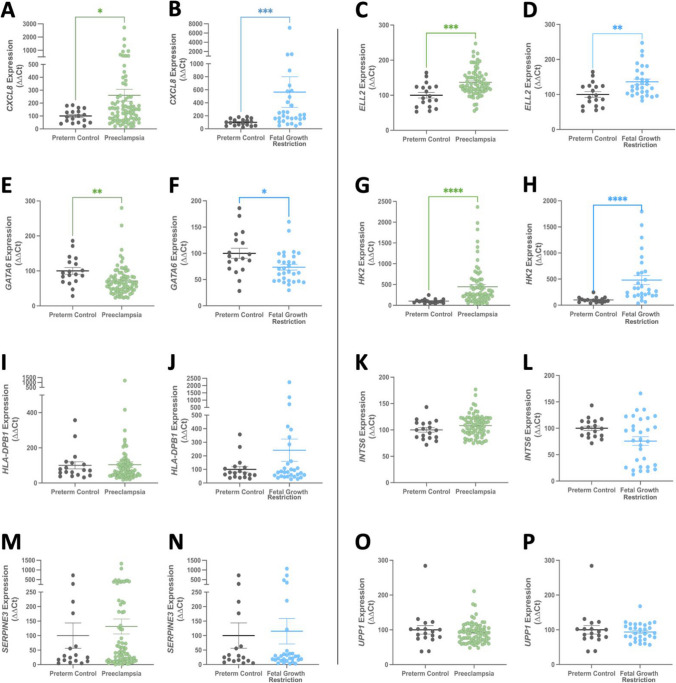
Dysregulated progenitor cell populations may contribute to poor placental development and placental insufficiency pathogenesis. Side-population cells possess progenitor properties. Recent human trophoblast side-population isolation identified enrichment of 8 specific genes (CXCL8, ELL2, GATA6, HK2, HLA-DPB1, INTS6, SERPINE3 and UPP1) (Gamage et al. 2020, Stem Cell Rev Rep). We characterised these trophoblast side-population markers in human placenta and in placental insufficiency disorders: preeclampsia and fetal growth restriction (FGR). Trophoblast side-population markers localised to mononuclear trophoblasts lining the placental villous basement membrane in preterm control, preeclamptic and FGR placental sections (n = 3, panel of 3 markers/serial section). Analysis of single-cell transcriptomics of an organoid human trophoblast stem cell (hTSC) to extravillous trophoblast (EVT) differentiation model (Shannon et al. 2022, Development) identified that all side-population genes were enriched in mononuclear trophoblast and trophoblasts committed to differentiation under hTSC culture conditions. In vitro validation via 96 h time course hTSC differentiation to EVTs or syncytiotrophoblasts (n = 5) demonstrated ELL2 and HK2 increased with differentiation (p < 0.0024, p < 0.0039 respectively). CXCL8 and HLA-DPB1 were downregulated (p < 0.030, p < 0.011 respectively). GATA6 and INTS6 increased with EVT differentiation only, and UPP1 reduced with syncytialisation. SERPINE3 was undetectable. Trophoblast side-population marker mRNA was measured in human placentas (< 34-weeks' gestation; n = 78 preeclampsia, n = 30 FGR, and n = 18 gestation-matched controls). ELL2, HK2 and CXCL8 were elevated in preeclamptic (p = 0.0006, p < 0.0001, p = 0.0335 respectively) and FGR placentas (p = 0.0065, p < 0.0001, p = 0.0001 respectively) versus controls. Placental GATA6 was reduced in pregnancies with preeclampsia and FGR (p = 0.0014, p = 0.0146 respectively). Placental INTS6 was reduced with FGR only (p < 0.0001). This study identified the localisation of a unique trophoblast subset enriched for side-population markers. Aberrant expression of some side-population markers may indicate disruptions to unique trophoblast subtypes in placental insufficiency.

Keywords: Fetal growth restriction; Placenta; Preeclampsia; Pregnancy; Trophoblast.


Conflict of interest statement

The authors declare no conflicts of interest nor competing interests.

Figures

Fig. 1
Fig. 1
Multiplexed immunofluorescence of trophoblast side-population markers in preterm placental serial sections (< 34-week gestation). One serial section stained for each of Panel 1 and 2. Representative raw images of Panel 1: DAPI nuclear counterstain (A), HLA-DPB1 (B), UPP1 (C), SERPINE3 (D), with merge of Panel 1 (E). HALO Analysis of positive immunostaining for DAPI (F), HLA-DPB1 (G), UPP1 (H), SERPINE3 (I), and cells expressing co-localisation of Panel 1 markers (J). Representative raw images of Panel 2: DAPI counterstain (K), CXCL8 (L), INTS6 (M), HK2 (N), merge of Panel 2 (O). HALO analysis of positive immunostaining for DAPI (P), CXCL8 (Q), INTS6 (R), HK2 (S), and cells expressing co-localisation of Panel 2 markers (T). Representative images of n = 3 at 10 × magnification shown
Fig. 2
Fig. 2
Multiplexed immunohistochemistry of trophoblast side-population markers in placentas from preterm preeclampsia (< 34-week gestation). One serial section stained for each of Panel 1 and 2. Representative raw images of Panel 1: DAPI nuclear counterstain (A), HLA-DPB1 (B), UPP1 (C), SERPINE3 (D), with merge of Panel 1 (E). HALO Analysis of positive immunostaining for DAPI (F), HLA-DPB1 (G), UPP1 (H), SERPINE3 (I), and cells expressing co-localisation of Panel 1 markers (J). Representative raw images of Panel 2: DAPI counterstain (K), CXCL8 (L), INTS6 (M), HK2 (N), merge of Panel 2 (O). HALO analysis of positive immunostaining for DAPI (P), CXCL8 (Q), INTS6 (R), HK2 (S), and cells expressing co-localisation of Panel 2 markers (T). Representative images of n = 3 at 10 × magnification shown
Fig. 3
Fig. 3
Multiplexed immunohistochemistry of trophoblast side-population markers in placentas from fetal growth restriction (< 34-week gestation). One serial section stained for each of Panel 1 and 2. Representative raw images of Panel 1: DAPI nuclear counterstain (A), HLA-DPB1 (B), UPP1 (C), SERPINE3 (D), with merge of Panel 1 (E). HALO Analysis of positive immunostaining for DAPI (F), HLA-DPB1 (G), UPP1 (H), SERPINE3 (I), and cells expressing co-localisation of Panel 1 markers (J). Representative raw images of Panel 2: DAPI counterstain (K), CXCL8 (L), INTS6 (M), HK2 (N), merge of Panel 2 (O). HALO analysis of positive immunostaining for DAPI (P), CXCL8 (Q), INTS6 (R), HK2 (S), and cells expressing co-localisation of Panel 2 markers (T). Representative images of n = 3 at 10 × magnification shown
Fig. 4
Fig. 4
Single-cell RNA sequencing analysis of the trophoblast side-population-enriched genes in human trophoblast stem cell (hTSC) organoids and differentiated extravillous trophoblasts (EVTs). Transcriptomic analysis of a publicly available single-cell RNA sequencing dataset of n = 3 biological replicates of three-dimensional hTSC-derived organoids treated under hTSC conditions or induced to differentiate to EVTs for 21 days (Shannon et al., Development 2022). Analysis resulted in 6 distinct transcriptomic cell identities: mononuclear trophoblast (MNT), proliferative mononuclear trophoblast (MNTprol), pre-fusion mononuclear trophoblast (MNTpf), progenitor EVT (pEVT), invasive EVT (iEVT) and syncytiotrophoblast (STB). UMAP plot of cell identities in undifferentiated hTSC organoids (A). Feature plot showing a module score analysis for trophoblast side-population genes CXCL8 (IL8), ELL2, GATA6, HK2, HLA-DPB1, INTS6, SERPINE3, and UPP1 where the relative expression of these genes is plotted (B). UMAP plot of cell identities in differentiated EVT organoid culture (C). A feature plot showing a module score analysis for trophoblast side-population genes in EVT organoid culture (D). Dot plot of each trophoblast-side population marker gene expression to specific cell identities in undifferentiated (E) and differentiated EVT (F) organoid culture. Dot plot of the module scores for all trophoblast side-population panel markers in undifferentiated (G) and differentiated (H) organoid culture
Fig. 5
Fig. 5
Trophoblast side-population-enriched genes and their expression with differentiation of human trophoblast stem cells (hTSCs) to extravillous trophoblasts and syncytiotrophoblasts. hTSCs were differentiated to extravillous trophoblasts (EVT) at 0, 48, 72 and 96 h post-differentiation, or syncytiotrophoblasts at 0, 48, 96 h post-differentiation. EVT differentiation was confirmed with TEAD4 loss (p = 0.0067 72 h, p = 0.0018 96 h) (A) and induction of HLA-G expression (p = 0.026 72 h, p = 0.0002 96 h) (B). As hTSCs differentiated to EVTs, CXCL8 expression was reduced (p = 0.030) (C). ELL2 (p = 0.0047) (D), GATA6 (p = 0.0039) (E) and HK2 (p = 0.018 72 h, 0.0003 96 h) (F) were upregulated. HLA-DPB1 expression reduced (p = 0.011 48 h, p = 0.0046 72 h) (G). INTS6 was upregulated (p = 0.0092 72 h, p = 0.0005 96 h) (H). UPP1 was unaltered (I). SERPINE3 was not expressed at any timepoint (data not shown). Syncytiotrophoblast differentiation was confirmed with TEAD4 loss (p = 0.0006) (J) and SDC1 gain (p = 0.0011) (K). As hTSCs differentiated to syncytiotrophoblasts, CXCL8 was reduced (p = 0.015 48 h, p = 0.012 96 h) (L). ELL2 was upregulated (p = 0.0024 96 h) (M), GATA6 was unaltered (N), HK2 was raised (p = 0.0019) (O), HLA-DPB1 was reduced at 48 h (with low statistical significance p = 0.051) and 96 h (p = 0.0031) (P). INTS6 was unaltered (Q). UPP1 expression was downregulated (p = 0.0063) (R). mRNA expression was normalised to the geometric mean of housekeeper genes. Data expressed as mean ± SEM with all experiments repeated n = 5 in triplicates for EVTs and duplicates for syncytiotrophoblasts. *p < 0.05, **p < 0.01, ***p < 0.001
Fig. 6
Fig. 6
Trophoblast side-population-enriched genes CXCL8, ELL2, GATA6, and HK2 are dysregulated in placentas obtained from pregnancies complicated by preeclampsia and fetal growth restriction. mRNA expression of side-population genes in placentas from participants with preeclampsia (n = 78 green circle), or fetal growth restriction (FGR, n = 30, blue circle) compared to gestation-matched preterm (< 34-week) controls (n = 18, grey circle). CXCL8 was upregulated in preeclampsia (p = 0.037) (A) and FGR (p = 0.0001) (B). ELL2 was elevated in preeclampsia (p = 0.0006) (C) and FGR (p = 0.0065) (D). GATA6 was downregulated in preeclampsia (p = 0.0014) (E) and FGR (p = 0.0146) (F). HK2 was upregulated in preeclampsia (p < 0.0001) (G) and FGR (p < 0.0001) (H). HLA-DPB1 was unaltered in preeclampsia (I) and FGR (J); as was INTS6 in preeclampsia (K) and FGR (L); SERPINE3 in preeclampsia (M) and FGR (N); and UPP1 in preeclampsia (O) and FGR (P). mRNA expression was normalised to the geometric mean of housekeeper genes. Individual symbols represent individual participants. Data is expressed as mean ± SEM. *p < 0.05, **p < 0.01, ***p < 0.001, ****p < 0.0001

References

    1. Abalos, E., Cuesta, C., Grosso, A. L., Chou, D., & Say, L. (2013). Global and regional estimates of preeclampsia and eclampsia: A systematic review. European Journal of Obstetrics & Gynecology and Reproductive Biology,170(1), 1–7. - PubMed
    1. Dimitriadis, E., Rolnik, D. L., Zhou, W., Estrada-Gutierrez, G., Koga, K., Francisco, R. P. V., Whitehead, C., Hyett, J., da Silva, C. F., Nicolaides, K., & Menkhorst, E. (2023). Pre-eclampsia. Nature Reviews Disease Primers,9(1), 8. - PubMed
    1. Gardosi, J., Madurasinghe, V., Williams, M., Malik, A., & Francis, A. (2013). Maternal and fetal risk factors for stillbirth: Population based study. BMJ,24(346), f108. - PMC - PubMed
    1. Mustata, R. C., Van Loy, T., Lefort, A., Libert, F., Strollo, S., Vassart, G., & Garcia, M. I. (2011). Lgr4 is required for paneth cell differentiation and maintenance of intestinal stem cells ex vivo. EMBO Reports,12(6), 558–564. - PMC - PubMed
    1. Hsu, Y. C., Li, L., & Fuchs, E. (2014). Transit-amplifying cells orchestrate stem cell activity and tissue regeneration. Cell,157(4), 935–949. - PMC - PubMed

Publication types