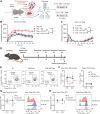
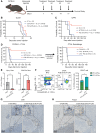
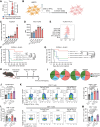
. 2024 Nov 4;26(11):2044-2060.
doi: 10.1093/neuonc/noae135.

Fc-enhanced anti-CTLA-4, anti-PD-1, doxorubicin, and ultrasound-mediated blood-brain barrier opening: A novel combinatorial immunotherapy regimen for gliomas

Affiliations

Fc-enhanced anti-CTLA-4, anti-PD-1, doxorubicin, and ultrasound-mediated blood-brain barrier opening: A novel combinatorial immunotherapy regimen for gliomas

Kwang-Soo Kim et al. Neuro Oncol. .

Abstract

Background: Glioblastoma is a highly aggressive brain cancer that is resistant to conventional immunotherapy strategies. Botensilimab, an Fc-enhanced anti-CTLA-4 antibody (FcE-aCTLA-4), has shown durable activity in "cold" and immunotherapy-refractory cancers.

Methods: We evaluated the efficacy and immune microenvironment phenotype of a mouse analogue of FcE-aCTLA-4 in treatment-refractory preclinical models of glioblastoma, both as a monotherapy and in combination with doxorubicin delivered via low-intensity pulsed ultrasound and microbubbles (LIPU/MB). Additionally, we studied 4 glioblastoma patients treated with doxorubicin, anti-PD-1 with concomitant LIPU/MB to investigate the novel effect of doxorubicin modulating FcγR expressions in tumor-associated macrophages/microglia (TAMs).

Results: FcE-aCTLA-4 demonstrated high-affinity binding to FcγRIV, the mouse ortholog of human FcγRIIIA, which was highly expressed in TAMs in human glioblastoma, most robustly at diagnosis. Notably, FcE-aCTLA-4-mediated selective depletion of intratumoral regulatory T cells (Tregs) via TAM-mediated phagocytosis, while sparing peripheral Tregs. Doxorubicin, a chemotherapeutic drug with immunomodulatory functions, was found to upregulate FcγRIIIA on TAMs in glioblastoma patients who received doxorubicin and anti-PD-1 with concomitant LIPU/MB. In murine models of immunotherapy-resistant gliomas, a combinatorial regimen of FcE-aCTLA-4, anti-PD-1, and doxorubicin with LIPU/MB, achieved a 90% cure rate, that was associated robust infiltration of activated CD8+ T cells and establishment of immunological memory as evidenced by rejection upon tumor rechallenge.

Conclusions: Our findings demonstrate that FcE-aCTLA-4 promotes robust immunomodulatory and anti-tumor effects in murine gliomas and is significantly enhanced when combined with anti-PD-1, doxorubicin, and LIPU/MB. We are currently investigating this combinatory strategy in a clinical trial (clinicaltrials.gov NCT05864534).

Keywords: BBB; Fc-enhanced anti-CTLA-4; doxorubicin; glioblastoma; immunotherapy.


Conflict of interest statement

A.M.S. and R.St. have received in-kind and/or funding support for research from Agenus, BMS, and CarThera. A.M.S., V.A.A., K.S.K., C.A., and R.St. are co-authors of IP filed by Northwestern University related to the content of this manuscript. A.M.S. is a paid consultant for Carthera and Enclear Therapies. R.St. has acted or is acting as a scientific advisor or has served on advisory boards for the following companies: Alpheus Medical, AstraZeneca, Boston Scientific, CarThera, Celularity, GT Medical, Insightec, Lockwood (BlackDiamond), Northwest Biotherapeutics, Novocure, Inc., Syneos Health (Boston Biomedical), TriAct Therapeutics, Varian Medical Systems. M.C. is an employee and holds ownership interest in Carthera, as well as patents related to the ultrasound technology described herein. R.R. is a founder and a member of the Avisory Board of Genotwin, Diatech Pharmacogenetics, and a consultant for Arquimea Research. None of these activities are related to the work described in this manuscript. D.C., B.M.M., and D.L. are employees of Agenus Bio. All other authors declare that they have no competing interests.

Figures

Figure 1.
Figure 1.
Fc-enhanced anti-mouse CTLA-4 antibody exhibits increased binding to Fcγ receptors. Binding kinetics of an unmodified (mIgG2b) anti-mouse CTLA-4 (aCTLA-4) and an Fc-enhanced (mIgG2b-DLE) anti-mouse CTLA-4 variant to mouse FcγRIIB and FcγRIV proteins using SPR. For binding to mouse FcγRIIB (A and B), antibodies were injected at concentrations ranging from 62 nM to 8 µM. For binding to mouse FcγRIV (C and D), antibodies were injected at concentrations ranging from 0.93 to 120 nM. Assessment of mouse reactive anti-CTLA-4 antibody binding to Chinese hamster ovarian (CHO) cells genetically engineered to express mouse (E) Fcγ receptor (FcγR) I, (F) FcγRIIB, (G) FcγRIII, or (H) FcγRIV. Cells were incubated with increasing concentrations of Fc-enhanced mouse reactive anti-CTLA-4 antibody (clone 9D9, mIgG2b.DLE), anti-CTLA-4 mIgG2b, or an mIgG1 isotype control antibody (negative control). Binding was analyzed by flow cytometry using a fluorochrome-conjugated anti-mouse F(ab’)2 secondary antibody.
Figure 2.
Figure 2.
FcγRIIIA expression in newly diagnosed versus recurrent glioblastoma microenvironment. (A) Uniform manifold approximation and projection (UMAP) dimensionality reduction plot indicating cell categories from single-cell RNA-sequencing analysis of human glioma patients. Violin plot of FCGR3A (B) and CTLA-4 (C) expression across the cell types in human recurrent glioblastoma. (D) Representative multiplex immunofluorescence images of a newly diagnosed glioblastoma and recurrent glioblastoma from patients showing FcγRIIIA expression on myeloid cell compartment. (E) Quantification graph showing the percentages of infiltrating macrophage/microglial cell phenotypes out of FcγRIIIA+ cells. An unpaired t-test was used for statistical analysis. Quantitative cell density analysis of 3 different myeloid phenotypes with FcγRIIIA including TMEM119+CD163 (F), CD11c+HLA-DR+ (G), and CD163+TMEM119 (H). Quantitative cell density analysis of 3 different myeloid phenotypes, including TMEM119+CD163 (I), CD11c+HLA-DR+ (J), and CD163+TMEM119 (K). An unpaired t-test was used for statistical analysis. Data indicate mean ± SD and the P value is depicted.
Figure 3.
Figure 3.
Fc-enhanced anti-CTLA-4-mediated Treg depletion in glioma microenvironment. (A) Schematic illustration of cell preparation. TAMs generated from bone marrow progenitor cells differentiated with M-CSF and conditioned with CT-2A mouse glioblastoma cell cultured media. (B) Graph showing time-dependent cell overlap (phagocytosis) between Tregs (② right in A) and macrophages (① in A) with isotype control, parental anti-CTLA-4, and FcE anti-CTLA-4 antibody. (C) Graph showing time-dependent cell overlap (phagocytosis) between CD4+ T cells (non-Tregs, ② left in A) and macrophages (① in A) with isotype control, parental anti-CTLA-4, and FcE anti-CTLA-4 antibody. (D) Schematic illustration of immunophenotype analysis design. (E) Flow cytometry analysis showing Tregs (Foxp3+) in CD4+ T cells at day 21. (F) Tumor-specific Treg ratio was plotted at 2 different time points (left) and the Treg ratio in the spleen on days 14 and 21 (right). Each comparison was analyzed by unpaired Student’s t-test. (G) Time-dependent PD-1 downregulation in CD4+ T cells. At each time point, the mean fluorescent intensity of PD-1 was calculated and plotted (left), and the representative histogram (right). (H) Time-dependent PD-1 downregulation in CD8+ T cells. At each time point, the mean fluorescent intensity of PD-1 was calculated and plotted (left), and the representative histogram (right). An unpaired t-test was used for statistical analysis. Data indicate mean ± SD, and significance is depicted as ns: not statistically significant, *P < .05, **P < .01, ***P < .001, ****P < .0001.
Figure 4.
Figure 4.
Anti-tumor efficacy of Fc-enhanced anti-CTLA-4 antibody in murine glioma. (A) Schematic illustration of treatment and survival study design. The efficacy test of the FcE anti-CTLA-4 antibody was conducted in 3 different mouse syngeneic models GL261, QPP4, and CT-2A. (B) Kaplan–Meier survival curve of GL261-bearing C57BL/6 mice treated with FcE anti-CTLA-4 or parental antibody. (C) Kaplan–Meier survival curve of QPP4 bearing C57BL/6 mice treated with FcE anti-CTLA-4 or parental antibody. (D) Kaplan–Meier survival curve of CT-2A model (left) and tumor rechallenge survival curve from long-term survivors (right). (E) Flow cytometry analysis of immune profiles for comparison of non-treat control tumor and long-term survivors. The myeloid cells and lymphocytes ratio was plotted (left), and CD8/CD4 ratio was plotted (right). (F) Representative CD8+ T cell properties were evaluated by PD-1 and IFN-γ expression (left) and a summarized bar graph (right). (G) CD8 immunohistochemistry images of newly developed non-treat control CT-2A tumor (left) and long-term survivor mice (right). (H) Foxp3 immunohistochemistry images of newly developed non-treat control CT-2A tumor (left) and long-term survivor mice (right) (scale bar = 100 µm). Unpaired t-test (E) or 2-way ANOVA (F) was used for statistical analysis. Data indicate mean ± SD, and significance is depicted as ns = not statistically significant, *P < .05, **P < .01, ***P < .001, ****P < .0001. LTS (long-term survivors).
Figure 5.
Figure 5.
Doxorubicin plus anti-PD-1-mediated alteration of FcγRIIIA-related phenotype of glioblastoma infiltrating myeloid cells. (A) Clinical course of recurrent GBM patients analyzed in this study. Patients underwent surgery for tumor resection (pre-DOX samples) and skull implantation of the SonoCloud-9 ultrasound device for treatment with previous chemotherapy. Upon tumoral progression, induction treatment with DOX delivered with LIPU/MB was initiated to treat the recurrent tumor, followed by additional treatment cycles with both liposomal DOX and anti-PD-1 delivered by LIPU/MB. The tumor exposed to these therapies was resected (during-DOX samples) and further analyzed. (B) Representative multiplex immunofluorescence images of tumor regions before and during-DOX treatment. (C) Quantification graph showing the percentages of infiltrating macrophage/microglial cell phenotypes out of FcγRIIIA+ cells before and during-DOX treatment. Comparison of infiltrating TMEM119+FcγRIIIA+ cells (D), CD163+FcγRIIIA+ cells (E), and CD11c+FcγRIIIA+ cells (F) before and during-DOX treatment. Paired t-test was used for statistical analysis and, the P value was indicated. Quantitative mean fluorescent values for FcγRIIIA were measured from multiplex immunofluorescence in TMEM119+ cells (G), CD163+ cells (H), and CD11c+ cells (I). An unpaired t-test was used for statistical analysis. Data indicate mean ± SD and the P value is depicted.
Figure 6.
Figure 6.
Enhanced efficacy of Fc-enhanced anti-CTLA-4 through upregulation of FcγRIIIA. (A) The DOX concentration in glioblastoma from a patient after 2 days of DOX infusion measured by mass spectrometry. (B) Schematic illustration of in vitro DOX effect assay on human microglial cell line (HMC3). (C) Quantitative RT-PCR analysis of FCGR3A expression upon IFN-γ or DOX treatment. An unpaired t-test was used for statistical analysis. (D and E) Flow cytometry analysis showing FcγRIIIA expression measured as MFI values in HMC3 cells. An unpaired t-test was used for statistical analysis. (F) Kaplan–Meier survival plot of GL261-bearing mice treated with FcE anti-CTLA-4, anti-PD-1/FcE anti-CTLA-4 with and without doxorubicin. (G) Kaplan–Meier curve showing survival of GL261 tumor-bearing mice treated with doxorubicin, anti-PD-1/FcE anti-CTLA-4, and the combination of antibodies and doxorubicin with ultrasound. (H) Scheme of immunophenotyping experimental plan. (I) A pie chart showing proportion of infiltrating immune cells. (J) The CD8-to-CD4 ratio of T cells. (K) Functional state of CD8 T cells analyzed by granzyme B and IFN-γ (left), percentage of granzyme B+ cells in CD8+ T cells (right). (L) The Treg population was assessed by Foxp3+ CD4+ T cells. Percentage of Foxp3+ cells in CD4+ T cells (left) and representative figures are shown. (M) The percentage of IFN-γ+ cells in CD4+ T cells. An ordinary 1-way ANOVA was used for statistical analysis. Data indicate mean ± SD and the P value is depicted.

References

    1. Stupp R, Taillibert S, Kanner A, et al. Effect of tumor-treating fields plus maintenance temozolomide vs maintenance temozolomide alone on survival in patients with glioblastoma: a randomized clinical trial. JAMA. 2017;318(23):2306–2316. - PMC - PubMed
    1. Miller KD, Ostrom QT, Kruchko C, et al. Brain and other central nervous system tumor statistics, 2021. CA Cancer J Clin. 2021;71(5):381–406. - PubMed
    1. Janjua TI, Rewatkar P, Ahmed-Cox A, et al. Frontiers in the treatment of glioblastoma: past, present and emerging. Adv Drug Deliv Rev. 2021;171(1):108–138. - PubMed
    1. Reardon DA, Brandes AA, Omuro A, et al. Effect of nivolumab vs bevacizumab in patients with recurrent glioblastoma: the checkmate 143 phase 3 randomized clinical trial. JAMA Oncol. 2020;6(7):1003–1010. - PMC - PubMed
    1. Omuro A, Brandes AA, Carpentier AF, et al. Radiotherapy combined with nivolumab or temozolomide for newly diagnosed glioblastoma with unmethylated MGMT promoter: an international randomized phase III trial. Neuro Oncol. 2023;25(1):123–134. - PMC - PubMed

MeSH terms

Associated data