. 2024 Jul 19;22(7):e3002728.
doi: 10.1371/journal.pbio.3002728. eCollection 2024 Jul.

Signaling through the nicotinic acetylcholine receptor in the liver protects against the development of metabolic dysfunction-associated steatohepatitis

Affiliations

Signaling through the nicotinic acetylcholine receptor in the liver protects against the development of metabolic dysfunction-associated steatohepatitis

Heejin Jun et al. PLoS Biol. .

Abstract

Metabolic dysfunction-associated steatohepatitis (MASH) is the progressive form of liver steatosis, the most common liver disease, and substantially increases the mortality rate. However, limited therapies are currently available to prevent MASH development. Identifying potential pharmacological treatments for the condition has been hampered by its heterogeneous and complex nature. Here, we identified a hepatic nonneuronal cholinergic signaling pathway required for metabolic adaptation to caloric overload. We found that cholinergic receptor nicotinic alpha 2 subunit (CHRNA2) is highly expressed in hepatocytes of mice and humans. Further, CHRNA2 is activated by a subpopulation of local acetylcholine-producing macrophages during MASH development. The activation of CHRNA2 coordinates defensive programs against a broad spectrum of MASH-related pathogenesis, including steatosis, inflammation, and fibrosis. Hepatocyte-specific loss of CHRNA2 signaling accelerates the disease onset in different MASH mouse models. Activation of this pathway via pharmacological inhibition of acetylcholine degradation protects against MASH development. Our study uncovers a hepatic nicotinic cholinergic receptor pathway that constitutes a cell-autonomous self-defense route against prolonged metabolic stress and holds therapeutic potential for combatting human MASH.


Conflict of interest statement

The authors declare no competing interests.

Figures

Fig 1
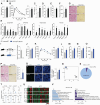
Fig 1. Hepatocyte CHRNA2 signaling is activated during metabolic adaptation to caloric overload.
(A) qPCR analyses of genes encoding nAChR subunits in WT mouse livers (n = 9). (B) Schematic diagram describing the generation of Chrna2Cre-RFP mice by crossing Chrna2Cre and Ai14 mice. (C) qPCR analyses of Rfp expression in brains, livers, and primary hepatocytes of WT and Chrna2Cre-RFP mice (WT, n = 6; Cre, n = 6). (D) Immunoblot analyses for Chrna2Cre-mediated RFP and HSP90 (loading control) expression in brain and liver tissues of WT and Chrna2Cre-RFP mice. (E) RFP signals of liver sections of WT and Chrna2Cre-RFP mice. DAPI was used to stain nuclei. Scale bar, 50 μm. (F) qPCR analyses of Chrna2 expression in liver tissues of WT mice fed with a chow diet or chronic Gubra-Amylin NASH (GAN) diet (Chow, n = 9; GAN, n = 5). (G) Intracellular calcium uptake mediated by the CHRNA2 agonist nicotine (Nic, 500 μm) in the presence or absence of calcium in primary hepatocytes from control WT and Chrna2 KO mice (WT, n = 17; KO, n = 14). (H) Intracellular calcium uptake mediated by 500 μm Nic in human primary hepatocytes (n = 31). (I) qPCR analyses of Chrna2 in primary WT mouse hepatocytes treated with vehicle (Ctrl), palmitate (0.25 mM for 16 h; left, n = 6 per group), or LPS (10 μg/ml for 4 h; right, n = 3 per group). (J) Left, qPCR analyses of Chrna2 in primary WT mouse hepatocytes treated with vehicle (Ctrl) or 1 mM dimethyloxalylglycine (DMOG) for 20 h (n = 4 per group). Right, Chrna2 transcriptional activity using a mouse Chrna2-promoter luciferase reporter construct with control vector or an HIF1α-expressing vector (n = 5 per group). (K) Morphology of primary hepatocytes isolated from chow or GAN diet-fed WT mice. Lipids droplets were stained with Oil Red O or Bodipy. DAPI was used to stain nuclei. Scale bar, 50 μm. Representative images are shown. (L) Left, qPCR analyses of hepatic lipogenic genes in vehicle (Ctrl) or Nic (2 mM for 6 h)-treated primary hepatocytes isolated from GAN diet-fed WT mice (Ctrl, n = 6; Nic, n = 5). Right, immunoblot analyses for CHRNA2-mediated signaling proteins and HSP90 (loading control) against MASH development in primary hepatocytes of GAN diet-fed WT mice after 2 mM Nic treatment for the indicated amount of time. (M) qPCR analyses of Chat in liver tissues (Chatfl/fl, n = 10; Chatfl/fl;Vav-iCre, n = 17) and sorted hepatic CD45+ cells (Chatfl/fl, n = 5; Chatfl/fl;Vav-iCre, n = 3). (N) Quantification of acetylcholine secreted from liver NPCs (n = 6 per group). (O) qPCR analyses of hepatic lipogenic genes in primary hepatocytes isolated from GAN diet-fed WT mice following treatment with control (Ctrl) or NPCs CM for 4 h (Ctrl, n = 5; NPCs-CM, n = 6). (P) Flow cytometric analyses for the abundance of total cells, Kupffer cells (KCs) and MDMs that express ChAT in liver NPCs from ChATBAC-eGFP mice fed with chow diet or GAN diet (Chow, n = 10; GAN, n = 6). (Q) qPCR analyses of Chat in primary BMDMs stimulated with vehicle, 0.5 mM palmitate for 7 h (left; n = 6 per group) or 50 ng/ml LPS for 4 h (right; n = 6 per group). The data underlying the graphs in this figure can be found in S1 Data and S1 Raw Images. Mean ± SEM. n.d., not detected. *p < 0.05, **p < 0.01, ***p < 0.005 by an unpaired two-sample Student’s t test or Mann–Whitney U test. BMDM, bone marrow-derived macrophage; CM, conditioned medium; KO, knockout; LPS, lipopolysaccharides; MASH, metabolic dysfunction-associated steatohepatitis; MDM, monocyte-derived macrophage; nAChR, nicotinic acetylcholine receptor; NPC, non-parenchymal cell; WT, wild-type.
Fig 2
Fig 2. Deficiency of hepatic CHRNA2 signaling accelerates the onset of diet-induced MASH.
(A–H) Control WT and whole-body Chrna2 KO mice following 13-week Gubra-Amylin NASH (GAN) diet feeding. (A) Body weight (WT, n = 12; KO, n = 11). (B) GTT (n = 10 per group). AUC, area under the curve. (C) Liver weight (WT, n = 12; KO, n = 11). (D) Liver per body weight ratio (WT, n = 12; KO, n = 11). (E) Liver triglyceride (TG; n = 15 per group). (F) Plasma alanine aminotransferase (ALT; n = 10 per group). (G) HE and Sirius Red staining of liver sections. Scale bars, 50 μm. Representative images are shown. (H) qPCR analyses of MASH pathogenic genes in livers (WT, n = 12; KO, n = 11). (I–V) Control Chrna2fl/fl and Chrna2fl/fl;AlbCre mice following prolonged GAN diet feeding. (I) Left, schematic diagram illustrating the generation of liver-specific Chrna2 deleted mice by crossing Chrna2fl/fl with AlbCre mice. Right, qPCR analyses of Chrna2 mRNA expression in livers (Chrna2fl/fl, n = 10; Chrna2fl/fl;AlbCre, n = 7). (J) Body weight (n = 6 per group). (K) GTT (Chrna2fl/fl, n = 14; Chrna2fl/fl;AlbCre, n = 12). AUC, area under the curve. (L) Liver weight (n = 6 per group). (M) Liver per body weight ratio (n = 6 per group). (N) Liver TG (n = 12 per group). (O) Plasma ALT (Chrna2fl/fl, n = 15; Chrna2fl/fl;AlbCre, n = 12). (P) Left, HE and Sirius Red staining of liver sections. Scale bars, 50 μm. Representative images are shown. Right, quantification of Sirius Red-positive area (Chrna2fl/fl, n = 8; Chrna2fl/fl;AlbCre, n = 10). (Q) Left, TUNEL staining of liver sections. Scale bars, 50 μm. Representative images are shown. Right, the relative frequencies of TUNEL-positive cells per field (Chrna2fl/fl, n = 8; Chrna2fl/fl;AlbCre, n = 10). (R) Uniform Manifold Approximation and Projection analysis of gene expression profile from liver RNA sequencing (RNA-seq) (Chrna2fl/fl, n = 4; Chrna2fl/fl;AlbCre, n = 3). (S) The relative frequencies of differentially expressed genes from liver RNA-seq (Chrna2fl/fl, n = 4; Chrna2fl/fl;AlbCre, n = 3). (T) Significantly differentially expressed genes in Chrna2fl/fl;AlbCre mice relative to controls (Chrna2fl/fl, n = 4; Chrna2fl/fl;AlbCre, n = 3). (U) The mRNA expression of selected MASH pathogenic genes from RNA-seq (Chrna2fl/fl, n = 4; Chrna2fl/fl;AlbCre, n = 3) and validation using qPCR (Chrna2fl/fl, n = 11; Chrna2fl/fl;AlbCre, n = 13). (V) Biological pathway analysis of up- or down-regulated genes in Chrna2fl/fl;AlbCre mice relative to controls from (R). The data underlying the graphs in this figure can be found in S2 Data. Mean ± SEM. n.d., not detected. *p < 0.05, **p < 0.01, ***p < 0.005 by an unpaired two-sample Student’s t test or Mann–Whitney U test. CHRNA2, cholinergic receptor nicotinic alpha 2 subunit; GTT, glucose tolerance test; HE, hematoxylin-eosin; KO, knockout; MASH, metabolic dysfunction-associated steatohepatitis; WT, wild-type.
Fig 3
Fig 3. The loss of hepatic CHRNA2 signaling increases susceptibility to liver injury.
(A) Schematic diagram illustrating the experimental outline of the development of mouse MASH using HFD feeding combined with carbon tetrachloride (HFD+CCl4) administration. (B) qPCR analyses of Chrna2 expression in liver tissues of WT mice challenged with HFD+CCl4 and with control treatment (Ctrl, n = 9; HFD+CCl4, n = 5). (C) Flow cytometric analyses of the abundance of total cells, Kupffer cells (KCs) and MDMs that express ChAT in liver NPCs from ChATBAC-eGFP mice challenged with HFD+CCl4 or control treatment (Ctrl, n = 6; HFD+CCl4, n = 4). (D–H) Control WT and whole-body Chrna2 KO mice treated with HFD+CCl4. (D) Left, body weight (WT, n = 9; KO, n = 7). Right, liver weight (WT, n = 9; KO, n = 7). (E) Liver per body weight ratio (WT, n = 9; KO, n = 7). (F) Plasma alanine aminotransferase (ALT; WT, n = 10; KO, n = 13). (G) HE and Sirius Red staining of liver sections. Scale bars, 50 μm. Representative images are shown. (H) qPCR analyses of MASH pathogenic genes in livers (WT, n = 10; KO, n = 8). (I–Q) Control Chrna2fl/fl and Chrna2fl/fl;AlbCre mice treated with HFD+CCl4. (I) Left, body weight (n = 6 per group). Right, liver weight (n = 6 per group). (J) Liver per body weight ratio (n = 6 per group). (K) Plasma ALT (Chrna2fl/fl, n = 13; Chrna2fl/fl;AlbCre, n = 8). (L) Left, HE and Sirius Red staining of liver sections. Scale bars, 50 μm. Representative images are shown. Right, quantification of Sirius Red-positive area (Chrna2fl/fl, n = 11; Chrna2fl/fl;AlbCre, n = 13). (M) Left, TUNEL staining of liver sections. Scale bars, 50 μm. Right, the relative frequencies of TUNEL-positive cells per field (Chrna2fl/fl, n = 14; Chrna2fl/fl;AlbCre, n = 12). Representative images are shown. (N) qPCR analyses of MASH pathogenic genes in livers (Chrna2fl/fl, n = 10; Cre, n = 8). (O) Hierarchical (i) and k-means (ii) clustering of hepatic transcriptome assessed with RNA-seq (n = 3 per group). The horizontal distance in (i) indicates similarities among each cluster. (P) The relative frequencies of differentially expressed genes from liver RNA-seq (n = 3 per group). (Q) Biological pathway analysis of up- or down-regulated genes in Chrna2fl/fl;AlbCre mice relative to controls from liver RNA-seq (n = 3 per group). (R) Left, schematic diagram illustrating the generation of macrophage-specific Chat deleted mice by crossing Chatfl/fl with LysMCre mice. Right, qPCR analyses of Chat mRNA expression in isolated liver macrophages (n = 4 per group). (S–W) Control Chatfl/fl and Chatfl/fl;LysMCre mice treated with HFD+CCl4. (S) Left, body weight (Chatfl/fl, n = 7; Chatfl/fl;LysMCre, n = 6). Right, liver weight (Chatfl/fl, n = 7; Chatfl/fl;LysMCre, n = 6). (T) Liver per body weight ratio (Chatfl/fl, n = 7; Chatfl/fl;LysMCre, n = 6). (U) Plasma ALT (Chatfl/fl, n = 7; Chatfl/fl;LysMCre, n = 6). (V) Left, HE and Sirius Red staining of liver sections. Scale bars, 50 μm. Representative images are shown. Right, quantification of Sirius Red-positive area (Chatfl/fl, n = 7; Chatfl/fl;LysMCre, n = 6). (W) qPCR analyses of MASH pathogenic genes in livers (Chatfl/fl, n = 7; Chatfl/fl;LysMCre, n = 6). The data underlying the graphs in this figure can be found in S3 Data. Mean ± SEM. *p < 0.05, **p < 0.01, ***p < 0.005 by an unpaired two-sample Student’s t test or Mann–Whitney U test. ChAT, choline acetyltransferase; CHRNA2, cholinergic receptor nicotinic alpha 2 subunit; HE, hematoxylin-eosin; HFD, high-fat diet; KO, knockout; MASH, metabolic dysfunction-associated steatohepatitis; MDM, monocyte-derived macrophage; NPC, non-parenchymal cell; WT, wild-type.
Fig 4
Fig 4. Pharmacological inhibition of acetylcholine degradation ameliorates MASH phenotypes.
(A) Schematic diagram illustrating the experimental outline. Gubra-Amylin NASH (GAN) diet-fed mice were treated with vehicle (Veh) or rivastigmine (Riva, 1 mg/kg body weight/day) for 2 weeks. (B–J) GAN diet-fed control mice treated with Veh or Riva. (B) Daily food intake (n = 7). (C) GTT (n = 8). AUC, area under the curve. (D) Left, body weight (Veh, n = 21; Riva, n = 26). Right, liver weight (Veh, n = 21; Riva, n = 26). (E) Liver per body weight ratio (Veh, n = 21; Riva, n = 26). (F) Liver triglyceride (TG; Veh, n = 15; Riva, n = 12). (G) Plasma alanine aminotransferase (ALT; Veh, n = 27; Riva, n = 21). (H) HE and Sirius Red staining of liver sections. Scale bar, 50 μm. Representative images are shown. (I) qPCR analyses of MASH pathogenic genes in the liver (Veh, n = 21; Riva, n = 22). (J) Left, iWAT weight (Veh, n = 8; Riva, n = 6). Right, qPCR analyses of adaptive thermogenic genes in iWAT (Veh, n = 8; Riva, n = 6). (K–S) GAN diet-fed liver-specific Chrna2 KO mice treated with Veh or Riva. (K) Daily food intake (n = 16). (L) GTT (Veh, n = 7; Riva, n = 8). AUC, area under the curve. (M) Left, body weight (Veh, n = 15; Riva, n = 14). Right, liver weight (Veh, n = 15; Riva, n = 14). (N) Liver per body weight ratio (Veh, n = 15; Riva, n = 14). (O) Liver TG (Veh, n = 16; Riva, n = 17). (P) Plasma ALT (Veh, n = 27; Riva, n = 39). (Q) HE and Sirius Red staining of liver sections. Scale bars, 50 μm. Representative images are shown. (R) qPCR analyses of MASH pathogenic genes in the liver (Veh, n = 13; Riva, n = 11). (S) iWAT weight (n = 7 per group). Right, qPCR analyses of adaptive thermogenic genes in iWAT (n = 7 per group). (T) A proposed model of CHRNA2-mediated liver-protective effects against MASH. The data underlying the graphs in this figure can be found in S4 Data. Mean ± SEM. n.s., not significant. *p < 0.05, **p < 0.01, ***p < 0.005 by an unpaired two-sample Student’s t test or Mann–Whitney U test. GTT, glucose tolerance test; HE, hematoxylin-eosin; iWAT, inguinal white adipose tissue; MASH, metabolic dysfunction-associated steatohepatitis.

References

    1. Loomba R, Friedman SL, Shulman GI. Mechanisms and disease consequences of nonalcoholic fatty liver disease. Cell. 2021;184(10):2537–2564. doi: 10.1016/j.cell.2021.04.015 . - DOI - PubMed
    1. Lazarus JV, Mark HE, Anstee QM, Arab JP, Batterham RL, Castera L, et al.. Advancing the global public health agenda for NAFLD: a consensus statement. Nat Rev Gastroenterol Hepatol. 2022;19(1):60–78. doi: 10.1038/s41575-021-00523-4 . - DOI - PubMed
    1. Lian J, Fu J. Pioglitazone for NAFLD Patients With Prediabetes or Type 2 Diabetes Mellitus: A Meta-Analysis. Front Endocrinol (Lausanne). 2021;12:615409. Epub 2021/05/18. doi: 10.3389/fendo.2021.615409 ; PubMed Central PMCID: PMC8115121. - DOI - PMC - PubMed
    1. Mantovani A, Petracca G, Beatrice G, Csermely A, Lonardo A, Targher G. Glucagon-Like Peptide-1 Receptor Agonists for Treatment of Nonalcoholic Fatty Liver Disease and Nonalcoholic Steatohepatitis: An Updated Meta-Analysis of Randomized Controlled Trials. Meta. 2021;11(2). Epub 2021/01/31. doi: 10.3390/metabo11020073 ; PubMed Central PMCID: PMC7911747. - DOI - PMC - PubMed
    1. Dufour JF, Anstee QM, Bugianesi E, Harrison S, Loomba R, Paradis V, et al.. Current therapies and new developments in NASH. Gut. 2022;71(10):2123–34. Epub 2022/06/17. doi: 10.1136/gutjnl-2021-326874 ; PubMed Central PMCID: PMC9484366. - DOI - PMC - PubMed