. 2024 Jul 19;10(29):eadl6366.
doi: 10.1126/sciadv.adl6366. Epub 2024 Jul 19.

A fibronectin gradient remodels mixed-phase mesoderm

Affiliations

A fibronectin gradient remodels mixed-phase mesoderm

Min Zhu et al. Sci Adv. .

Abstract

Physical processes ultimately shape tissue during development. Two emerging proposals are that cells migrate toward stiffer tissue (durotaxis) and that the extent of cell rearrangements reflects tissue phase, but it is unclear whether and how these concepts are related. Here, we identify fibronectin-dependent tissue stiffness as a control variable that underlies and unifies these phenomena in vivo. In murine limb bud mesoderm, cells are either caged, move directionally, or intercalate as a function of their location along a stiffness gradient. A modified Landau phase equation that incorporates tissue stiffness accurately predicts cell diffusivity upon loss or gain of fibronectin. Fibronectin is regulated by WNT5A-YAP feedback that controls cell movements, tissue shape, and skeletal pattern. The results identify a key determinant of phase transition and show how fibronectin-dependent directional cell movement emerges in a mixed-phase environment in vivo.


Figures
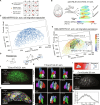
Fig. 1.
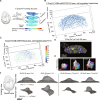
Fig. 1.. Regional cell movements correspond to 3D tissue stiffness map.
(A) Schematic depicting 3D tissue stiffness mapping. (B) Slice views of the 20 somite (som.) stage pCX-NLS:Cre;mTmG limb bud stiffness map (n = 5). (C) H2B-miRFP703 21 som. limb bud 3D mesodermal cell movement trajectories tracked by 3-hour light sheet live imaging. Each dot denotes the last time point of tracking. (D) Schematic defining cell migration persistence. (E) H2B-miRFP703 21 som. limb bud 3D mesodermal cell migration persistence map overlaid with tissue stiffness map. Gray shade represents the volume mesh of effective stiffness value >1.5 × 10⁻³. (F) A representative z-section image of 21 som. T:Cre;mTmG. (G) 3D cell membrane rendering of 21 som. T:Cre;mTmG overlaid with tissue stiffness map. Gray shade represents the volume mesh of effective stiffness value >1.5 × 10⁻³. (H) Time-lapse local cell neighbor renderings within the three zones defined in (G) suggesting caged, directional, and rearranging cell movements. (I) Proposed zonal cell behaviors as a function of tissue stiffness (red shading). (J) A representative z-section of 20 som. endogenous FN reporter (Fn-mScarlet). (K) Relative fibronectin fluorescence intensity profile along anteroposterior axis (average intensity projection of 20 som. Fn-mScarlet forelimb z-stack, n = 5). Gray shading marks the SD. a.u., arbitrary units.
Fig. 2.
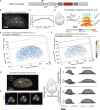
Fig. 2.. Loss of fibronectin down-regulates tissue stiffness and leads to a widespread cell rearrangements.
(A) Slice views of the 20 som. stage T:Cre;Fnf/f;mTmG limb bud stiffness map (n = 3). (B) T:Cre;Fnf/f;H2B-miRFP703 20 som. limb bud 3D mesodermal cell movement trajectories tracked by 3-hour light sheet live imaging. Each dot denotes the last time point of tracking. (C) T:Cre;Fnf/f;H2B-miRFP703 20 som. limb bud 3D mesodermal cell migration persistence map. (D) 3D membranes of T:Cre;Fnf/f;mTmG mesodermal cells rendered from light sheet live imaging. (E) Cell neighbor rearrangements occur within in the normally stiff core [dashed square shown in (D)]. (F) Limb bud shape change from 20 to 25 som. stage of Fnf/+ and T:Cre;Fnf/f embryos reconstructed from optical projection tomography (OPT). Dashed circle indicates the location of the anteriorly biased peak seen in WT (Fnf/+) limb buds.
Fig. 3.
Fig. 3.. Fibronectin overexpression up-regulates tissue stiffness and leads to a broadly caged state.
(A) Conditional Rosa26 fibronectin mScarlet knock-in mouse construct. (B) A representative z-section image of 20 som. FN-overexpression strain (T:Cre;R26-Fn-mScarlet). (C) Relative fibronectin fluorescence intensity profile along anteroposterior axis (average intensity projection of 20 som. T:Cre;R26-Fn-mScarlet forelimb z-stack, n = 3). Gray shading marks the SD. (D) Slice views of the 20 som. stage T:Cre;R26-Fn-mScarlet;mTmG limb bud stiffness map (n = 3). (E) T:Cre;R26-Fn-mScarlet;H2B-miRFP703 20 som. limb bud 3D mesodermal cell movement trajectories tracked by 3-hour light sheet live imaging. Each dot denotes the last time point of tracking. (F) T:Cre;R26-Fn-mScarlet;H2B-miRFP703 20 som. limb bud 3D mesodermal cell migration persistence map. (G) Cell membranes of T:Cre;R26-Fn-mScarlet;mTmG limb bud rendered from live light sheet imaging. (H) Cells maintain neighbor relationships over time, suggesting a caged state. (I) Limb bud shape change from 20 to 25 som. stage of T:Cre;R26-Fn-mScarlet;mTmG embryos.
Fig. 4.
Fig. 4.. Prediction of cell behaviors from tissue stiffness map.
(A) Diffusibility potential as a function of tissue stiffness. P-D, proximal-distal; D-V, dorsal-ventral; A-P, anterior-posterior. (B) H2B-miRFP703 21 som. limb bud 3D mesodermal cell diffusivity map overlaid with tissue stiffness map. Gray shading represents the volume mesh of effective stiffness value >1.5 × 10⁻³. (C) Cell diffusivity as a function of tissue stiffness. (D) T:Cre;Fnf/f;H2B-miRFP703 20 som. limb bud 3D mesodermal cell diffusivity map. (E) T:Cre;R26-Fn-mScarlet;H2B-miRFP703 20 som. limb bud 3D mesodermal cell diffusivity map. (F and G) T:Cre;Fnf/f;H2B-miRFP703 and T:Cre;R26-Fn-mScarlet;H2B-miRFP703 limb bud mesodermal cell diffusivities follow the prediction of the stiffness-phase transition model (two-tailed paired Student’s t test, ****P < 0.0001). n.s, not significant.
Fig. 5.
Fig. 5.. Feedback mechanism involving Wnt5a-YAP-FN.
(A) Transverse sections of 21 som. CD1 embryos at forelimb anterior and posterior regions. Sections were stained with 4′,6-diamidino-2-phenylindole (DAPI; cyan) anti-YAP (green) and anti-fibronectin antibody (red). (B) Relative fibronectin fluorescence intensity versus YAP nuclear/cytoplasmic ratio of 20 to 21 som. CD1 (n = 3) forelimbs. PCC, Pearson correlation coefficient. (C) YAP nuclear/cytoplasmic ratio of 20 to 21 som. CD1 embryos (n = 3) at forelimb anterior and posterior regions (two-tailed unpaired Student’s t test, ****P < 0.0001). (D) Transverse sections of 20 som. T:Cre;Yapf/f;Tazf/+ embryos at forelimb anterior and posterior regions. Sections were stained with DAPI (cyan) anti-YAP (green) and anti-fibronectin antibody (red). (E) Relative fibronectin fluorescence intensity in 20 to 21 som. Yapf/+;Tazf/+ (n = 5) versus T:Cre;Yapf/f;Tazf/+ (n = 3) embryos at forelimb anterior and posterior regions (two-tailed unpaired Student’s t test, **P < 0.01). Error bars indicate SD. (F) Limb bud shape change among T:Cre;Yapf/f;Tazf/+ embryos from 20 to 25 som. stage reconstructed from OPT. (G) Schematic model representing the WNT5A-YAP-FN signaling pathway that establishes tissue stiffness and orchestrates cell movements to drive limb bud shape change. (H) Variations in stiffness gradient geometry correspond to patterns of morphogenetic cell movements in the limb bud (top) and mandibular arch (bottom).

References

    1. Boehm B., Westerberg H., Lesnicar-Pucko G., Raja S., Rautschka M., Cotterell J., Swoger J., Sharpe J., The role of spatially controlled cell proliferation in limb bud morphogenesis. PLOS Biol. 8, e1000420 (2010). - PMC - PubMed
    1. Tao H., Zhu M., Lau K., Whitley O. K. W., Samani M., Xiao X., Chen X. X., Hahn N. A., Liu W., Valencia M., Wu M., Wang X., Fenelon K. D., Pasiliao C. C., Hu D., Wu J., Spring S., Ferguson J., Karuna E. P., Henkelman R. M., Dunn A., Huang H., Ho H. Y. H., Atit R., Goyal S., Sun Y., Hopyan S., Oscillatory cortical forces promote three dimensional cell intercalations that shape the murine mandibular arch. Nat. Commun. 10, 1703 (2019). - PMC - PubMed
    1. Mongera A., Rowghanian P., Gustafson H. J., Shelton E., Kealhofer D. A., Carn E. K., Serwane F., Lucio A. A., Giammona J., Campàs O., A fluid-to-solid jamming transition underlies vertebrate body axis elongation. Nature 561, 401–405 (2018). - PMC - PubMed
    1. Zhu M., Tao H., Samani M., Luo M., Wang X., Hopyan S., Sun Y., Spatial mapping of tissue properties in vivo reveals a 3D stiffness gradient in the mouse limb bud. Proc. Natl. Acad. Sci. U.S.A. 117, 4781–4791 (2020). - PMC - PubMed
    1. Cetera M., Leybova L., Woo F. W., Deans M., Devenport D., Planar cell polarity-dependent and independent functions in the emergence of tissue-scale hair follicle patterns. Dev. Biol. 428, 188–203 (2017). - PMC - PubMed

Publication types

LinkOut - more resources