. 2024 Jul 19;10(29):eadn2339.
doi: 10.1126/sciadv.adn2339. Epub 2024 Jul 19.

Small-molecule probe for IBD risk variant GPR65 I231L alters cytokine signaling networks through positive allosteric modulation

Affiliations

Small-molecule probe for IBD risk variant GPR65 I231L alters cytokine signaling networks through positive allosteric modulation

Ilona Neale et al. Sci Adv. .

Abstract

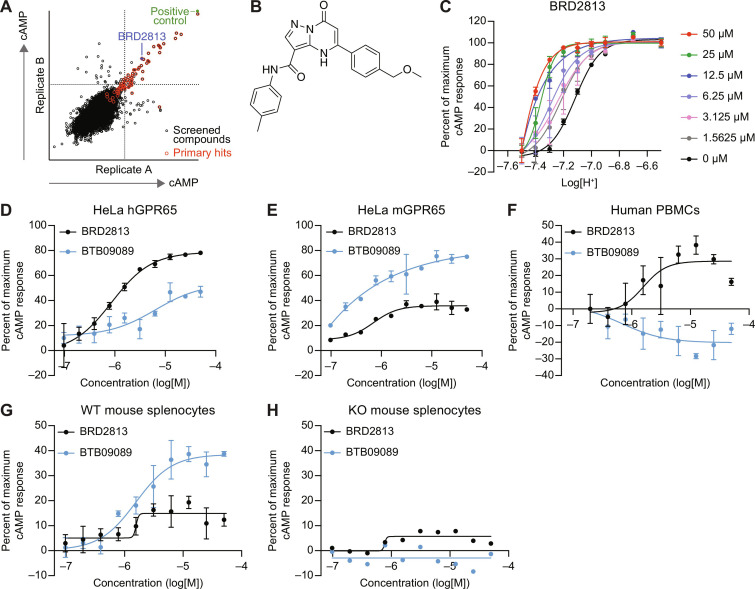
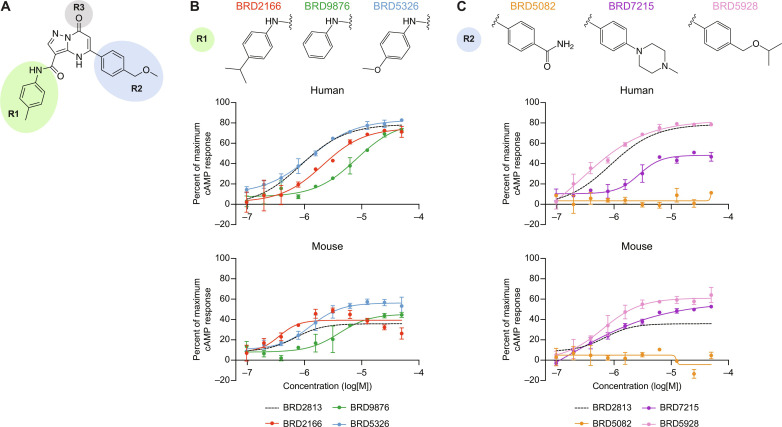
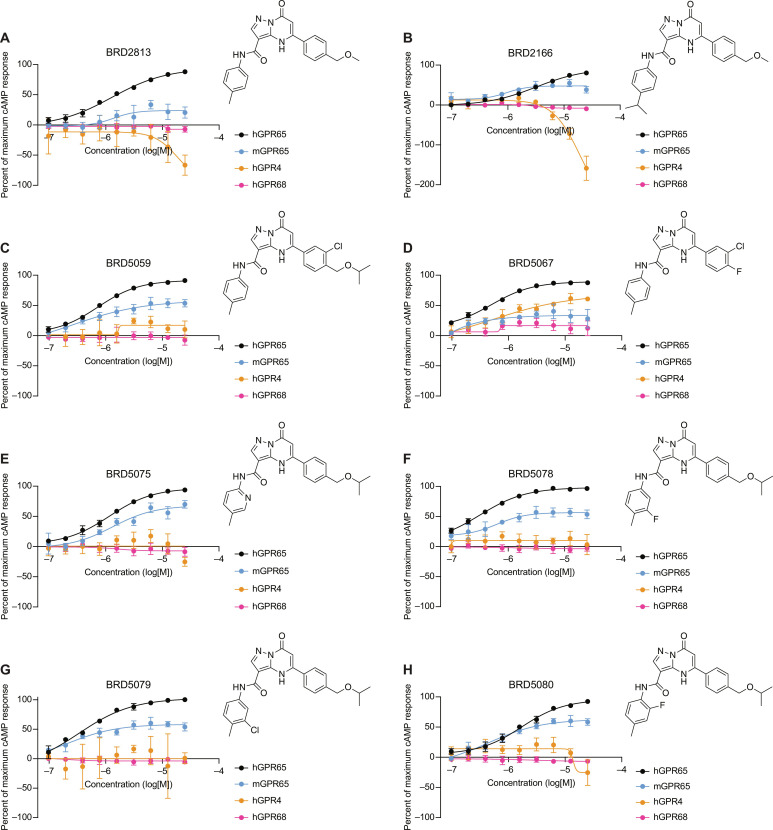
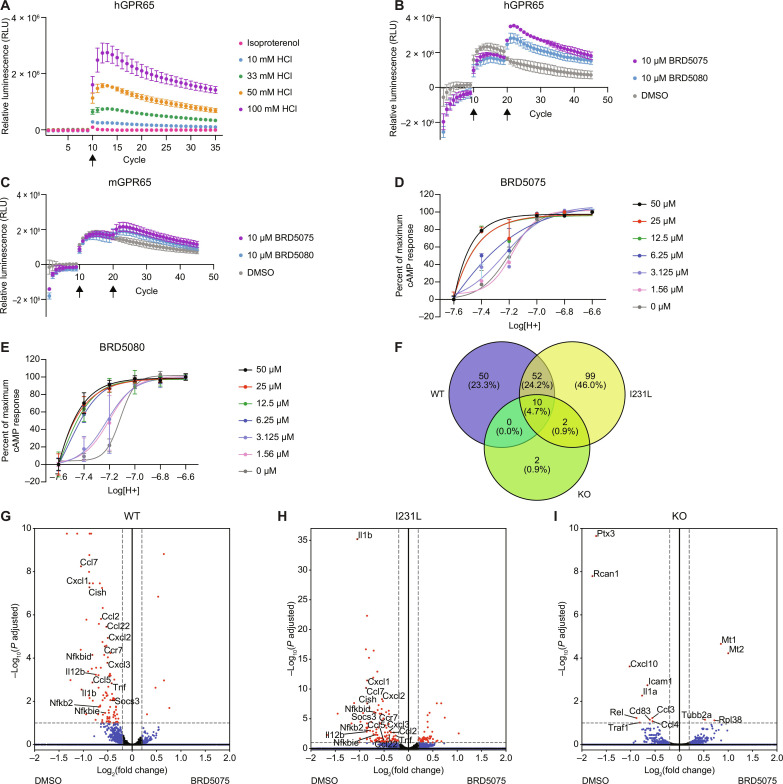
The proton-sensing heterotrimeric guanine nucleotide-binding protein-coupled receptor GPR65 is expressed in immune cells and regulates tissue homeostasis in response to decreased extracellular pH, which occurs in the context of inflammation and tumorigenesis. Genome-wide association studies linked GPR65 to several autoimmune and inflammatory diseases such as multiple sclerosis and inflammatory bowel disease (IBD). The loss-of-function GPR65 I231L IBD risk variant alters cellular metabolism, impairs protective tissue functions, and increases proinflammatory cytokine production. Hypothesizing that a small molecule designed to potentiate GPR65 at subphysiological pH could decrease inflammatory responses, we found positive allosteric modulators of GPR65 that engage and activate both human and mouse orthologs of the receptor. We observed that the chemical probe BRD5075 alters cytokine and chemokine programs in dendritic cells, establishing that immune signaling can be modulated by targeting GPR65. Our investigation offers improved chemical probes to further interrogate the biology of human GPR65 and its clinically relevant genetic variants.


Figures

Fig. 1.
Fig. 1.. BTB09089 and BRD2813 induce species-selective GPR65-dependent cAMP production.
(A) Replicate plot from a high-throughput screen of 21,000 compounds showing relative cAMP production per compound for each of two technical replicates after 30-min stimulation of GPR65 KO HeLa cells reconstituted with hGPR65 at pH 7.1. (B) Chemical structure of BRD2813. (C) pH-dependent cAMP production in the presence of 0 to 50 μM BRD2813, showing positive allosteric modulation behavior. pH curves were normalized to pH 6.6 for maximum response and 7.5 for minimum cAMP response (mean ± SD, n = 2). (D and E) cAMP response after stimulation with 0 to 50 μM BTB09089 or BRD2813 in GPR65 KO HeLa cells reconstituted with (D) hGPR65 and (E) mGPR65 at pH 7.2 (mean ± SD, n = 2). (F) cAMP production in human PBMCs after 30-min stimulation with 0 to 50 μM BTB09089 or BRD2813 at pH 7.2 (mean ± SD, n = 2). (G and H) GPR65-dependent cAMP induction after 30-min stimulation with 0 to 50 μM BTB09089 or BRD2813 in (G) GPR65 WT and (H) GPR65 KO mouse splenocytes at pH 7.2 (mean ± SD, n = 3). The percent of maximum cAMP response was calculated relative to treatment with 100 μM forskolin and dimethyl sulfoxide. Data represent at least two independent experiments.
Fig. 2.
Fig. 2.. SAR study of BRD2813 yields several GPR65-specific analogs that robustly activate both hGPR65 and mGPR65.
(A) Chemical structure of BRD2813 with R groups modified in the SAR study highlighted. (B) Examples of R1 modifications and resulting changes in cAMP production relative to BRD2813 in hGPR65- and mGPR65-expressing HeLa cells at pH 7.2 (mean ± SD, n = 2). (C) Examples of R2 modifications and resulting changes in cAMP production relative to BRD2813 in hGPR65- and mGPR65-expressing HeLa cells at pH 7.2 (mean ± SD, n = 2). The percent of maximum cAMP response was calculated relative to 100 μM forskolin and DMSO. Data represent at least two independent experiments.
Fig. 3.
Fig. 3.. Specificity of prioritized molecules for GPR65.
(A to H) cAMP production in HeLa cells expressing hGPR65, mGPR65, hGPR4, or hGPR68 at pH 7.2 (mean ± SD, n = 3). The percent of maximum cAMP response was normalized to pH 6.6 and DMSO. Data represent at least two independent experiments.
Fig. 4.
Fig. 4.. PAMs BRD5075 and BRD5080 demonstrate target engagement with hGPR65 and mGPR65.
(A) pH-dependent increase in LgBiT-mGs recruitment to hGPR65-SmBiT in Expi293T cells in response to increasing concentrations of HCl added at cycle 10 (mean ± SD, n = 3). (B and C) Increased LgBiT-mGs recruitment with 10 μM BRD5075 or BRD5080 in Expi293T cells expressing (B) hGPR65-SmBiT and (C) mGPR65-SmBiT. pH was decreased at cycle 10 with 25 mM HCl, and compound was added at cycle 20. Data were normalized to cells treated with H2O at cycle 10 followed by DMSO at cycle 20 (mean ± SD, n = 3). (D and E) pH-dependent cAMP production in the presence of 0 to 50 μM (D) BRD5075 and (E) BRD5080, showing positive allosteric modulation of GPR65 in hGPR65-expressing HeLa cells. pH curves were normalized to pH 6.6 for maximum response and 7.6 for minimum (mean ± SD, n = 4). Data represent at least two independent experiments. (F) Venn diagram of significant DEGs in BMDCs isolated from WT, I231L, and KO mice treated with BRD5075 compared to DMSO at pH 7.2 (n = 3 technical replicates, one mouse per genotype). (G to I) Differential expression of genes in (G) WT, (H) I231L, and (I) KO BMDCs treated with BRD5075 compared to DMSO at pH 7.2. Red dots are significant DEGs defined by Padj < 0.1 and log2(fold change) > |0.2|. Blue dots indicate DEGs that meet the threshold for fold change but not significance. Green dots indicate significant DEGs that do not meet the threshold for fold change. Black dots are DEGs that do not meet either threshold. 1 cycle = 90 s.

References

    1. Nelson M. R., Tipney H., Painter J. L., Shen J., Nicoletti P., Shen Y., Floratos A., Sham P. C., Li M. J., Wang J., Cardon L. R., Whittaker J. C., Sanseau P., The support of human genetic evidence for approved drug indications. Nat. Genet. 47, 856–860 (2015). - PubMed
    1. Sadler M. C., Auwerx C., Deelen P., Kutalik Z., Multi-layered genetic approaches to identify approved drug targets. Cell Genom. 3, 100341 (2023). - PMC - PubMed
    1. Kong L., Pokatayev V., Lefkovith A., Carter G. T., Creasey E. A., Krishna C., Subramanian S., Kochar B., Ashenberg O., Lau H., Ananthakrishnan A. N., Graham D. B., Deguine J., Xavier R. J., The landscape of immune dysregulation in Crohn’s disease revealed through single-cell transcriptomic profiling in the ileum and colon. Immunity 56, 444–458.e5 (2023). - PMC - PubMed
    1. Smillie C. S., Biton M., Ordovas-Montanes J., Sullivan K. M., Burgin G., Graham D. B., Herbst R. H., Rogel N., Slyper M., Waldman J., Sud M., Andrews E., Velonias G., Haber A. L., Jagadeesh K., Vickovic S., Yao J., Stevens C., Dionne D., Nguyen L. T., Villani A.-C., Hofree M., Creasey E. A., Huang H., Rozenblatt-Rosen O., Garber J. J., Khalili H., Desch A. N., Daly M. J., Ananthakrishnan A. N., Shalek A. K., Xavier R. J., Regev A., Intra- and inter-cellular rewiring of the human colon during ulcerative colitis. Cell 178, 714–730.e22 (2019). - PMC - PubMed
    1. Rowe J. B., Kapolka N. J., Taghon G. J., Morgan W. M., Isom D. G., The evolution and mechanism of GPCR proton sensing. J. Biol. Chem. 296, 100167 (2021). - PMC - PubMed

Publication types