. 2024 Sep:75:103255.
doi: 10.1016/j.redox.2024.103255. Epub 2024 Jun 24.

Inhibition of ferroptosis rescues M2 macrophages and alleviates arthritis by suppressing the HMGB1/TLR4/STAT3 axis in M1 macrophages

Affiliations

Inhibition of ferroptosis rescues M2 macrophages and alleviates arthritis by suppressing the HMGB1/TLR4/STAT3 axis in M1 macrophages

Zhuan Feng et al. Redox Biol. 2024 Sep.

Abstract

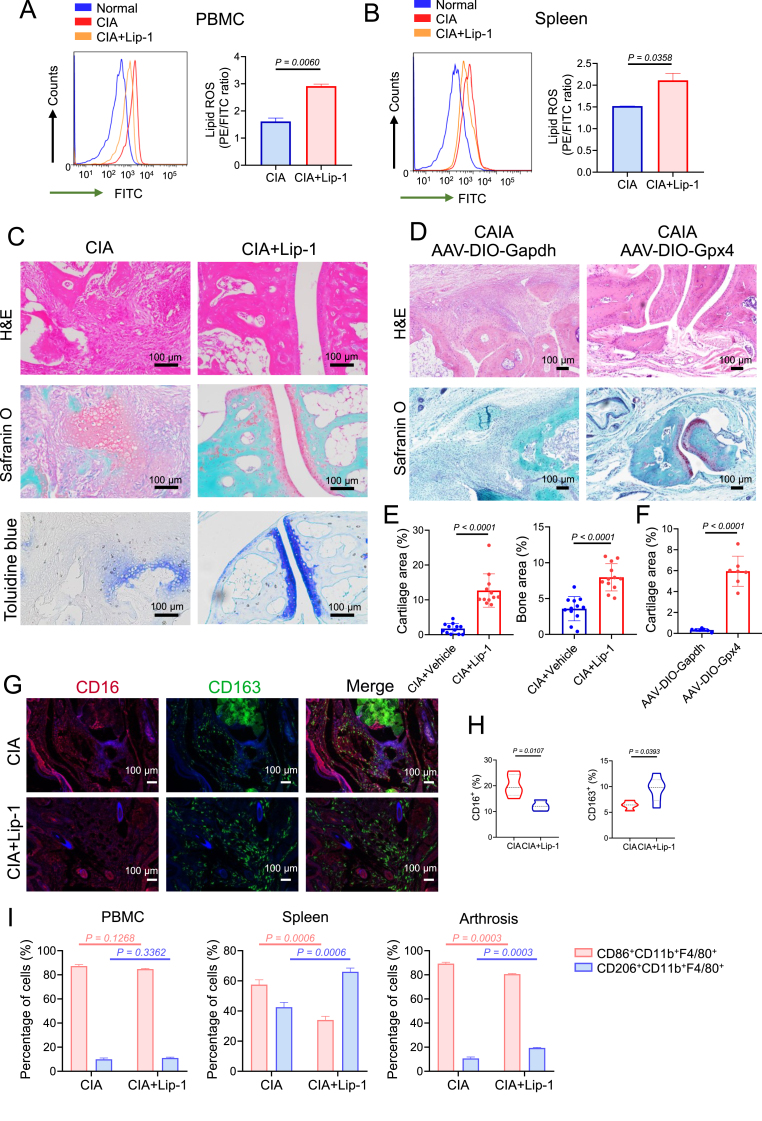
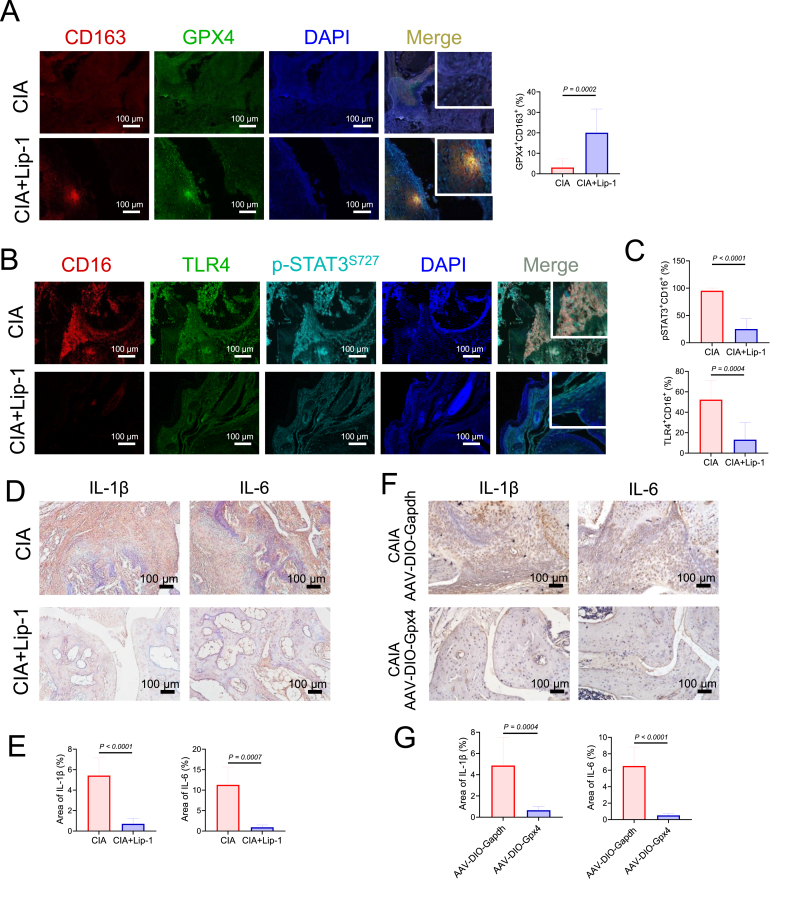
Ferroptosis is a type of programmed cell death driven by iron-dependent lipid peroxidation. The TNF-mediated biosynthesis of glutathione has been shown to protect synovial fibroblasts from ferroptosis in the hyperplastic synovium. Ferroptosis induction provides a novel therapeutic approach for rheumatoid arthritis (RA) by reducing the population of synovial fibroblasts. The beginning and maintenance of synovitis in RA are significantly influenced by macrophages, as they generate cytokines that promote inflammation and contribute to the destruction of cartilage and bone. However, the vulnerability of macrophages to ferroptosis in RA remains unclear. In this study, we found that M2 macrophages are more vulnerable to ferroptosis than M1 macrophages in the environment of the arthritis synovium with a high level of iron, leading to an imbalance in the M1/M2 ratio. During ferroptosis, HMGB1 released by M2 macrophages interacts with TLR4 on M1 macrophages, which in turn triggers the activation of STAT3 signaling in M1 macrophages and contributes to the inflammatory response. Knockdown of TLR4 decreased the level of cytokines induced by HMGB1 in M1 macrophages. The ferroptosis inhibitor liproxstatin-1 (Lip-1) started at the presymptomatic stage in collagen-induced arthritis (CIA) model mice, and GPX4 overexpression in M2 macrophages at the onset of collagen antibody-induced arthritis (CAIA) protected M2 macrophages from ferroptotic cell death and significantly prevented the development of joint inflammation and destruction. Thus, our study demonstrated that M2 macrophages are vulnerable to ferroptosis in the microenvironment of the hyperplastic synovium and revealed that the HMGB1/TLR4/STAT3 axis is critical for the ability of ferroptotic M2 macrophages to contribute to the exacerbation of synovial inflammation in RA. Our findings provide novel insight into the progression and treatment of RA.

Keywords: Ferroptosis; Macrophage; Rheumatoid arthritis.


Conflict of interest statement

Declaration of competing interest The authors have no conflict of interest relevant to this study to declare.

Figures

Image 1
Graphical abstract
Fig. 1
Fig. 1
The enrichment of macrophages in the synovium of RA patients and arthritis mice. (A) Schematic diagram for the establishment of a CIA mice model. Joint inflammation was measured by arthritis score (B) and paw thickness (C) in CIA mice, n = 3 mice for both control and CIA group. D Images of hematoxylin and eosin (H&E), toluidine blue, and safranin O staining of representative joints from control and CIA mice. Scale bars, 100 μm. E Quantification of the histomorphometric analysis of cartilage damage and bone erosion. F Representative immunohistochemical staining of RANKL and M-CSF in the inflamed joint tissue of CIA model mice. G Quantitative comparison of RANKL and M-CSF between normal and CIA model mice, with n = 6 joints for the control group and n = 9 mice for the CIA group. H mIHC staining of macrophage markers (human: CD68; mice: F4/80) in the synovium. Scale bars, 100 μm. I Quantification of the percentages of macrophage markers in hyperplastic synovium. Data are presented as mean ± SD. (For interpretation of the references to colour in this figure legend, the reader is referred to the Web version of this article.)
Fig. 2
Fig. 2
CD16lowCD64lowCD163highMRC1high macrophage subset may undergo ferroptosis in the progression of RA according to bioanalysis. A t-SNE plot displaying 56396 cells from the synovium of 5 RA patients separated into 10 major cell types, including fibroblast, macrophage-monocytes, monocytes, endothelial cells, T cells, B cells, pericytes, MSC and dendritic cell. B Predicted monocytes and macrophages subsets based on the expression levels of CD16, CD64, CD163 and MRC1 (M1 macrophages: CD16highCD64highCD163lowMRC1low; M2 macrophages: CD16lowCD64lowCD163highMRC1high). C Enrichment analysis showing the 20 most significantly changed pathways in M2 macrophages, with red indicating pathways of interest. D Expression of four ferroptosis relevant genes: TFRC, ACSL4, HMOX1, and SLC40A1 in M1 macrophages and M2 macrophages subsets from RA subjects. E Lollipop plots of TFRC, SLC40A1, ACSL1, ACSL1, ACSL3, and HMOX1 expression in M2 subset compared with M1 subset from RA subjects. Immunohistochemical staining (F) and analysis (G) of CD16 and CD163 in the synovium of control and CIA mice (control group: n = 5; CIA group: n = 6). Data are presented as mean ± SD. (For interpretation of the references to colour in this figure legend, the reader is referred to the Web version of this article.)
Fig. 3
Fig. 3
M2 macrophages demonstrated greater sensitivity to ferroptosis compared to M1 macrophages polarized from THP-1 cells. A Gating strategy for differentially polarized THP-1 cells, with representative dot plots showing forward scatter (FSC) and side scatter (SSC) properties of M0 macrophages and measurement of CD11b protein expression via flow cytometry. B THP-1 cells were pretreated with 100 ng/mL of PMA for 72 h and incubated with LPS (100 ng/mL) and IFN-γ (20 ng/mL) or IL-4 (20 ng/mL) and IL-13 (20 ng/mL) for 48 h, with CD86 (M1) and CD206 (M2) expression levels measured via flow cytometry. C Cell death ratio were detected in M0, M1 and M2 macrophages derived from THP-1 cells with RSL-3 (0.75 μM, 5 h) treatment in the presence or absence of the ferroptosis inhibitor Fer-1 (1 μM). D Cell viability was assayed by measuring cellular ATP levels 5 h after RSL-3 treatment in the presence or absence of Fer-1. E Lipid ROS was measured by PE/FITC ratio by flow cytometry. F Ferroptosis related proteins GPX4, PTGS2, TFRC and ACSL4 were determined by western blotting in M1 and M2 macrophages polarized from THP-1 cells 5 h after RSL-3 treatment in the presence or absence of Fer-1, with quantification of GPX4 gray value normalized to GAPDH shown in G. H GPX4, PTGS2, TFRC and ACSL4 were determined by western blotting in M1 and M2 macrophages 7 h after RSL-3 treatment, with quantification of PTGS2 and TFRC gray value normalized to GAPDH shown in I. J Concentration of HMGB1 in the culture supernatant of M1 and M2 macrophages treated with RSL-3 (0.75 μM, 10 h) in the presence or absence of Fer-1. Values are shown as the means ± SD.
Fig. 4
Fig. 4
HMGB1 secreted by RSL-3-stimulated M2 macrophages promoted the production of inflammatory cytokines in M1 macrophages. A Schematic diagram for constructing an indirect co-culture system of M2 and M1 macrophages. B Left, western blotting analysis of phospho-STAT3S727, phospho-STAT3Y705 and STAT3 expression in M1 macrophages cultured for 6 h with M2 macrophage supernatant treated with RSL-3 (0.75 μM, 10 h). GAPDH was used as the loading control. Right, quantification of phospho-STAT3S727/STAT gray value. C Left, western blotting of TLR4 and TLR2 expression in M1 macrophages cultured for 36 h with M2 macrophages supernatant treated with RSL-3 (0.75 μM, 10 h). Right, quantification of TLR4/GAPDH gray value. D Western blotting analysis of phospho-STAT3S727 and STAT3 expression in M1 macrophages cultured with the supernatant of RSL-3-treated M2 macrophages (RSL-3, 0.75 μM, 10 h) and exposure to HMGB1-specific blocking antibody in the presence or absence of the TLR4 inhibitor TAK-242 for 6 h. E Western blotting of IL-1β, IL-6, and IL-17A expression in M1 macrophages cultured for 6 h with M2 macrophages supernatant treated with RSL-3 (0.75 μM, 10 h). F Western blotting of IL-1β, IL-6, IL-17A and TNF-α expression in M1 macrophages cultured for 36 h with M2 macrophages supernatant treated with RSL-3 (0.75 μM, 10 h). G mRNA levels of inflammatory cytokines including IL-1β, IL-6, IL-17A, IL-15, IL-18, TNF-α and IFN-γ in M1 macrophages cultured with M2 macrophages supernatant treated with RSL-3. H Western blotting analysis of TLR4 expression in THP-1 cells transfected with scramble siRNA or one of three independent siRNAs targeting TLR4 (siTLR4#1, siTLR4#2, siTLR4#3). I Western blotting analysis of phospho-STAT3S727, STAT3, and IL-1β expression in M1 macrophages transfected with scramble siRNA or siRNA targeting TLR4 and cultured for 36 h with M2 macrophages supernatant treated with RSL-3 (0.75 μM, 10 h). J Western blotting analysis of phospho-STAT3S727, STAT3, and IL-1β expression in M1 macrophages transfected with scramble siRNA or siRNA targeting TLR4 and treated with HMGB1 protein (5 μg/mL) for 48 h. Values are shown as the means ± SD.
Fig. 5
Fig. 5
GPX4 overexpression or ferroptosis inhibitor Lip-1 treatment started at the pre-symptomatic stages alleviated arthritis symptoms of CIA mice. A Flow cytometric analysis (left) of PBMC cells for FITC fluorescence and analysis of lipid peroxidation (right) from CIA mice with or without Lip-1 administration. B Flow cytometric analysis of spleen cells (left) for FITC fluorescence and analysis of lipid peroxidation (right). C Images of H&E, safranin O, and toluidine blue staining of representative joints in CIA mice with or without Lip-1 treatment on day 25 after treatment initiation. Scale bars, 100 μm. D Images of H&E, safranin O, and toluidine blue staining of representative joints in control and CAIA mice with or without AAV-DIO-Gpx4 treatment. Scale bars, 100 μm. E Quantification of the histo-morphometric analysis of cartilage damage and bone erosion with n = 12 joints for both CIA and CIA + Lip-1 group. Data are presented as mean ± SD. F Quantification of the histo-morphometric analysis of CAIA mice cartilage damage, with n = 7 joints for both AAV-DIO-Gapdh and AAV-DIO-Gpx4 groups. Data are presented as mean ± SD. G Representative mIHC staining of inflamed joints of CIA mice treated with Lip-1 (10 mg/kg) and labeled with anti-CD16, anti-CD163 and DAPI. Similar results were observed from 8 joints tested for each group. Scale bars, 100 μm. H Quantification of the percentages of macrophage markers (M1: CD16; M2: CD163) in hyperplastic synovium. I The percentages of CD86+ subset and CD206+ subset in CD11b+F4/80+ macrophages from Lip-1 treated or untreated mice on day 39 was analyzed by flow cytometry, with n = 3 mice for each group. Data are presented as mean ± SD. (For interpretation of the references to colour in this figure legend, the reader is referred to the Web version of this article.)
Fig. 6
Fig. 6
GPX4 overexpression or ferroptosis inhibitor Lip-1 treatment ameliorate arthritis progression by protecting M2 macrophages from ferroptosis and decreasing the levels of IL-1β and IL-6. A Representative mIHC staining of inflamed joints labeled with anti-CD163, anti-GPX4 and DAPI. Scale bars, 100 μm. B Representative fluorescent mIHC staining of joints labeled with anti-CD16, anti-TLR4, anti-phophoSTAT3S727 and DAPI. Scale bars, 100 μm. C Quantification of the percentages of TLR4+ CD16+ and p-STAT3+CD16+ cells by calculating the immunofluorescence using inForm software cell analysis. D Immunohistochemical staining of IL-1β and IL-6 from Lip-1 treated or untreated mice on day 39 (n = 8). Scale bars, 100 μm. E Quantification of the histomorphometric analysis of the expression of IL-1β and IL-6 in D. F Immunohistochemical staining of IL-1β and IL-6 from AAV-DIO-Gapdh or AAV-DIO-Gpx4 treatment treated mice (n = 3). Scale bars, 100 μm. G Quantification of the histomorphometric analysis of the expression of IL-1β and IL-6 in F. Data are presented as mean ± SD.

References

    1. Chauhan K., Jandu J.S., Brent L.H., Al-Dhahir M.A. StatPearls. 2024. - PubMed
    1. Arango Duque G., Descoteaux A. Macrophage cytokines: involvement in immunity and infectious diseases. Front. Immunol. 2014;5:491. doi: 10.3389/fimmu.2014.00491. - DOI - PMC - PubMed
    1. Shapouri-Moghaddam A., et al. Macrophage plasticity, polarization, and function in health and disease. J. Cell. Physiol. 2018;233:6425–6440. doi: 10.1002/jcp.26429. - DOI - PubMed
    1. Cutolo M., Campitiello R., Gotelli E., Soldano S. The role of M1/M2 macrophage polarization in rheumatoid arthritis synovitis. Front. Immunol. 2022;13 doi: 10.3389/fimmu.2022.867260. - DOI - PMC - PubMed
    1. Zizzo G., Hilliard B.A., Monestier M., Cohen P.L. Efficient clearance of early apoptotic cells by human macrophages requires M2c polarization and MerTK induction. J. Immunol. 2012;189:3508–3520. doi: 10.4049/jimmunol.1200662. - DOI - PMC - PubMed

MeSH terms

LinkOut - more resources