. 2024 Aug 12;42(8):1336-1351.e9.
doi: 10.1016/j.ccell.2024.06.006. Epub 2024 Jul 18.

Targeting the mSWI/SNF complex in POU2F-POU2AF transcription factor-driven malignancies

Affiliations

Targeting the mSWI/SNF complex in POU2F-POU2AF transcription factor-driven malignancies

Tongchen He et al. Cancer Cell. .

Abstract

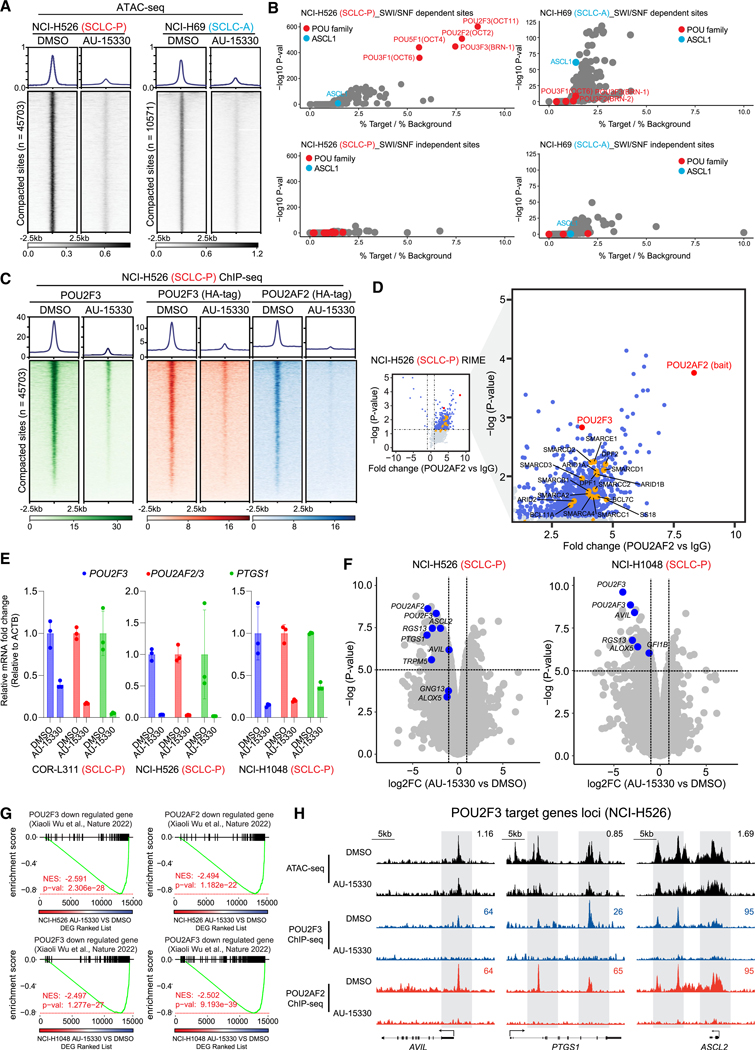
The POU2F3-POU2AF2/3 transcription factor complex is the master regulator of the tuft cell lineage and tuft cell-like small cell lung cancer (SCLC). Here, we identify a specific dependence of the POU2F3 molecular subtype of SCLC (SCLC-P) on the activity of the mammalian switch/sucrose non-fermentable (mSWI/SNF) chromatin remodeling complex. Treatment of SCLC-P cells with a proteolysis targeting chimera (PROTAC) degrader of mSWI/SNF ATPases evicts POU2F3 and its coactivators from chromatin and attenuates downstream signaling. B cell malignancies which are dependent on the POU2F1/2 cofactor, POU2AF1, are also sensitive to mSWI/SNF ATPase degraders, with treatment leading to chromatin eviction of POU2AF1 and IRF4 and decreased IRF4 signaling in multiple myeloma cells. An orally bioavailable mSWI/SNF ATPase degrader significantly inhibits tumor growth in preclinical models of SCLC-P and multiple myeloma without signs of toxicity. This study suggests that POU2F-POU2AF-driven malignancies have an intrinsic dependence on the mSWI/SNF complex, representing a therapeutic vulnerability.

Keywords: IRF4; POU2AF1/2/3; POU2F3; PROTAC; SCLC; SMARCA2/4; mSWI/SNF complex; multiple myeloma; proteolysis targeting chimera; small cell lung cancer.


Conflict of interest statement

Declaration of interests A.M.C. serves on the clinical advisory board of Aurigene Oncology Limited. C.A., S.S., and M.R. are employees of Aurigene Oncology Limited. C.R.V. has received consulting fees from Flare Therapeutics, Roivant Sciences, and C4 Therapeutics; he has served on the advisory boards of KSQ Therapeutics, Syros Pharmaceuticals, and Treeline Biosciences. C.R.V. has also received research funding from Boehringer-Ingelheim and Treeline Biosciences and owns stock in Treeline Biosciences. Aurigene Oncology Limited has filed patent applications on AU-15330 and AU-24118. C.M.R. has consulted regarding oncology drug development with AbbVie, Amgen, Astra Zeneca, D2G, Daiichi Sankyo, Epizyme, Genentech/Roche, Ipsen, Jazz, Kowa, Lilly, Merck, and Syros. C.M.R. serves on the scientific advisory boards of Auron, Bridge Medicines, DISCO, Earli, and Harpoon Therapeutics.

Figures

Figure 1.
Figure 1.. Dependence of SCLC-P cells on the mSWI/SNF complex
(A) A schematic representation of the dual-sgRNA, domain-focused CRISPR screening designed to identify druggable epigenetic targets selective for SCLC subtypes. (B) Beta scores pertaining to all CRISPR screen targeted genes across both SCLC-P and SCLC-A cell lines (n = 5,308). (C) Beta scores highlighting epigenetic regulators in SCLC-P and SCLC-A cell lines (n = 3292). (D) Percentage of different epigenetic complexes in SCLC-P and SCLC-A cell lines (top 10% for each). PRC1, polycomb repressive complex 1; PRC2, polycomb repressive complex 2; HDAC, histone deacetylase; TET, ten-eleven translocation family proteins. (E) Immunoblot analysis of indicated proteins in SCLC-P and SCLC-A cells post-treatment with varying time points or concentrations of AU-15330. Vinculin serves as the control for protein loading in all immunoblots. (F) Compilation of the IC50 values for AU-15330 in SCLC cell lines representing four molecular subtypes. See also Figure S1 and Table S1.
Figure 2.
Figure 2.. The POU2F3 transcription factor complex is evicted from chromatin in SCLC-P cells upon mSWI/SNF ATPase degradation
(A) Visualization of ATAC-seq read-density in NCI-H526 (SCLC-P) and NCI-H69 (SCLC-A) cells post-treatment for 4 h with either vehicle or 1 μM AU-15330 (n =2 biological replicates). (B) Analysis of fold change and significance level for HOMER motifs that are enriched within sites dependent and independent of the mSWI/SNF complex in NCI-H526 and NCI-H69 cells. (C) ChIP-seq read-density heatmaps representing POU2F3 (green), HA-POU2F3 (red), and HA-POU2AF2 (blue) at AU-15330-loss genomic sites in NCI-H526 cells following treatment with DMSO or AU-15330. (D) Volcano plot detailing proteins that interact with POU2AF2, as identified by POU2AF2 RIME analysis in NCI-H526 cells. mSWI/SNF components highlighted in orange (n = 3 biological replicates). (E) Expression levels of POU2F3, POU2AF2/3, and PTGS1 as assessed by QPCR (normalized to ACTB) in the indicated cell lines after being treated for 12 h with vehicle or 1 μM AU-15330. Data are presented as mean ± SD (n = 3 biological replicates). (F) Volcano plot visualizing the overall transcriptomic alterations as assessed by RNA-seq in NCI-H526 and NCI-H1048 cells post-treatment for 12 h with vehicle or 1 μM AU-15330. Canonical POU2F3 target genes are highlighted in blue (n = 2 biological replicates). (G) GSEA plots illustrating genes regulated by POU2F3 and its coactivators POU2AF2 and POU2AF3. The plots employ a gene signature ranked by fold change in AU-15330-treated NCI-H526 and NCI-1048 cells. DEG, differentially expressed gene. (H) Combined ATAC-seq and ChIP-seq tracks for AVIL, PTGS1, and ASCL2 in NCI-H526 with and without AU-15330 treatment. See also Figures S1–S3 and Table S1.
Figure 3.
Figure 3.. Selective inhibition of SCLC-P xenograft tumor models employing an orally bioavailable mSWI/SNF ATPase degrader
(A) Overview of the AU-24118 efficacy study conducted using SCLC xenograft models. (B) Analysis of tumor volume in indicated SCLC xenograft models upon treatment with AU-24118, measured bi-weekly using calipers. Statistical analysis was performed using a two-way ANOVA. Data are presented as mean ± SEM. (C) Immunoblots illustrating levels of the indicated proteins in SCLC-P and SCLC-A xenografts after 5 days of AU-24118 administration. Vinculin is utilized as the loading control across immunoblots. CDX, cell line-derived xenograft. (D) Representative H&E staining with corresponding IHC analyses for SMARCA4, POU2F3, and DCLK1 after 5 days of treatment with AU-24118 in NCI-H526 xenografts (scale, 50 mm). The inset scale, 20 μm. (E) (left) Representative DAPI and TUNEL staining from xenografts from indicated cell lines after 5 days of AU-24118 treatment (scale, 100 μm). (right) Quantitative evaluation of TUNEL staining of respective SCLC xenografts for 5 days. t tests were used to calculate the significance. p value < 0.05 in the top panel. The whiskers extend from the minimum to the maximum values, indicating the full range of the data. The middle line represents the median of the data. The box spans from the first quartile (Q1, 25th percentile) to the third quartile (Q3, 75th percentile), representing the interquartile range (IQR). (F) Analysis of tumor volume in Lx1322 patient-derived xenograft (PDX) model upon treatment with AU-24118, measured bi-weekly using calipers. Statistical analysis was performed using a two-way ANOVA. Data are presented as mean ± SEM. (G) Representative H&E staining with corresponding IHC analyses for SMARCA4 after 5 days of treatment with AU-24118 in Lx1322 PDX (scale, 50 mm). The inset scale, 20 μm. (H) DCLK1 cell positivity in lung and small intestine for endpoint evaluation. AU-24118 (15 mg/kg) dosed. Ns, not significant (t tests). The whiskers extend from the minimum to the maximum values, indicating the full range of the data. The middle line represents the median of the data. The box spans from the first quartile (Q1, 25th percentile) to the third quartile (Q3, 75th percentile), representing the interquartile range (IQR). See also Figures S3 and S4.
Figure 4.
Figure 4.. POU2AF1-driven multiple myeloma is dependent on the mSWI/SNF complex
(A) Scatterplot depicting gene dependency difference of all plasma cell myeloma versus other cancer types (left) and all B cell malignancies versus other cancer types (right) based on DepMap. The red circles indicate the top 5 essential genes among others. (B) Representative hematological cancer cell lines showing dose-response curves of AU-15330 at varying concentrations for five days. Sensitive cell lines are in red while relatively resistant cell lines are in blue. Data are presented as mean ± SD (n = 6). (C) ATAC-seq read-density heatmaps from MM1.S cells treated with DMSO or 1 μM AU-15330 for 4 h (n = 2 biological replicates). (D) Analysis of fold change and significance level for HOMER motifs that are enriched within sites dependent and independent of the mSWI/SNF complex after 4 h AU-15330 treatment in MM1.S cells (left panels) and NCI-H929 cells (right panels). (E) Scatterplot showing the dependency scores for IRF4/POU2AF1 in diffuse large B cell lymphoma (blue), multiple myeloma (red), and other cancer types based on DepMap dataset. (F) ChIP-seq read-density heat maps for POU2AF1 and IRF4 at the AU-15330-loss genomic sites in MM1.S cells after treatment with DMSO or AU-15330 (1 μM) for 6 h. (G) Volcano plot detailing proteins that interact with POU2AF1, as identified by POU2AF1 RIME analysis in MM1.S cells. mSWI/SNF components highlighted in orange (n = 3 biological replicates). (H) Co-immunoprecipitation (IP) of POU2AF1 or IRF4 in MM1.S cells followed by immunoblot for POU2AF1 and IRF4. This experiment was repeated independently twice. (I) GSEA plots illustrating genes regulated by IRF4. The plots use a gene signature ranked by fold change from AU-15330 treated NCI-H929 (top) and MM1.S (bottom) cells. (J) Combined ATAC-seq and ChIP-seq tracks for c-MYC locus in MM1.S cells with and without AU-15330 treatment. See also Figure S5.
Figure 5.
Figure 5.. Potent tumor inhibition is induced by mSWI/SNF ATPase degraders in various preclinical multiple myeloma models
(A) Analysis of tumor volumes in the MM1.S xenograft model upon treatment with AU-24118 and pomalidomide, measured bi-weekly using calipers. Statistical analysis was performed using a two-way ANOVA. Data are presented as mean ± SEM. (B) Waterfall plot depicting change in tumor volume at the study endpoint for MM1.S-derived xenograft models. (C) Immunoblot illustrating levels of the indicated proteins in MM1.S xenografts after AU-24118 treatment for 5 days. Vinculin is utilized as the loading control. (D) Representative H&E staining with corresponding IHC analyses for SMARCA4 and c-MYC after 5 days of the indicated treatment in MM1.S xenografts (scale, 50 mm). The inset scale, 20 μm. (E) Overview of the MM1.S multiple myeloma disseminated xenograft model efficacy study. (F) Bioluminescent images of MM1.S disseminated xenograft model after different treatments. Mice were monitored once per week. The signal intensity of bioluminescence represented the tumor burden (x108 photons/sec/cm2/steradian). Pomalidomide (10 mg/kg) and AU-24118 (15 mg/kg) dosed. (G) Kaplan-Meier survival curve of MM1.S disseminated xenograft model after pomalidomide (10 mg/kg) and AU-24118 (15 mg/kg) treatment. (H) Representative DAPI and TUNEL staining from the MM1.S disseminated xenograft model and quantitative evaluation from TUNEL staining for pomalidomide (10 mg/kg) and AU-24118 (15 mg/kg) treatment for 12 days. The whiskers extend from the minimum to the maximum values, indicating the full range of the data. The middle line represents the median of the data. The box spans from the first quartile (Q1, 25th percentile) to the third quartile (Q3, 75th percentile), representing the interquartile range (IQR). (I) Representative H&E and CD38 IHC staining of spinal vertebral marrow after in vivo administration of pomalidomide (10 mg/kg) and AU-24118 (15 mg/kg) for 12 days. (J) Quantification of flow cytometry measuring apoptosis signal in DMSO, 24 h or 48 h with 1 μM AU-15330 in CD138 positive cells (top) or CD138 negative cells (bottom) in fresh plasma cell leukemia (PCL) patient cells. The same patient (3095) bulk cell population data was used in Figure S7A. t tests were used to calculate the significance. Data are presented as mean ± SD (n = 3). See also Figures S6 and S7.

Update of

Similar articles

Cited by

References

    1. Kalemkerian GP, Akerley W, Bogner P, Borghaei H, Chow LQ, Downey RJ, Gandhi L, Ganti AKP, Govindan R, Grecula JC, et al. (2013). Small cell lung cancer. J. Natl. Compr. Canc. Netw 11, 78–98. 10.6004/jnccn.2013.0011. - DOI - PMC - PubMed
    1. Rudin CM, Brambilla E, Faivre-Finn C, and Sage J. (2021). Small-cell lung cancer. Nat. Rev. Dis. Primers 7, 3. 10.1038/s41572-020-00235-0. - DOI - PMC - PubMed
    1. Nicholson AG, Chansky K, Crowley J, Beyruti R, Kubota K, Turrisi A, Eberhardt WEE, van Meerbeeck J, and Rami-Porta R; Staging and Prognostic Factors Committee Advisory Boards and Participating Institutions (2016). The International Association for the Study of Lung Cancer Lung Cancer Staging Project: Proposals for the Revision of the Clinical and Pathologic Staging of Small Cell Lung Cancer in the Forthcoming Eighth Edition of the TNM Classification for Lung Cancer. J. Thorac. Oncol 11, 300–311. 10.1016/j.jtho.2015.10.008. - DOI - PubMed
    1. Horn L, Mansfield AS, Szczę sna A, Havel L, Krzakowski M, Hochmair MJ, Huemer F, Losonczy G, Johnson ML, Nishio M, et al. (2018). First-Line Atezolizumab plus Chemotherapy in Extensive-Stage Small-Cell Lung Cancer. N. Engl. J. Med 379, 2220–2229. 10.1056/NEJMoa1809064. - DOI - PubMed
    1. George J, Lim JS, Jang SJ, Cun Y, Ozretić L, Kong G, Leenders F, Lu X, Ferná ndez-Cuesta L, Bosco G, et al. (2015). Comprehensive genomic profiles of small cell lung cancer. Nature 524, 47–53. 10.1038/nature14664. - DOI - PMC - PubMed

MeSH terms

Substances

LinkOut - more resources