. 2024 Jul 18;12(7):e008953.
doi: 10.1136/jitc-2024-008953.

Pretreatment CT-based machine learning radiomics model predicts response in unresectable hepatocellular carcinoma treated with lenvatinib plus PD-1 inhibitors and interventional therapy

Affiliations

Pretreatment CT-based machine learning radiomics model predicts response in unresectable hepatocellular carcinoma treated with lenvatinib plus PD-1 inhibitors and interventional therapy

Yonglin Hua et al. J Immunother Cancer. .

Abstract

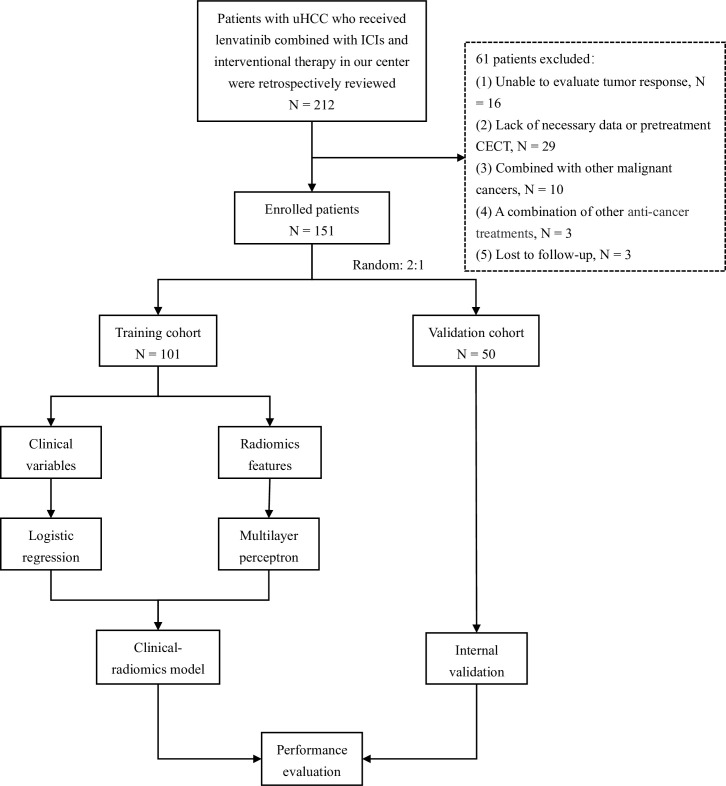
Background: Lenvatinib plus PD-1 inhibitors and interventional (LPI) therapy have demonstrated promising treatment effects in unresectable hepatocellular carcinoma (HCC). However, biomarkers for predicting the response to LPI therapy remain to be further explored. We aimed to develop a radiomics model to noninvasively predict the efficacy of LPI therapy.

Methods: Clinical data of patients with HCC receiving LPI therapy were collected in our institution. The clinical model was built with clinical information. Nine machine learning classifiers were tested and the multilayer perceptron classifier with optimal performance was used as the radiomics model. The clinical-radiomics model was constructed by integrating clinical and radiomics scores through logistic regression analysis.

Results: 151 patients were enrolled in this study (2:1 randomization, 101 and 50 in the training and validation cohorts), of which three achieved complete response, 69 showed partial response, 46 showed stable disease, and 33 showed progressive disease. The objective response rate, disease control rate, and conversion resection rates were 47.7, 78.1 and 23.2%. 14 features were selected from the initially extracted 1223 for radiomics model construction. The area under the curves of the radiomics model (0.900 for training and 0.893 for validation) were comparable to that of the clinical-radiomics model (0.912 for training and 0.892 for validation), and both were superior to the clinical model (0.669 for training and 0.585 for validation). Meanwhile, the radiomics model can categorize participants into high-risk and low-risk groups for progression-free survival (PFS) and overall survival (OS) in the training (HR 1.913, 95% CI 1.121 to 3.265, p=0.016 for PFS; HR 4.252, 95% CI 2.051 to 8.816, p=0.001 for OS) and validation sets (HR 2.347, 95% CI 1.095 to 5.031, p=0.012 for PFS; HR 2.592, 95% CI 1.050 to 6.394, p=0.019 for OS).

Conclusion: The promising machine learning radiomics model was developed and validated to predict the efficacy of LPI therapy for patients with HCC and perform risk stratification, with comparable performance to clinical-radiomics model.

Keywords: Biomarker; Combination therapy; Hepatocellular Carcinoma; Immune Checkpoint Inhibitor.


Conflict of interest statement

Competing interests: None declared.

Figures

Figure 1
Figure 1. Workflow of the clinical-radiomics model development. (A) ROI segmentation, the largest tumor region was segmented layer by layer as the ROI in the arterial phase of contrast-enhanced CT. (B) Radiomics feature extraction, 1223 features were extracted by the radiomics extension module on three-dimensional slicer, including histogram, texture, shape, and filtering features. (C) Radiomics feature selection, 14 radiomics features with the highest correlation were selected through independent sample t-test, Spearman’s correlation test and 10-fold cross-validation LASSO. (D) Radiomics model construction, 14 selected radiomics features were used to establish the radiomics model through the three-layer hidden neural network of MLP. (E) Clinical-radiomics model establishment, the clinical variables with statistical significance in univariate and multivariable analysis were constructed into the clinical model by LR algorithm. Finally, the clinical and radiomics scores were integrated to obtain the clinical-radiomics score for the construction of combined model. BMI, body mass index; ECOG, Eastern Cooperative Oncology Group; HBsAg, hepatitis B surface antigen; ROI, region of interest; LASSO, least absolute shrinkage and selection operator; LR, logistic regression; PT, prothrombin; AFP, alpha-fetoprotein; ALT, alanine aminotransferase; AST, aspartate aminotransferase.
Figure 2
Figure 2. Flow chart of the study design. CECT, CECT, contrast-enhanced CT; ICIs, immune checkpoint inhibitors; uHCC, unresectable hepatocellular carcinoma.
Figure 3
Figure 3. The distribution of 14 selected radiomics features. (A) Heatmap of selected radiomics features distribution between responders and non-responders in the training and validation sets. (B) Violin plot of selected radiomics features distribution between response group and non-response group. *p<0.05, **p<0.01.
Figure 4
Figure 4. Performance and comparison of prediction models in the training and validation cohorts. (A, B) Pod plots of different prediction models among response and non-response groups in the training and validation sets, respectively. The ns represents, p>0.05; *p<0.05, ***p<0.001. (A) represents the training set and (B) represents the validation set. (C, D) Predictive score distribution of the radiomics and clinical-radiomics models between response and non-response groups in the training and validation cohorts. The ***p<0.001. (E, F) Waterfall plot of the predictive score distribution of the radiomics and clinical-radiomics models in the response and non-response groups in the training set. (C, E) represent radiomics score distribution graph; (D, F) represent clinical-radiomics score distribution graph. (G, H) Receiver operating characteristic curve analysis and comparison of different prediction models in the training and validation sets, respectively. (I) Calibration curves of radiomics model and clinical-radiomics model in the training and validation cohorts. (J) Decision curve analysis of the clinical model (green), radiomics model (red) and clinical-radiomics model (blue) in the training cohort. The results show that the net benefits obtained by the different prediction models are greater than two extreme conditions (the treat-all-patients scheme (gray curve) and the treat-none scheme (horizontal black line)). (K, L) CIC shows the actual number of high risks (blue) and the number of high risks predicted by the radiomics model (red) for each risk threshold in the training and validation sets, respectively. The ratio of the blue and red values is the true positive rate. (K) represents the training set and (L) represents the validation set. AUC, area under the curve; CIC, clinical impact curve.
Figure 5
Figure 5. Survival prognosis analysis of the radiomics and clinical-radiomics models for patients with unresectable HCC receiving LPI therapy. (A, B) The Kaplan-Meier curves of PFS between low-risk and high-risk groups in the training and validation sets based on radiomics model. (C, D) The Kaplan-Meier curves of OS between low-risk and high-risk groups in the training and validation sets based on radiomics model. (E, F) The Kaplan-Meier curves of PFS between low-risk and high-risk groups in the training and validation sets based on clinical-radiomics model. (G, H) The Kaplan-Meier curves of OS between low-risk and high-risk groups in the training and validation sets based on clinical-radiomics model. HCC, hepatocellular carcinoma; LPI, lenvatinib plus PD-1 inhibitors and interventional; PFS, progression-free survival; OS, overall survival.

References

    1. Sung H, Ferlay J, Siegel RL, et al. Global cancer statistics 2020: GLOBOCAN estimates of incidence and mortality worldwide for 36 cancers in 185 countries. CA A Cancer J Clinicians. 2021;71:209–49. doi: 10.3322/caac.21660. - DOI - PubMed
    1. Pinna AD, Yang T, Mazzaferro V, et al. Liver transplantation and hepatic resection can achieve cure for hepatocellular carcinoma. Ann Surg. 2018;268:868–75. doi: 10.1097/SLA.0000000000002889. - DOI - PubMed
    1. Park J, Chen M, Colombo M, et al. Global patterns of hepatocellular carcinoma management from diagnosis to death: the BRIDGE study. Liver Int. 2015;35:2155–66. doi: 10.1111/liv.12818. - DOI - PMC - PubMed
    1. Galle PR, Forner A, Llovet JM, et al. EASL clinical practice guidelines: management of hepatocellular carcinoma. J Hepatol. 2018;69:182–236. doi: 10.1016/j.jhep.2018.03.019. - DOI - PubMed
    1. Zhou J, Sun H, Wang Z, et al. Guidelines for the diagnosis and treatment of hepatocellular carcinoma. Liver Cancer. 2020;9:682–720. doi: 10.1159/000509424. - DOI - PMC - PubMed

MeSH terms

LinkOut - more resources