. 2024 Jul 19;15(1):5942.
doi: 10.1038/s41467-024-48680-9.

Whole cervix imaging of collagen, muscle, and cellularity in term and preterm pregnancy

Affiliations

Whole cervix imaging of collagen, muscle, and cellularity in term and preterm pregnancy

Wenjie Wu et al. Nat Commun. .

Abstract

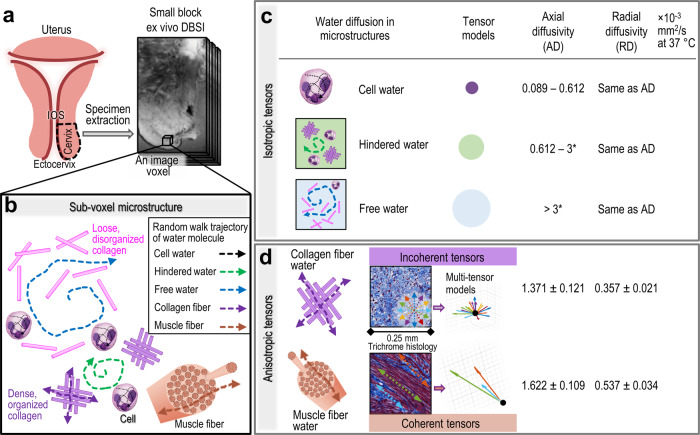
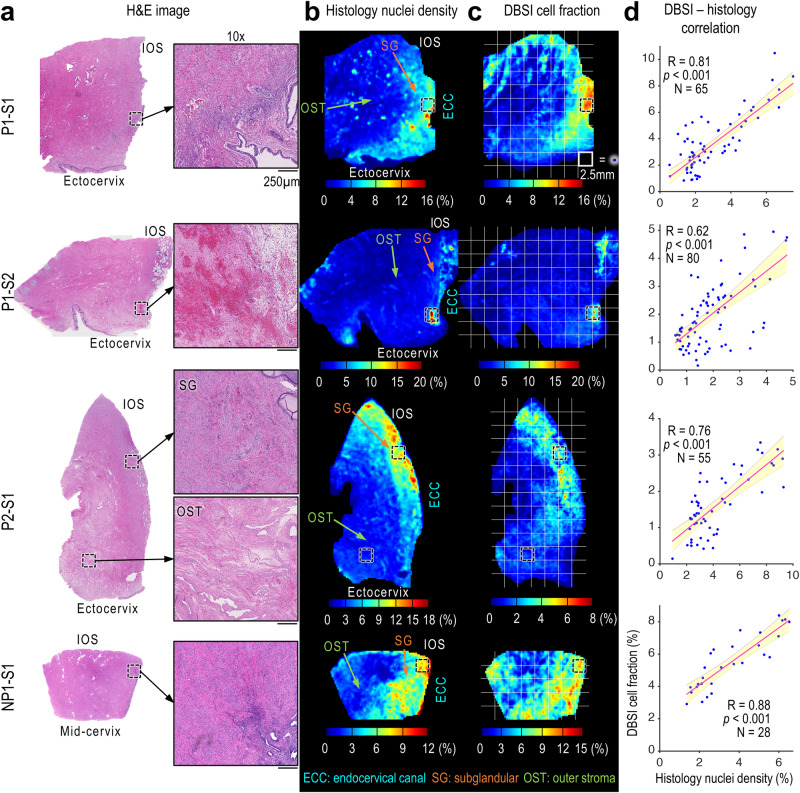
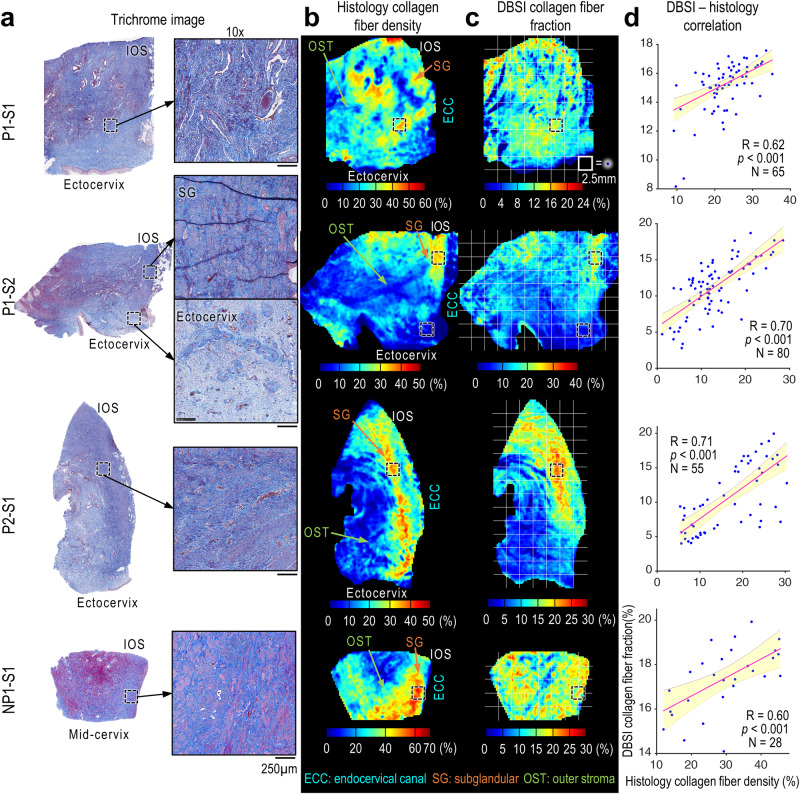
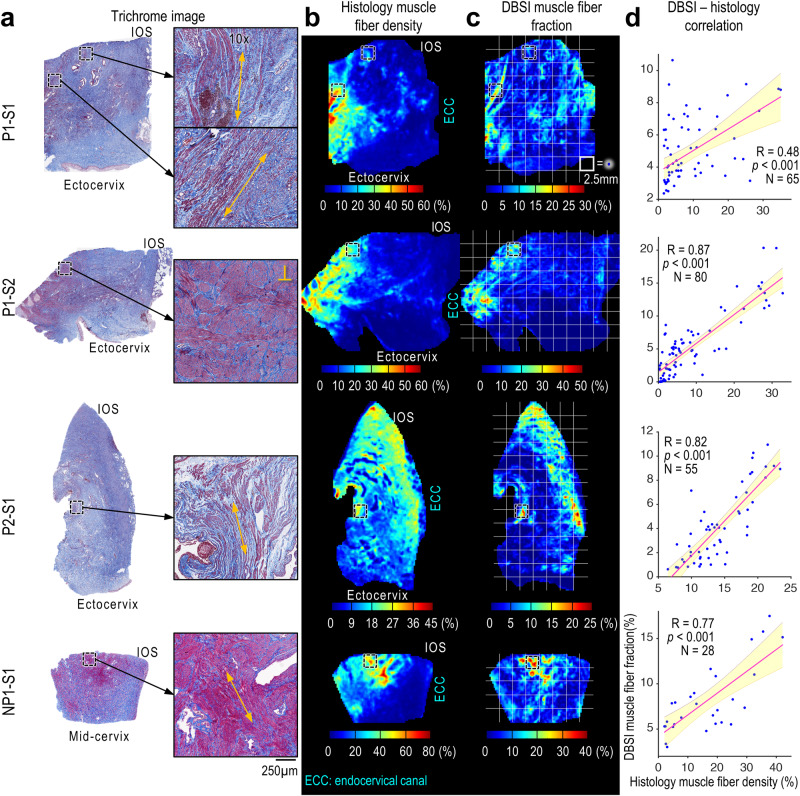
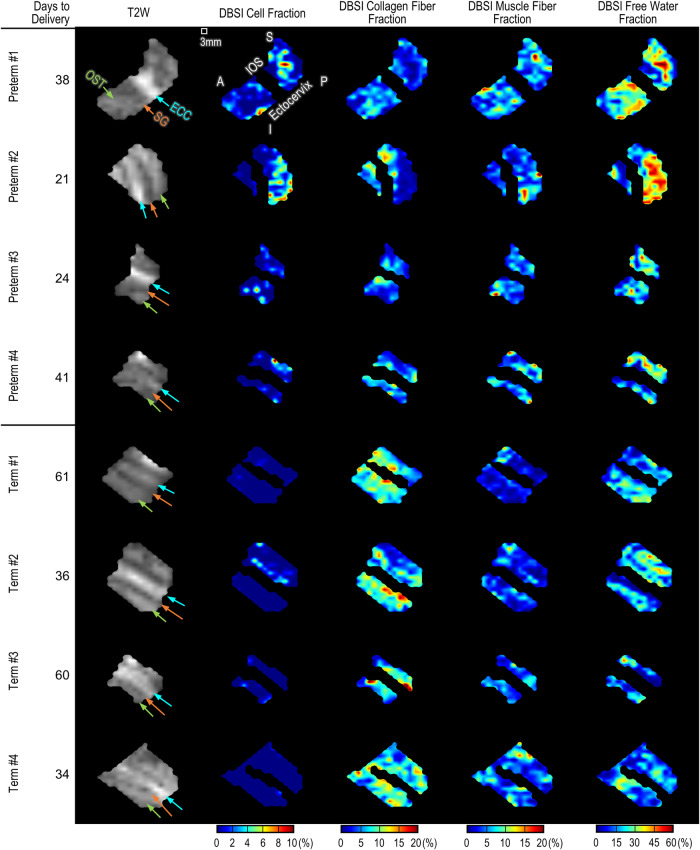
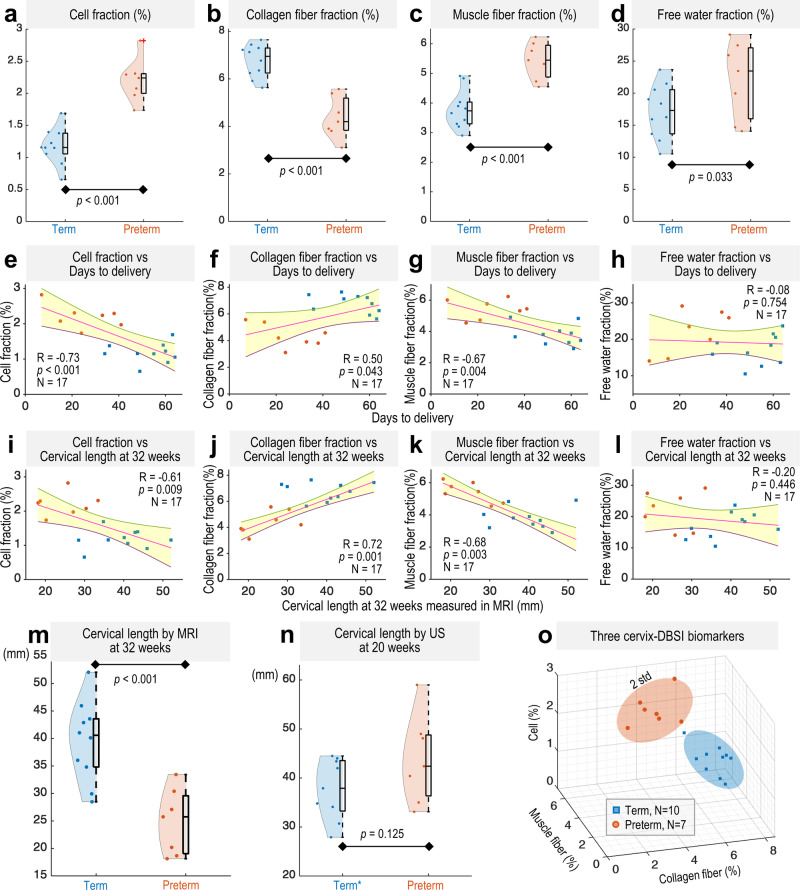
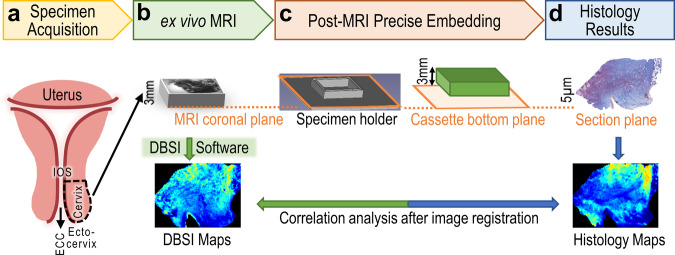
Cervical softening and dilation are critical for the successful term delivery of a fetus, with premature changes associated with preterm birth. Traditional clinical measures like transvaginal ultrasound and Bishop scores fall short in predicting preterm births and elucidating the cervix's complex microstructural changes. Here, we introduce a magnetic resonance diffusion basis spectrum imaging (DBSI) technique for non-invasive, comprehensive imaging of cervical cellularity, collagen, and muscle fibers. This method is validated through ex vivo DBSI and histological analyses of specimens from total hysterectomies. Subsequently, retrospective in vivo DBSI analysis at 32 weeks of gestation in ten term deliveries and seven preterm deliveries with inflammation-related conditions shows distinct microstructural differences between the groups, alongside significant correlations with delivery timing. These results highlight DBSI's potential to improve understanding of premature cervical remodeling and aid in the evaluation of therapeutic interventions for at-risk pregnancies. Future studies will further assess DBSI's clinical applicability.


Conflict of interest statement

The authors declare no competing interests.

Figures

Fig. 1
Fig. 1. The design of multi-tensor models for whole cervix DBSI based on the results from Monte-Carlo simulation.
a Schematic and representative magnetic resonance images of the cervical region used for ex vivo validation of the DBSI parameters. b In an image voxel in the cervix, we modeled three types of isotropic water diffusion: restricted isotropic diffusion within cell membranes (black dashed line in cells), hindered isotropic diffusion (green) around the dense, organized collagen fiber and cells, and free water diffusion (blue) in the region with loosely distributed and disorganized collagen fiber and cells. We also modeled two types of anisotropic water diffusion: incoherent anisotropic diffusion within bundles of tightly packed crossing collagen fibers (purple) and coherent anisotropic diffusion inside bundles of parallel packed muscle fibers (coral). The dashed arrows are examples of water molecule trajectories under a diffusion gradient. c The isotropic tensor models are visualized as spherical balls with the radius reflecting their relative diffusivities. Axial and radial diffusivity of water molecules in cell, collagen, and muscle fiber from the Monte-Carlo simulation. *Free water diffusivity was derived from known experimental values,. d Anisotropic tensors represent water diffusion within a bundle of tightly packed collagen fibers (purple-colored crossing solid rods) and inside a bundle of parallel packed muscle fibers (coral-colored cylindrical tubes).
Fig. 2
Fig. 2. Correlation between histological nuclei density maps and DBSI cell fraction maps.
a H&E images of cervix specimens and 10× magnified views of the black-dashed-boxed regions. The magnified views of P2-S1 show examples of high cell density in the subglandular (SG) region near the cervical canal and low cell density in outer stroma (OST) region, which are reflected on both histological density maps and DBSI maps. b, c Comparison of histological nuclei density maps (b) and DBSI-derived cell fraction maps (c). IOS, internal os; ECC, endocervical canal. d Pearson correlation coefficients (two-sided, at 0.05 significance level) of DBSI cell fraction and histology nuclei density. Each blue dot represents the mean value from a 2.5 × 2.5 mm white grid box within the specimen’s contour in (b) and (c). The red lines are the linear fits, and the shaded areas are 95% confidence intervals. p = 1.76 × 10⁻¹⁶, 8.11 × 10⁻¹⁰, 2.40 × 10⁻¹¹, 8.25 × 10⁻¹⁰ from P1-S1 to NP1-S1, respectively. Source data are provided as a Source Data file.
Fig. 3
Fig. 3. Correlation between histological collagen density maps and DBSI collagen fraction maps.
a Trichrome images of the specimens and 10× magnified views of the black-dashed-boxed regions. The magnified views of P1-S2 show examples of dense organized collagen fibers in the subglandular (SG) region and loose disorganized collagen fiber near the ectocervix, which are reflected on both histological density and DBSI maps. b, c Comparison of histological collagen density maps (b) and DBSI-derived collagen fraction maps (c). d Pearson correlation coefficients (two-sided, at 0.05 significance level) between DBSI collagen fiber fraction and histology collagen fiber density. Each blue dot represents the mean value from a 2.5 × 2.5 mm white grid box within the specimen’s contour in (b) and (c). Red lines indicate linear fits, and shaded areas indicate 95% confidence intervals. p = 4.51 × 10⁻⁸, 3.30 × 10⁻¹³, 1.65 × 10⁻⁹, 6.57 × 10⁻⁴ from P1-S1 to NP1-S1, respectively. Source data are provided as a Source Data file.
Fig. 4
Fig. 4. Correlation between histological muscle density maps and DBSI muscle fraction maps.
a Trichrome images of the specimens and 10× magnified views of the black-dashed-boxed regions. Specimen P1-S1 shows many longitudinal muscle fibers at middle locations radially from the canal; fiber directions indicated by yellow arrows). Specimen P1-S2 shows many circumferential muscle fibers near the cervix-uterus junction that are perpendicular (yellow⊥) to the slides. b, c Comparison of histological muscle density maps (b) and DBSI-derived muscle fraction maps (c). d Pearson correlation coefficients (two-sided, at 0.05 significance level) of DBSI muscle fiber fraction and histology muscle fiber density. Each blue dot represents the mean value from a 2.5 × 2.5 mm white grid box within the specimen’s contour in (b) and (c). Red lines are linear fits and shaded areas are 95% confidence intervals. p = 5.88 × 10⁻⁵, 2.07 × 10⁻²⁵, 2.98 × 10⁻¹⁴, 1.85 × 10⁻⁶ from P1-S1 to NP1-S1, respectively. Source data are provided as a Source Data file.
Fig. 5
Fig. 5. Sagittal view of T2W images and DBSI-derived cell, collagen, muscle fraction, and free water fraction maps from representative patients in the term and preterm groups.
Days to delivery are calculated from the day of MR imaging to the date of delivery. The color-mapping is the same for all eight patients. Color-coded arrows and labels “IOS” (white), “OST” (lime green), “SG” (orange), and “ECC” (cyan blue) indicate internal OS of cervix, outer stroma, subglandular, and endocervical canal, respectively. Labels “S”, “I”, “A” and “P” indicate patient’s superior, inferior, anterior, and posterior positions, respectively. Source data are provided as a Source Data file.
Fig. 6
Fig. 6. DBSI-derived cell, collagen fiber, muscle fiber, and free water fraction in the term and preterm groups.
ad Box and violin plots for DBSI measures in term (blue, N = 10) and preterm (orange, N = 7) groups, showing maxima, 75th percentile, medians, 25th percentile, and minima, alongside violin plots with each dot representing the median of nonzero DBSI values per patient across the whole cervical volume. p = 2.87 × 10−06, 7.35 × 10−06, 6.30 × 10−05 for (a)–(c), respectively. eh Show correlations between the number of days from DBSI imaging to delivery and DBSI measures. p = 8.01 × 10−04 for (e). il Correlations between cervical lengths measured at 32 ± 2 weeks gestation in T2W MR images and DBSI measures. In (e)–(l), each blue and orange dot represents the median of nonzero DBSI values across the whole cervical volume for term and preterm patients, respectively, with red lines for linear fits and shaded areas indicating 95% confidence intervals. m, n Cervical length at 32 weeks by MRI (m) and at 20 weeks by transvaginal ultrasound (n) for term (blue dots, N = 10 for (m); N = 9* for (n)) and preterm (orange dots, N = 7) groups, with box plots depicting the maxima, 75th percentile, medians, 25th percentile, and minima for each group. p = 2.67 × 10−04 for (m). *In (n), one term patient did not undergo transvaginal ultrasound. o DBSI measures visualized on X-Y-Z axes with Gaussian ellipsoids representing two standard deviations from the mean (95% probability) for each group. Statistical analysis performed with one-sided two-sample t-test at a 0.05 level, except for a two-sided test in (n). Correlation analysis performed with two-sided Pearson’s correlation at 0.05 significance level. Source data are provided as a Source Data file.
Fig. 7
Fig. 7. Experimental set-up to use ex vivo specimens to validate cervix-optimized DBSI parameters.
a A specimen (3 mm thickness) was dissected from the posterior midline of fresh total hysterectomy uteruses. Labels “IOS” and “ECC” indicate internal OS of cervix and endocervical canal respectively. b The specimen was embedded in 2% agar gel and imaged with a Varian 11.7 T MRI, using DBSI sequence. DBSI maps were computed by in-house cervix-optimized DBSI software. c After MRI, the specimen was fixed in formalin, transferred, and embedded in a paraffin block along the plane of MR imaging (orange dotted lines indicates the same plane). d The stained slide-mounted 5 µm histologic sections were digitized and converted to histology maps. The histology maps were then registered to the DBSI maps.

References

    1. Timmons, B., Akins, M. & Mahendroo, M. Cervical remodeling during pregnancy and parturition. Trends Endocrinol. Metab.21, 353–361 (2010). 10.1016/j.tem.2010.01.011 - DOI - PMC - PubMed
    1. Badir, S., Mazza, E., Zimmermann, R. & Bajka, M. Cervical softening occurs early in pregnancy: characterization of cervical stiffness in 100 healthy women using the aspiration technique. Prenat. Diagn.33, 737–741 (2013). 10.1002/pd.4116 - DOI - PubMed
    1. Carlson, L. C., Hall, T. J., Rosado-Mendez, I. M., Mao, L. & Feltovich, H. Quantitative assessment of cervical softening during pregnancy with shear wave elasticity imaging: an in vivo longitudinal study. Interface Focus9, 20190030 (2019). - PMC - PubMed
    1. Yoshida, K., Jayyosi, C., Lee, N., Mahendroo, M. & Myers, K. M. Mechanics of cervical remodelling: insights from rodent models of pregnancy. Interface Focus9, 20190026 (2019). 10.1098/rsfs.2019.0026 - DOI - PMC - PubMed
    1. Leppert, P. C. Anatomy and physiology of cervical ripening. Clin. Obstet. Gynecol.38, 267–279 (1995). 10.1097/00003081-199506000-00009 - DOI - PubMed