. 2024 Jul 19;14(1):16652.
doi: 10.1038/s41598-024-63844-9.

A deep learning approach to hard exudates detection and disorganization of retinal inner layers identification on OCT images

Affiliations

A deep learning approach to hard exudates detection and disorganization of retinal inner layers identification on OCT images

Lisa Toto et al. Sci Rep. .

Abstract

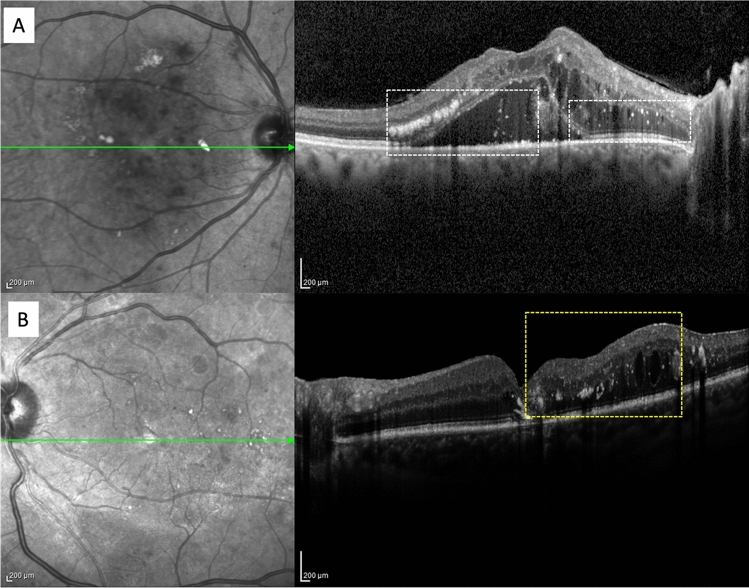
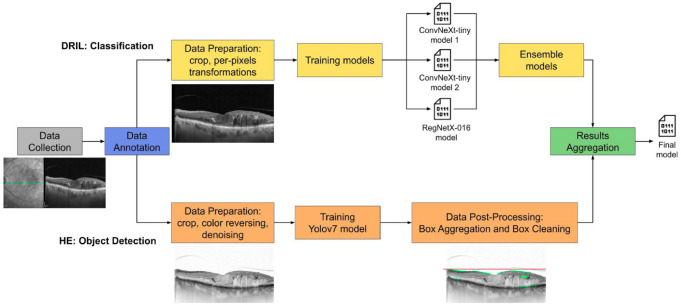
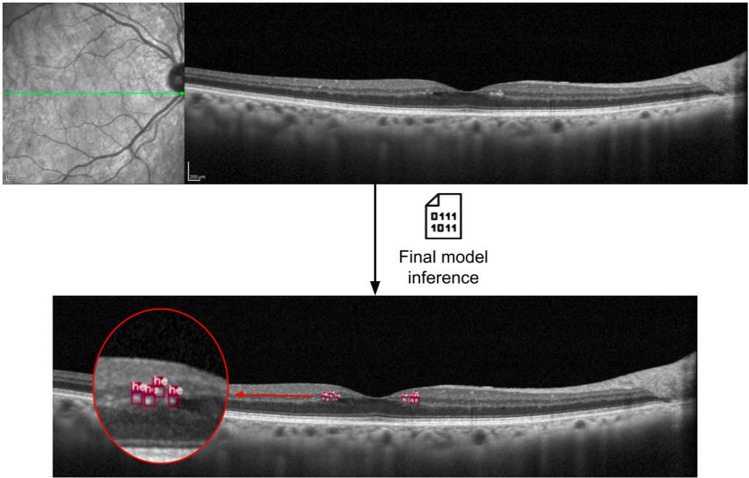
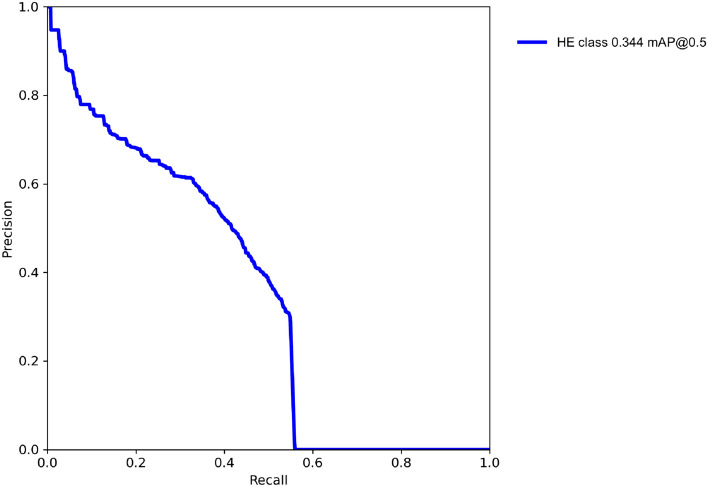
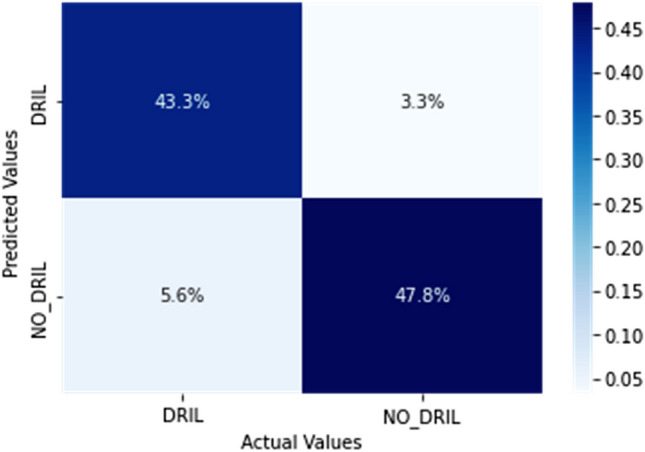
The purpose of the study was to detect Hard Exudates (HE) and classify Disorganization of Retinal Inner Layers (DRIL) implementing a Deep Learning (DL) system on optical coherence tomography (OCT) images of eyes with diabetic macular edema (DME). We collected a dataset composed of 442 OCT images on which we annotated 6847 HE and the presence of DRIL. A complex operational pipeline was defined to implement data cleaning and image transformations, and train two DL models. The state-of-the-art neural network architectures (Yolov7, ConvNeXt, RegNetX) and advanced techniques were exploited to aggregate the results (Ensemble learning, Edge detection) and obtain a final model. The DL approach reached good performance in detecting HE and classifying DRIL. Regarding HE detection the model got an AP@0.5 score equal to 34.4% with Precision of 48.7% and Recall of 43.1%; while for DRIL classification an Accuracy of 91.1% with Sensitivity and Specificity both of 91.1% and AUC and AUPR values equal to 91% were obtained. The P-value was lower than 0.05 and the Kappa coefficient was 0.82. The DL models proved to be able to identify HE and DRIL in eyes with DME with a very good accuracy and all the metrics calculated confirmed the system performance. Our DL approach demonstrated to be a good candidate as a supporting tool for ophthalmologists in OCT images analysis.


Conflict of interest statement

Lisa Toto, Anna Romano, Marco Pavan, Dante Degl’Innocenti, Valentina Olivotto, Federico Formenti, Pasquale Viggiano, Edoardo Midena and Rodolfo Mastropasqua declare no competing interests.

Figures

Figure 1
Figure 1
A Infrared (IR) image and horizontal optical coherence tomography (OCT) scan of a patient with diabetic macular edema showing hard exudates (dashed white rectangle). B IR image and horizontal passing through the fovea OCT scan passing through the fovea showing diabetic macular edema and disorganization of retinal inner layers (dashed yellow rectangle).
Figure 2
Figure 2
The operational workflow of our AI system. Due to the complexity of the task we designed and implemented a custom pipeline. It involves a shared phase of data collection and annotation and it is followed by two distinct branches, one for DRIL classification and the other one for HE detection. By combining these approaches, we are able to achieve the final goal with a model that fulfills our purpose.
Figure 3
Figure 3
An example of input image and its corresponding output after the AI model inference. The upper part of the figure reports a typical OCT image that can be used as input data of our system to analyze the benchmarks presence. After the inference of the final model the image is labeled with a class (“DRIL” or “NO DRIL”) that highlights if a DRIL is present or not, and all the predicted HEs are marked with bounding boxes. Regarding the specific sample, the predicted class is “NO_DRIL”, while the HEs are identified by red boxes as emphasized in the zoom area.
Figure 4
Figure 4
The results of HE detection on test set images. Precision-Recall curve of HE detection model considering IOU (Intersection Over Union) threshold to 0.5.
Figure 5
Figure 5
Confusion matrix of DRIL classification results on the test set images. It presents the percentage result of the predictions made by the model, compared to the actual values assigned by expert ophthalmologists during the annotation process.

References

    1. Yau, J. W. et al. Global prevalence and major risk factors of diabetic retinopathy. Diabetes Care35(3), 556–564. 10.2337/dc11-1909 (2012). 10.2337/dc11-1909 - DOI - PMC - PubMed
    1. Varma, R. et al. Prevalence of and risk factors for diabetic macular edema in the United States. JAMA Ophthalmol.132(11), 1334–1340. 10.1001/jamaophthalmol.2014.2854 (2014). 10.1001/jamaophthalmol.2014.2854 - DOI - PMC - PubMed
    1. Starace, V. et al. The role of inflammation and neurodegeneration in diabetic macular edema. Ther Adv Ophthalmol.13, 25158414211055964. 10.1177/25158414211055963 (2021). 10.1177/25158414211055963 - DOI - PMC - PubMed
    1. Capitão, M. & Soares, R. Angiogenesis and inflammation crosstalk in diabetic retinopathy. J Cell Biochem.117(11), 2443–2453. 10.1002/jcb.25575 (2016). 10.1002/jcb.25575 - DOI - PubMed
    1. Miyamoto, K. et al. Prevention of leukostasis and vascular leakage in streptozotocin-induced diabetic retinopathy via intercellular adhesion molecule-1 inhibition. Proc Natl Acad Sci U S A.96(19), 10836–10841. 10.1073/pnas.96.19.10836 (1999). 10.1073/pnas.96.19.10836 - DOI - PMC - PubMed

MeSH terms

LinkOut - more resources