

Genomic and immune determinants of resistance to daratumumab-based therapy in relapsed refractory multiple myeloma
- PMID: 39030183
- PMCID: PMC11271515
- DOI: 10.1038/s41408-024-01096-6
Genomic and immune determinants of resistance to daratumumab-based therapy in relapsed refractory multiple myeloma
Abstract
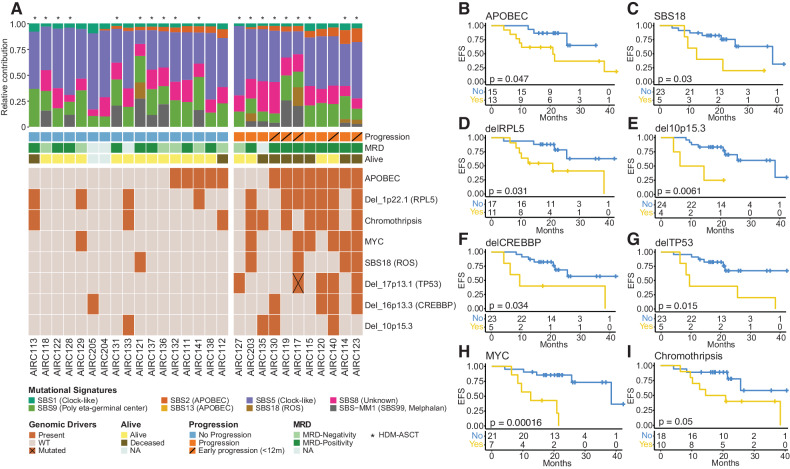
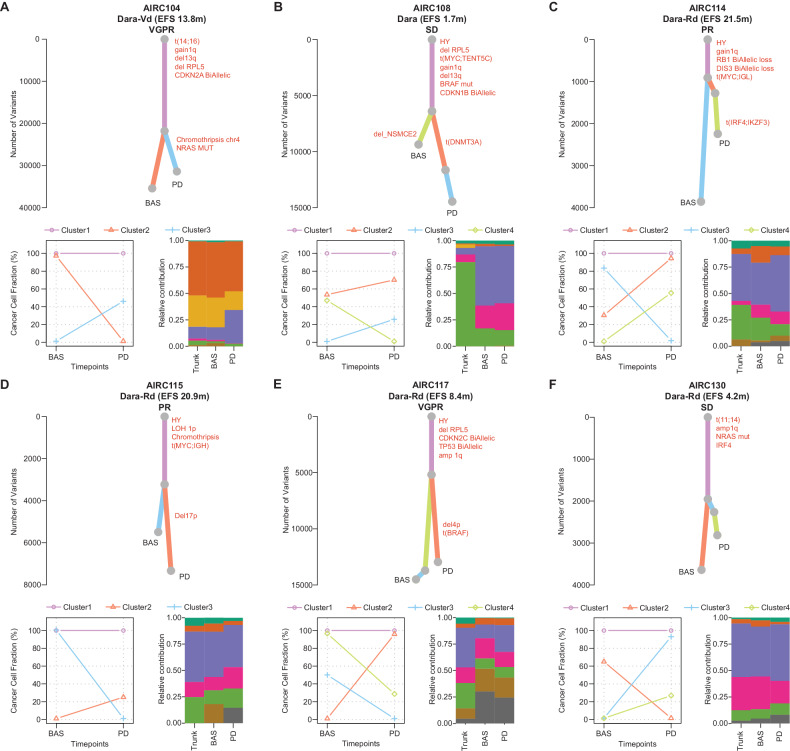
Targeted immunotherapy combinations, including the anti-CD38 monoclonal antibody (MoAb) daratumumab, have shown promising results in patients with relapsed/refractory multiple myeloma (RRMM), leading to a considerable increase in progression-free survival. However, a large fraction of patients inevitably relapse. To understand this, we investigated 32 relapsed MM patients treated with daratumumab, lenalidomide, and dexamethasone (Dara-Rd; NCT03848676). We conducted an integrated analysis using whole-genome sequencing (WGS) and flow cytometry in patients with RRMM. WGS before and after treatment pinpointed genomic drivers associated with early progression, including RPL5 loss, APOBEC mutagenesis, and gain of function structural variants involving MYC and chromothripsis. Flow cytometry on 202 blood samples, collected every 3 months until progression for 31 patients, revealed distinct immune changes significantly impacting clinical outcomes. Progressing patients exhibited significant depletion of CD38-positive NK cells, persistence of T-cell exhaustion, and reduced depletion of regulatory T cells over time. These findings underscore the influence of immune composition and daratumumab-induced immune changes in promoting MM resistance. Integrating genomics and flow cytometry unveiled associations between adverse genomic features and immune patterns. Overall, this study sheds light on the intricate interplay between genomic complexity and the immune microenvironment driving resistance to Dara-Rd in patients with RRMM.
© 2024. The Author(s).
Conflict of interest statement
OL has received research funding from: National Institutes of Health (NIH), National Cancer Institute (NCI), U.S. Food and Drug Administration (FDA), Multiple Myeloma Research Foundation (MMRF), International Myeloma Foundation (IMF), Leukemia and Lymphoma Society (LLS), Myeloma Solutions Fund (MSF), Paula and Rodger Riney Multiple Myeloma Research Program Fund, the Tow Foundation, Perelman Family Foundation, Rising Tide Foundation, Amgen, Celgene, Janssen, Takeda, Glenmark, Seattle Genetics, Karyopharm; Honoraria/ad boards: Adaptive, Amgen, Binding Site, BMS, Celgene, Cellectis, Glenmark, Janssen, Juno, Pfizer; and serves on Independent Data Monitoring Committees (IDMCs) for clinical trials lead by Takeda, Merck, Janssen, Theradex. FM has received honoraria from Medidata. NB has received honoraria from Janssen, Pfizer, GSK, Jazz, Takeda. The remaining authors declare no competing interests. MD has received honoraria from GlaxoSmithKline, Sanofi, and Janssen; has served on the advisory boards for GlaxoSmithKline, Sanofi, Adaptive Biotechnologies and Bristol Myers Squibb. SO has received honoraria from Amgen, Celgene/Bristol Myers Squibb, Janssen, Sanofi; has served on the advisory boards for Pfizer, Adaptive Biotechnologies, Janssen, Amgen, Takeda, and Sanofi. BB has received honoraria from Amgen, Janssen, Novartis, BeiGene, Bristol Myers Squibb, GlaxoSmithKline, Jazz pharmaceuticals, Astrazeneca and Incyte; has served on the advisory boards for Amgen and Jazz pharmaceuticals. MB has received honoraria from Sanofi, Celgene, Amgen, Janssen, Novartis, Bristol Myers Squibb, and AbbVie; has served on the advisory boards for Janssen and GlaxoSmithKline; has received research funding from Sanofi, Celgene, Amgen, Janssen, Novartis, Bristol Myers Squibb, and Mundipharma. AL has received honoraria and served on the advisory board from Janssen-Cilag, BMS, Amgen, Takeda, Oncopeptides, GSK, Sanofi and Karyopharm.
Figures


Update of
-
Genomic and immune determinants of resistance to anti-CD38 monoclonal antibody-based therapy in relapsed refractory multiple myeloma.medRxiv [Preprint]. 2023 Dec 4:2023.12.04.23299287. doi: 10.1101/2023.12.04.23299287. medRxiv. 2023. Update in: Blood Cancer J. 2024 Jul 19;14(1):117. doi: 10.1038/s41408-024-01096-6. PMID: 38106151 Free PMC article. Updated. Preprint.
References
-
- Costa LJ, Chhabra S, Medvedova E, Dholaria BR, Schmidt TM, Godby KN, et al. Daratumumab, carfilzomib, lenalidomide, and dexamethasone with minimal residual disease response-adapted therapy in newly diagnosed multiple myeloma. J Clin Oncol. 2021;40:2901–12. - PubMed
-
- Dimopoulos MA, Terpos E, Boccadoro M, Delimpasi S, Beksac M, Katodritou E, et al. Daratumumab plus pomalidomide and dexamethasone versus pomalidomide and dexamethasone alone in previously treated multiple myeloma (APOLLO): an open-label, randomised, phase 3 trial. Lancet Oncol. 2021;22:801–12. 10.1016/S1470-2045(21)00128-5 - DOI - PubMed
MeSH terms
Substances
Associated data
Grants and funding
LinkOut - more resources
Full Text Sources
Medical
Research Materials
Miscellaneous
