

Sleep patterns and risk of chronic disease as measured by long-term monitoring with commercial wearable devices in the All of Us Research Program
- PMID: 39030265
- PMCID: PMC11405268
- DOI: 10.1038/s41591-024-03155-8
Sleep patterns and risk of chronic disease as measured by long-term monitoring with commercial wearable devices in the All of Us Research Program
Abstract
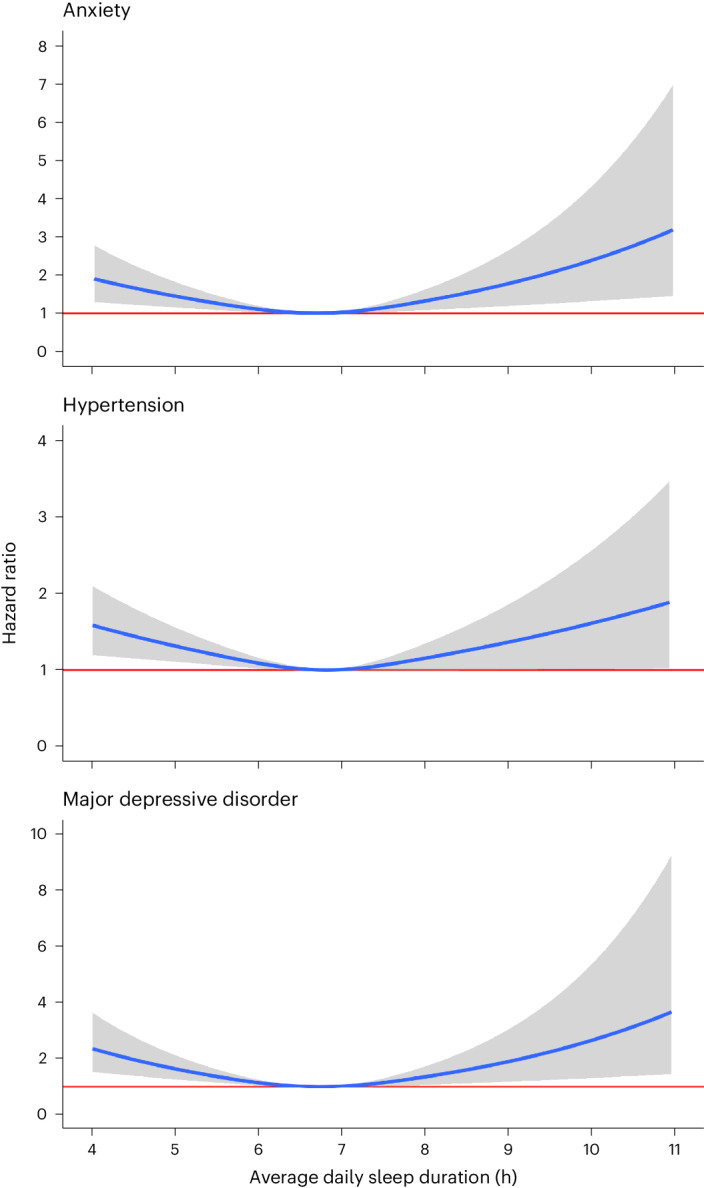
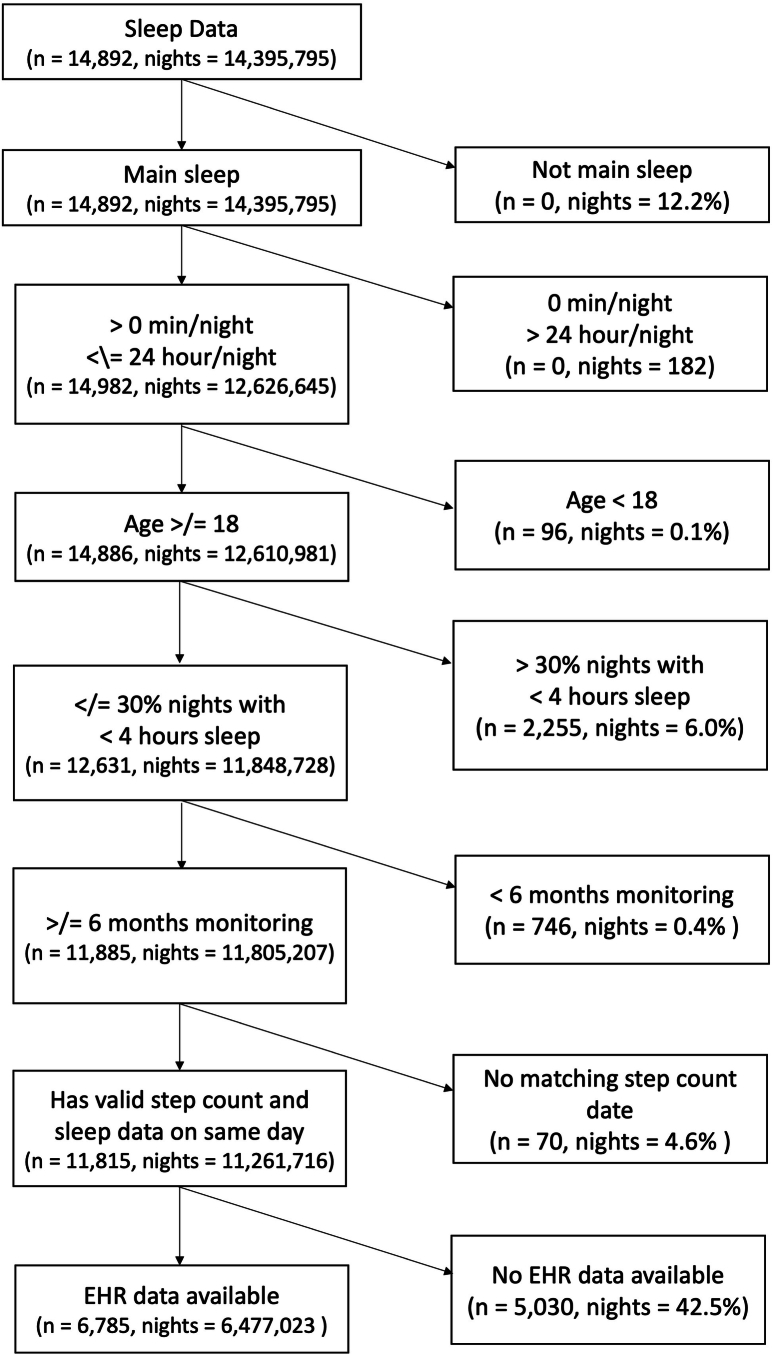
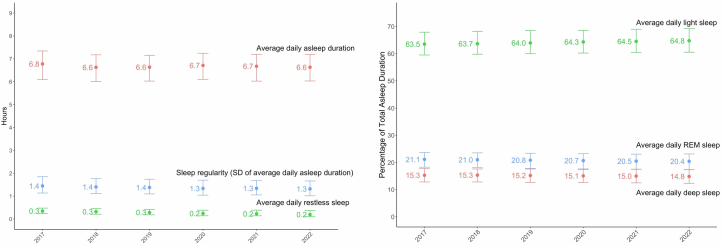
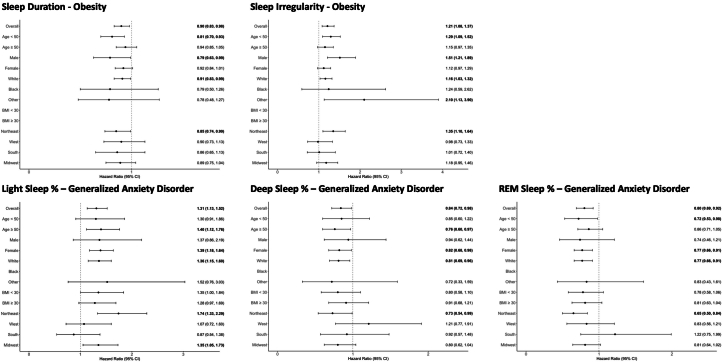
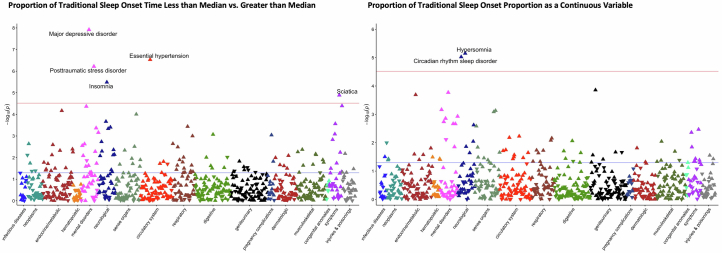
Poor sleep health is associated with increased all-cause mortality and incidence of many chronic conditions. Previous studies have relied on cross-sectional and self-reported survey data or polysomnograms, which have limitations with respect to data granularity, sample size and longitudinal information. Here, using objectively measured, longitudinal sleep data from commercial wearable devices linked to electronic health record data from the All of Us Research Program, we show that sleep patterns, including sleep stages, duration and regularity, are associated with chronic disease incidence. Of the 6,785 participants included in this study, 71% were female, 84% self-identified as white and 71% had a college degree; the median age was 50.2 years (interquartile range = 35.7, 61.5) and the median sleep monitoring period was 4.5 years (2.5, 6.5). We found that rapid eye movement sleep and deep sleep were inversely associated with the odds of incident atrial fibrillation and that increased sleep irregularity was associated with increased odds of incident obesity, hyperlipidemia, hypertension, major depressive disorder and generalized anxiety disorder. Moreover, J-shaped associations were observed between average daily sleep duration and hypertension, major depressive disorder and generalized anxiety disorder. These findings show that sleep stages, duration and regularity are all important factors associated with chronic disease development and may inform evidence-based recommendations on healthy sleeping habits.
© 2024. The Author(s).
Conflict of interest statement
D.M.R. has served on advisory boards for Illumina and Alkermes and has received research funds unrelated to this work from PTC Therapeutics. E.L.B. has received research funds unrelated to this work from United Therapeutics. K.G., J.H.C., J.H. and L.D.S. are employees of Google and own Alphabet stock as part of the standard compensation package. L.D.S. has been compensated for participation in speakers’ bureaus and advisory boards by Eisai Pharmaceuticals, Jazz Pharmaceuticals, Avadel Pharmaceuticals and Harmony Biosciences, unrelated to this work. J.H. serves on the board of directors for ResMed and owns ResMed stock. Fitbit and Google were not involved in the collection, management and analysis of the data, nor in the decision to submit the manuscript for publication. Team members from Fitbit and Google provided input during the design and conduct of the study, participated in interpretation of results, and participated in preparation, review and approval of the manuscript. The All of Us Research Program was not involved in the design and conduct of the study; collection, management and analysis of the data; preparation, review or approval of the manuscript; and decision to submit the manuscript for publication. To ensure privacy of participants, data used for this study were accessed and available to approved researchers only following registration, completion of ethics training and attestation of a data use agreement through the All of Us Research Workbench platform, which can be accessed via
Figures
References
MeSH terms
Grants and funding
- U2C OD023196/OD/NIH HHS/United States
- R21 HL172038/HL/NHLBI NIH HHS/United States
- OT2 OD025315/OD/NIH HHS/United States
- OT2 OD026551/OD/NIH HHS/United States
- U24 OD023121/OD/NIH HHS/United States
- OT2 OD026552/OD/NIH HHS/United States
- OT2 OD025337/OD/NIH HHS/United States
- OT2 OD025277/OD/NIH HHS/United States
- OT2 OD026550/OD/NIH HHS/United States
- R33 HL158941/HL/NHLBI NIH HHS/United States
- OT2 OD026553/OD/NIH HHS/United States
- OT2 OD025276/OD/NIH HHS/United States
- OT2 OD026557/OD/NIH HHS/United States
- OT2 OD026554/OD/NIH HHS/United States
- U24 OD023163/OD/NIH HHS/United States
- OT2 OD023206/OD/NIH HHS/United States
- OT2 OD026556/OD/NIH HHS/United States
- R01 FD007627/FD/FDA HHS/United States
- HL158941/U.S. Department of Health & Human Services | NIH | National Heart, Lung, and Blood Institute (NHLBI)
- U24 OD023176/OD/NIH HHS/United States
- OT2 OD026548/OD/NIH HHS/United States
- OT2 OD026549/OD/NIH HHS/United States
- R61 HL158941/HL/NHLBI NIH HHS/United States
- FD007627/U.S. Department of Health & Human Services | U.S. Food and Drug Administration (U.S. Food & Drug Administration)
- OT2 OD026555/OD/NIH HHS/United States
- OT2 OD023205/OD/NIH HHS/United States
- HL172038/U.S. Department of Health & Human Services | NIH | National Heart, Lung, and Blood Institute (NHLBI)
LinkOut - more resources
Full Text Sources
