. 2024 Jul 19;15(1):6079.
doi: 10.1038/s41467-024-50438-2.

IL-1R signaling drives enteric glia-macrophage interactions in colorectal cancer

Affiliations

IL-1R signaling drives enteric glia-macrophage interactions in colorectal cancer

Lies van Baarle et al. Nat Commun. .

Abstract

Enteric glia have been recently recognized as key components of the colonic tumor microenvironment indicating their potential role in colorectal cancer pathogenesis. Although enteric glia modulate immune responses in other intestinal diseases, their interaction with the colorectal cancer immune cell compartment remains unclear. Through a combination of single-cell and bulk RNA-sequencing, both in murine models and patients, here we find that enteric glia acquire an immunomodulatory phenotype by bi-directional communication with tumor-infiltrating monocytes. The latter direct a reactive enteric glial cell phenotypic and functional switch via glial IL-1R signaling. In turn, tumor glia promote monocyte differentiation towards pro-tumorigenic SPP1+ tumor-associated macrophages by IL-6 release. Enteric glia cell abundancy correlates with worse disease outcomes in preclinical models and colorectal cancer patients. Thereby, our study reveals a neuroimmune interaction between enteric glia and tumor-associated macrophages in the colorectal tumor microenvironment, providing insights into colorectal cancer pathogenesis.


Conflict of interest statement

The authors declare no competing interests.

Figures

Fig. 1
Fig. 1. EGCs shape the CRC immune compartment.
a Schematic representation of the murine orthotopic CRC model. Adult mice were injected endoscopically in the colonic submucosa with MC38 cells and tumors were assessed at day (d)7, d14 or d21. bd PLP1CreERT2iDTR mice were intraperitoneally (i.p.) injected with tamoxifen at d-19 and d-17, followed by intracolonic (i.c.) injection at d-5 and d-3 with 40 ng Diphtheria toxin (DT) or saline (Vehicle). At d0, MC38 cells were i.c. injected in both groups. Tumor growth and immune infiltration were assessed at d7. Schematic representation of EGCs depletion mouse model (b) with representative pictures (scale bar 2 mm) and quantitative comparison of tumor volume (c). Data show absolute tumor-infiltrating myeloid immune cell numbers per mg tumor tissue (d) (n = 13 Vehicle, n = 12 DT). eg WT C57BL/6J mice were i.c. injected with MC38 cells with or without embryonic neurosphere-derived EGCs (1:1 ratio). Tumor growth and immune infiltration were assessed at d21. Schematic representation of EGCs co-injection mouse model (e) with representative pictures (scale bar 2 mm) and quantitative comparison of tumor volume (f). Data show absolute tumor-infiltrating myeloid immune cell numbers per mg tumor tissue (g) (n = 11 MC38, n = 10 MC38 + EGCs). h Immunostaining of orthotopic murine tumor sections showing GFAP (magenta), F4/80 (green) and DAPI (blue) (scale bar 70 µm and 25 µm) representative of 4 independent experiments. Data show mean ± SEM (c, d, f, g). Statistical analysis: unpaired two-tailed Mann-Whitney test (c, d, f, g) *p < 0.05, **p < 0.005, ns not significant. Source data and exact p values are provided as a Source Data file.
Fig. 2
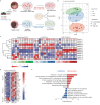
Fig. 2. EGCs display an activated and immunomodulatory phenotype in CRC.
Transcriptome analysis of in vitro primary embryonic neurosphere-derived EGCs alone or stimulated with healthy conditioned medium (H-CM) or tumor microenvironment conditioned medium (TME-CM) at different time points (6 h, 12 h, and 24 h, n = 4). a Schematic representation of the in vitro tumor EGCs model. b Principal component analysis (PCA) plot of EGCs gene signature identified by 3´mRNA bulk RNA-seq. Each dot represents an individual sample. c Heatmap showing the transcriptional modules identified by weighted gene correlation network analysis (WGCNA). d Heatmap of differentially expressed genes in modules 4, 7, and 8 of in vitro murine EGCs stimulated for 24 h with H- or TME-CM. e Gene set enrichment analysis for the differentially up- and down-regulated genes in TME-CM versus H-CM stimulated EGCs after 24 h (n = 4). Source data are provided as a Source Data file.
Fig. 3
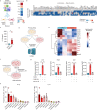
Fig. 3. Tumor EGC-derived IL-6 favors SPP1+ TAM differentiation.
a-c Analysis of monocytes and macrophages from the scRNA-seq data of orthotopic MC38 tumors in WT C57BL/6J mice, 21 days(d) after tumor induction (n = 3). UMAP of subclustering (a), dot plot of differentially expressed marker genes (b) and differentiation trajectory (c). d WT C57BL/6J mice were intracolonically injected with MC38 cells ± embryonic neurosphere-derived EGCs (1:1 ratio). SPP1+ TAMs and C1Q+ TAMs infiltration was assessed on d21. Data represent absolute numbers/mg tumor (n = 11 MC38, n = 10 MC38 + EGCs). e, f Nichenet analysis was performed considering ligands expressed by 24 h tumor microenvironment-conditioned medium (TME-CM) EGCs, (CRC EGCs bulk RNAseq; Fig. 2) and considering the differentially expressed genes between monocytes and SPP1+ TAMs as target genes (orthotopic murine CRC dataset; Fig. 3a). Pearson correlation of top TME-CM EGCs-released ligands predicted to induce monocytes to SPP1+ TAM differentiation (e). Heatmap showing regulatory potential scores between top EGC-released ligands and their target genes differentially expressed between monocytes and SPP1+ TAMs (f). gh Supernatant of healthy (H)-CM, TME-CM, H EGCs-CM, and TME EGCs-CM were incubated with IgG or anti-IL-6 (both 5 µg/mL) along with Dynabeads™ Protein G followed by removal of the protein-antibody-bead complex. Murine monocytes were cultured for 48 h with the indicated supernatants (n = 3 H-CM and TME-CM). Experimental design (g). Percentages of SPP1+ and C1Q+ TAMs in monocyte cultures after stimuli (h). i IL-6 concentration in H-CM, TME-CM, H-EGCs-CM, and TME-EGCs-CM (n = 3 H-CM and TME-CM). After tamoxifen treatment were SOX10CreERT2IL-6wt/wt and SOX10CreERT2IL-6fl/fl mice intracolonic (i.c.) injected with MC38 cells. Tumor growth and immune infiltration were assessed at d14 (n = 10). Schematic representation (j), representative pictures (scale bar 2 mm) and comparison of tumor volume (n = 10) (k). Tumor-infiltrating TAM numbers/mg tumor (n = 10) (l). Data are presented as mean ± SEM (d, h, i, k, l). Statistical analysis: unpaired two-tailed Mann Whitney test (d), two-way ANOVA with correction for multiple comparisons (h, i), unpaired two-tailed t-test (k, l). *p < 0.05, **p < 0.005, ***p < 0.0005, ****p < 0.00005, ns not significant. Source data and exact p values are provided as a Source Data file.
Fig. 4
Fig. 4. IL-1R activation drives the CRC EGC phenotype.
a, b Top ligands from orthotopic CRC tumor-infiltrating immune cells predicted by NicheNet to be inducing CRC EGC signature. NicheNet analysis was performed considering the ligands expressed by murine orthotopic CRC tumor-infiltrating immune cells, data extracted from CRC orthotopic murine CRC dataset (see Supplementary Fig. 4a) and considering the differentially expressed genes between 24 h healthy conditioned medium (H-CM) EGCs and tumor microenvironment (TME)-CM EGCs as target genes, data extracted from in vitro CRC EGCs bulk RNAseq dataset (see Fig. 2). Schematic representation of TME-derived ligand-EGC interplay (left) and top 5 predicted ligands with their Pearson correlation (right) (a). Heatmap of ligand-target pairs showing regulatory potential scores between top ligands and target genes among the differentially expressed genes between in vitro H-CM EGCs and TME-CM EGCs (b). c Protein level of IL-1β in H-CM and TME-CM (n = 6 H-CM and TME-CM). d, e Primary adult neurosphere-derived EGCs were isolated from WT C57BL/6J mice and treated with or without recombinant (r)IL-1β (10 ng/mL) for 24 h. Protein concentration in the culture supernatants was determined by liquid chromatography/mass spectrometry (n = 4). Schematic experimental representation (d) and heatmap of differentially expressed proteins between vehicle and rIL-1β-treated EGCs (e). f, g Primary embryonic neurosphere-derived EGCs were stimulated for 24 h with H-CM or TME-CM in the presence or absence of IgG or anti-IL-1R (5 µg/mL each) (n = 3 H-CM and TME-CM). Schematic representation of experimental setup (f). Relative mRNA levels for Lcn2, Timp1, Ccl2, and Il6 normalized to the housekeeping gene Rpl32 (g). h WT C57BL/6J mice were intracolonically injected at day(d)0 with MC38 cells, and both stromal and immune cells were assessed for IL-1β and IL-1α expression at d21. Data are presented as the frequency of total live IL-1β+ or IL-1α+ cells (n = 5 mice). Data are represented as mean ± SEM (c, g, h). Statistical analysis: unpaired two-tailed Mann-Whitney test (c), unpaired one-way Anova test with multiple comparison correction (g). **p < 0.005, ***p < 0.0005, ****p < 0.00005. Source data and exact p values are provided as a Source Data file.
Fig. 5
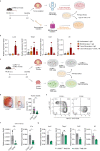
Fig. 5. Monocyte-derived IL-1 promotes the CRC EGC phenotype.
a, b Primary embryonic neurosphere-derived EGCs were stimulated for 24 h with IgG or anti-IL-1R (5 µg/mL each) with or without the supernatant of sorted tumor monocytes or bone marrow (BM)-derived monocytes from WT C57BL/6J mice bearing orthotopic CRC tumors. Schematic representation of experimental setup (a). Relative mRNA levels of Lcn2, Timp1, Ccl2, and Il6, normalized to the housekeeping gene Rpl32, in primary embryonic neurosphere-derived EGCs were compared between EGCs stimulated with tumor monocyte supernatant + IgG and all other conditions (n = 3 primary EGC cultures and monocytes) (b). cg CCR2+/+ and CCR2−/− mice were intracolonically injected at day(d)0 with MC38 cells, tumor tissue was collected at d21. Then, in vitro embryonic neurosphere-derived EGCs were cultured for 24 h with the tumor microenvironment-conditioned medium (TME-CM) of CCR2+/+ and CCR2−/− tumors. Schematic representation of experimental setup (c). Representative pictures (left, scale bar 2 mm) and quantitative comparison of tumor volume (right) (n = 16 CCR2+/+, n = 17 CCR2−/−) (d). Representative contour plots of tumor-infiltrating monocytes and macrophages gated on live-CD45+-CD11b+-Ly6G-CD64+ cells (e). Relative mRNA levels of Il1b and Il1a normalized to the housekeeping gene Rpl32 in CCR2+/+ and CCR2−/− CRC tumors (n = 3 mice) (f). Relative mRNA levels of Lcn2, Timp1, Ccl2, and Il6 in EGCs stimulated with TME-CM of CCR2+/+ and CCR2−/− mice, normalized to the housekeeping gene Rpl32 (n = 3 TME-CM) (g). Data represented as mean ± SEM (b, d, f, g). Statistical analysis: One-way ANOVA test with correction for multiple comparisons, compared to tumor monocyte supernatant + IgG condition (b), unpaired two-tailed Mann Whitney test (d) or unpaired two-tailed t-test (f, g). *p < 0.05, **p < 0.005, ***p < 0.0005, ns not significant. Source data and exact p values are provided as a Source Data file.
Fig. 6
Fig. 6. IL-1R signaling in EGCs promotes SPP1+ TAM differentiation and tumor progression.
ac Murine bone marrow-derived monocytes were cultured for 48 h with supernatant of primary embryonic neurosphere-derived EGCs, which were pre-incubated for 24 h with tumor microenvironment conditioned medium (TME-CM) or healthy-CM (H-CM) together with isotype IgG or anti-IL-1R (5 µg/mL each). Antibodies were removed from the CM through the application of Dynabeads™ Protein G prior to incubation with monocytes. Experimental design (a). Flow cytometry quantification of SPP1+ TAMs and C1Q+ TAMs after TME-EGCs (n = 7) (b) or H-EGCs (n = 4) (c) supernatant stimulation. d IL-6 concentration in the conditioned medium of H-EGCs and TME-EGCs pre-incubated with IgG or anti-IL-1R (n = 3 primary EGC cultures). eg WT C57BL/6J mice were intracolonically (i.c.) injected with MC38 cells and embryonic neurosphere-derived WT EGCs or IL-1R1−/− EGCs (1:1 ratio). Tumor growth and immune infiltration were assessed on day (d)14. Schematic representation of EGCs co-injection mouse model (e) with representative pictures (scale bar 2 mm) and quantitative comparison of tumor volume (n = 7 mice) (f). Data show absolute tumor-infiltrating TAM cell numbers per mg tumor tissue (n = 7 MC38 + WT EGCs, n = 6 MC38 + IL-1R1−/− EGCs) (g). hj GFAPWtIL-1R1fl/fl and GFAPCreIL-1R1fl/fl mice were i.c. injected with AKPT cells. Tumor growth and immune infiltration were assessed at d14. Schematic representation of orthotopic CRC mouse model (h) with representative pictures (scale bar 2 mm) and quantitative comparison of tumor volume (n = 12 GFAPWtIL-1R1fl/fl, n = 8 GFAPCreIL-1R1fl/fl) (i). Data show absolute tumor-infiltrating TAM cell numbers per mg tumor tissue (n = 11 GFAPWtIL-1R1fl/fl, n = 6 GFAPCreIL-1R1fl/fl) (j). Data are represented as mean ± SEM (d, f, g, i, j). Statistical analysis: paired two-tailed Wilcoxon test (b, c), two-way ANOVA test with correction for multiple comparisons (d) or unpaired two-tailed Mann-Whitney test (f, g, i, j). *p < 0.05, **p < 0.005, ***p < 0.0005, ****p < 0.00005, ns not significant. Source data and exact p values are provided as a Source Data file.
Fig. 7
Fig. 7. IL-1R deficient EGCs impair tumor progression and SPP1+ TAM differentiation in colitis-associated CRC.
a Schematic representation of the murine AOM/DSS CRC model. Mice were intraperitoneally (i.p.) injected with azoxymethane (AOM, 10 mg/kg body weight) at day(d)0. Starting from d7, mice underwent 3 repetitive cycles of 1.5% dextran sodium sulfate (DSS) in drinking water as indicated. b GFAPCreAi14fl/fl mice were subjected to the AOM/DSS model (Fig. 7a) using 1% DSS per cycle. Representative images of EPCAM (white), IBA1 (green) and tdTomato (magenta) in tumor sections at d70 (scale bar 100 µm) (n = 3). c-e GFAPWtIL-1R1fl/fl and GFAPCreIL-1R1fl/fl mice were subjected to the AOM/DSS model (Fig. 7a). Tumors number and TAMs infiltration were assessed at d70. Tumor numbers of GFAPWtIL-1R1fl/fl and GFAPCreIL-1R1fl/fl littermates, representative images (left) and quantitative comparison of tumor numbers (right) (n = 14 mice per genotype) (c). Corresponding absolute numbers of SPP1+ and C1Q+ TAMs per mg tumor tissue (n = 7 GFAPWtIL-1R1fl/fl, n = 9 GFAPCreIL-1R1fl/fl) (d). Relative mRNA levels for Il6, normalized to the housekeeping gene Rpl32 in naive (n = 4) and AOM/DSS treated mice (n = 7 GFAPWtIL-1R1fl/fl, n = 5 GFAPCreIL-1R1fl/fl) (e). f GFAPCreAi14 fl/fl mice underwent the AOM/DSS model (Fig. 7a) using 1% DSS. Tumor or naive colon cells were isolated at d70 and FACS-sorted. Il6 expression levels of sorted tdTomatopos glial cells versus remaining tdTomatoneg cells of naive and AOM/DSS-treated GFAPCreAi14fl/fl mice (n = 4). Expression displayed as fold to Rpl32 and relative to naive tdTomatoneg cells. g SOX10CreERT2Ai14fl/fl mice were i.p. injected with Tamoxifen (1 mg in 100 µL sterile corn oil) on d–7, −6, and −5. Subsequently, mice were subjected to the AOM/DSS model (Fig. 7a) using 2% DSS per cycle. Representative image of tdTomato (magenta), IL-6 (green), and DAPI (blue) in tumor section at d70 (scale bar 100 µm) (n = 3). Data are represented as mean ± SEM (cf). Statistical analysis: unpaired two-tailed t-test (c), unpaired two-tailed Mann-Whitney test (d), and two-way ANOVA with correction for multiple comparisons (e, f). *p < 0.05, ***p < 0.0005, ns not significant. Source data and exact p values are provided as a Source Data file.
Fig. 8
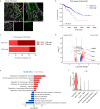
Fig. 8. IL-1R induced-CRC EGC phenotype in patients with CRC.
a Representative image showing S100 (magenta), CD68 (green) and Pancytokeratin (PANCK, white) in a human CRC tissue section (scale bar 200 µm and 50 µm). Image representative of ten stainings. b, c TCGA COAD and READ patients stratified based on their expression of the EGCs signature genes (n = 309 EGCs low, n = 67 EGCs high). Kaplan-Meier overall survival curve for EGCs high and low patients (b). The proportion of EGCs high and low patients classified based on high or low SPP1+ TAMs gene signature expression (c). d, e Transcriptome analysis of tumor EGCs in CRC patients (KUL3 Dataset, n = 5). Volcano plot of differentially expressed genes between healthy and tumor EGCs (d), highlighting genes defining the tumor EGCs signature. Gene Set Enrichment Analysis presenting GO terms of interest (e). f Violin plot showing expression of IL1B in the tumor-infiltrating myeloid cell clusters of human CRC in the KUL3 Dataset (n = 5). Statistical analysis: Mantel Cox test (b) and Wilcoxon test with Bonferroni correction using Seurat (d). Source data are provided as a Source Data file.

References

    1. Kuipers, E. J. et al. Colorectal cancer. Nat. Rev. Dis. Prim.1, 1–25 (2015). - PMC - PubMed
    1. AlMusawi, S., Ahmed, M. & Nateri, A. S. Understanding cell‐cell communication and signaling in the colorectal cancer microenvironment. Clin. Transl. Med.11, e308 (2021). 10.1002/ctm2.308 - DOI - PMC - PubMed
    1. Albo, D. et al. Neurogenesis in colorectal cancer is a marker of aggressive tumor behavior and poor outcomes. Cancer117, 4834–4845 (2011). 10.1002/cncr.26117 - DOI - PubMed
    1. Valès, S. et al. Tumor cells hijack enteric glia to activate colon cancer stem cells and stimulate tumorigenesis. EBioMedicine49, 172–188 (2019). 10.1016/j.ebiom.2019.09.045 - DOI - PMC - PubMed
    1. Yuan, R. et al. Enteric glia play a critical role in promoting the development of colorectal cancer. Front. Oncol.10, 1–12 (2020). 10.3389/fonc.2020.595892 - DOI - PMC - PubMed

MeSH terms

Grants and funding