. 2024 Aug;16(8):1791-1816.
doi: 10.1038/s44321-024-00098-y. Epub 2024 Jul 19.

PD-1/LAG-3 co-signaling profiling uncovers CBL ubiquitin ligases as key immunotherapy targets

Affiliations

PD-1/LAG-3 co-signaling profiling uncovers CBL ubiquitin ligases as key immunotherapy targets

Luisa Chocarro et al. EMBO Mol Med. 2024 Aug.

Abstract

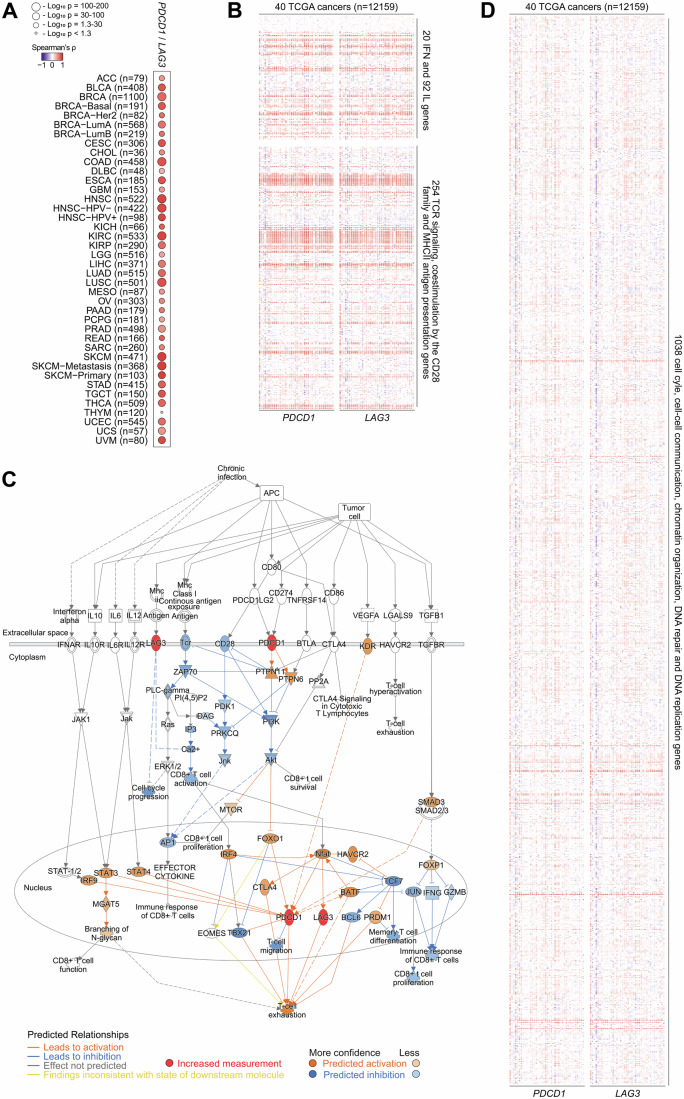
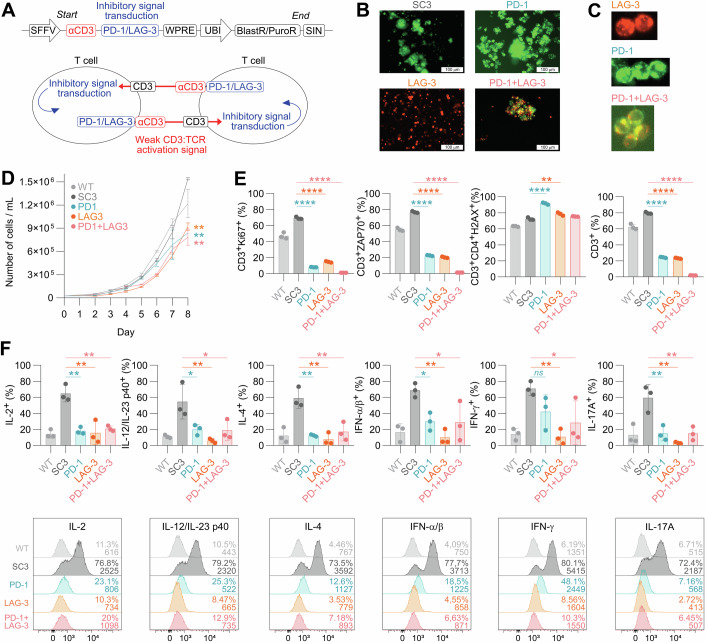
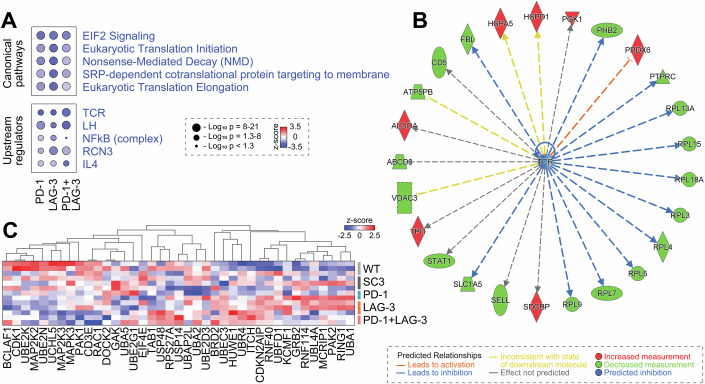
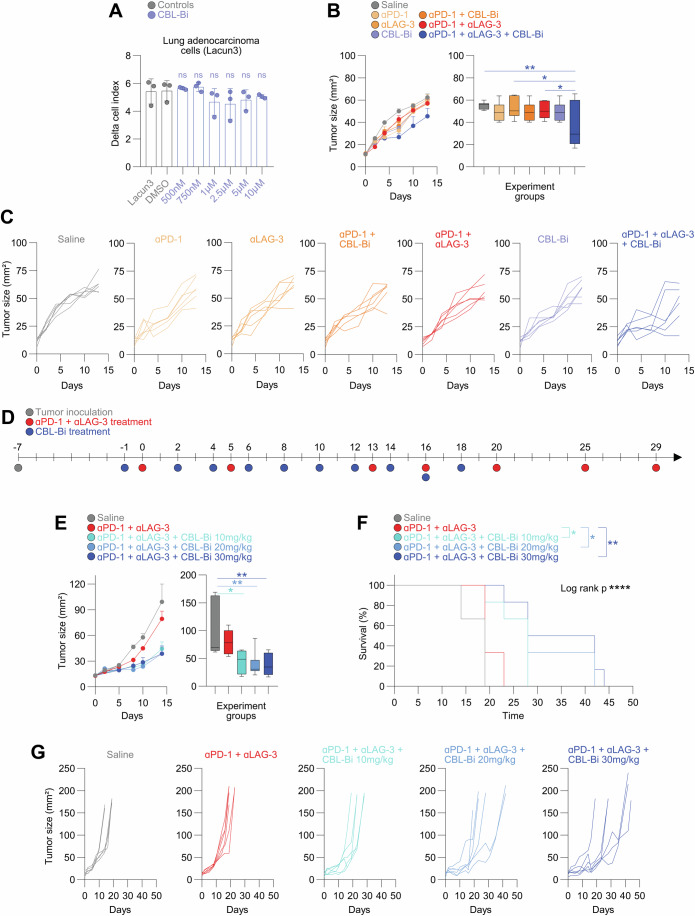
Many cancer patients do not benefit from PD-L1/PD-1 blockade immunotherapies. PD-1 and LAG-3 co-upregulation in T-cells is one of the major mechanisms of resistance by establishing a highly dysfunctional state in T-cells. To identify shared features associated to PD-1/LAG-3 dysfunctionality in human cancers and T-cells, multiomic expression profiles were obtained for all TCGA cancers immune infiltrates. A PD-1/LAG-3 dysfunctional signature was found which regulated immune, metabolic, genetic, and epigenetic pathways, but especially a reinforced negative regulation of the TCR signalosome. These results were validated in T-cell lines with constitutively active PD-1, LAG-3 pathways and their combination. A differential analysis of the proteome of PD-1/LAG-3 T-cells showed a specific enrichment in ubiquitin ligases participating in E3 ubiquitination pathways. PD-1/LAG-3 co-blockade inhibited CBL-B expression, while the use of a bispecific drug in clinical development also repressed C-CBL expression, which reverted T-cell dysfunctionality in lung cancer patients resistant to PD-L1/PD-1 blockade. The combination of CBL-B-specific small molecule inhibitors with anti-PD-1/anti-LAG-3 immunotherapies demonstrated notable therapeutic efficacy in models of lung cancer refractory to immunotherapies, overcoming PD-1/LAG-3 mediated resistance.

Keywords: CBL Ubiquitin Ligases; Cancer Immunotherapy; LAG-3; PD-1; T-cell Dysfunctionality.


Conflict of interest statement

CJE, JL and DE are inventors of the Humabody CB213 (WO/2019/158942. Crescendo Biologics Ltd.). The rest of the authors declare no competing interests.

Figures

Figure 1
Figure 1. Identification of the PDCD1/LAG3 tumor-infiltrate signature on human cancers.
(A) Heatmap of partial purity-adjusted Spearman’s correlates calculated with TIMER 2.0. between PDCD1 and LAG3 co-expression in the tumor-immune infiltration estimation of a total number of 12159 samples distributed on the indicated TCGA cancers. (B) Heatmap of partial purity-adjusted Spearman’s correlates calculated with TIMER 2.0. between PDCD1/LAG3 expression and selected immune genes including IFN, IL, TCR signaling, CD28 co-stimulatory family and MHCII antigen presentation in the tumor-immune infiltration estimation of a total number of 12159 samples distributed on the indicated TCGA cancers. Detailed information and statistical significance for each specific gene associated to the PDCD1/LAG3 gene signature is shown in Dataset EV1. (C) Predicted network describing the potential molecular interactions for the T-cell exhaustion pathway signaling and TCR downregulation associated to both PD-1 and LAG-3 co-upregulation. QIAGEN IPA algorithms were applied on data from curated publicly available datasets of RNA-seq, small RNA-seq, metabolomics, proteomics, microarrays including miRNA and SNP, and small-scale experiments (accessed on 2024). The specific legends to inter-nodal relationships are described in IPA (Ingenuity Pathway Analysis | QIAGEN Digital Insights). Key nodes are shown, and inter-nodal lines represent potential functional relationships between nodes. In red, upregulated input molecules as indicated (PD-1 and LAG-3). Blue lines, predicted inhibition; orange lines, predicted activation; grey indicates a predicted relationship with a non-predicted effect, and yellow lines, predicted relationship findings inconsistent with the state of the downstream molecule. (D) Heatmap of partial purity-adjusted Spearman’s correlates calculated with TIMER 2.0. between PDCD1/LAG3 expression and a selection of genes regulating cell cycle, gene expression and signaling in the tumor-immune infiltration estimation of a total number of 12,159 samples distributed on the indicated TCGA cancers. Detailed information and statistical significance for each specific gene associated to the PDCD1/LAG3 gene signature is shown in Dataset EV2. Source data are available online for this figure.
Figure 2
Figure 2. Expression of molecules with constitutive PD-1 and LAG-3 signaling functions in T cells.
(A) Top, molecular organization of the two genes made of an anti-CD3 single-chain antibody (SC3) coding sequence fused to LAG-3 or PD-1 stem-transmembrane-intracellular regions. Bottom, mode of action of the engineered molecules expressed by two neighbouring T-cells. The SC3 domain binds and delivers a weak signal to the corresponding TCR through CD3 binding. PD-1 and LAG-3 signaling domains deliver the corresponding inhibitory signals. (B) Fluorescence microscopy pictures of living T-cells expressing SC3-PD-1-GFP (green), SC3-LAG-3-Cherry (red) or both (yellow). (C) Detail of engaging T-cells expressing the constructs. Scale bars and inserts are indicated in the original pictures in the Source Data file for this figure panel. (D) Growth of T-cell lines expressing the indicated constructs (n = 2–5 independent counts). Relevant statistical comparisons between the cell lines and control cell lines are shown. (E) Bar graphs of T-cell percentages expressing the selected markers within the indicated T-cell lines (n = 3 independent repetitions). Error bars correspond to ±SD. (F) Bar graphs of T-cell percentages expressing the selected indicated cytokines within the T-cell lines shown in the graphs (n = 3 independent repetitions). Error bars correspond to ±SD. Flow cytometry histograms show a sample of the replicates, where percentage of expression and Mean Fluorescent Intensity values are indicated. Data information: Statistical comparisons are shown in the graph as indicated in Methods. Briefly, for (DF) statistical comparisons were carried out by a two-way ANOVA followed by pair-wise Tukey tests. Error bars correspond to ±SD. *, **, ***, indicate P < 0.05, P < 0.01 and P < 0.001 differences. ns, non-significant differences. Source data are available online for this figure.
Figure 3
Figure 3. Proteomes of T-cells with PD-1/LAG-3-regulated molecular pathways.
(A) Heatmap of regulated proteins from Jurkat T-cell lines with active PD-1, LAG-3 pathways, or their combination, together with unmodified and SC3 cell lines as controls. Heatmap tree structures represent hierarchical clustering based on Euclidean distances. Red, z-score > 0; blue, z-score < 0. p ≤ 0.05 proteins are plotted. (B) Top 10 enriched canonical pathways associated with the differential proteomic profiles. (C) Top 5 enriched molecular and cellular functions associated with the differential proteomic profiles. (D) Top 5 predicted upstream regulators associated with the differential proteomic profiles. (E) Venn diagram of differentially regulated proteins in the indicated T-cell lines compared to SC3 control cells as a common standard. 35 common proteins were regulated for all conditions. (F) Heatmap of expression of the 35 common proteins as in (E) within the proteomes of all T-cell lines. (G) Column graphs for the top 5 predicted upstream regulators (left) and enriched canonical pathways (right) associated with the 35 commonly regulated proteins. z-scores represent predicted activation (red, z-score > 0) or inhibition (blue, z-score < 0). For white, z-score = 0. (H) Percentage of YY1 expression in healthy donors (n = 5), NSCLC anti-PD-1/anti-PD-L1 immunotherapy responders (n = 10), and non-responders (n = 12) peripheral-blood T cells before treatment and post-TAC timepoints. One-way ANOVA test was used for multi-comparisons, followed by a posteriori Tukey’s pair-wise comparisons. Box and whiskers plot with min to max values are plotted, computing the minimum, maximum, median and quartiles. The box extends from the 25th to 75th percentiles. The whiskers go down to the smallest value and up to the largest. (I) Flow cytometry histograms of CD3 and DDXD21 expression in PD-1, LAG-3, and PD-1 + LAG-3 Jurkat T-cell lines. Percentage of expression and Mean Fluorescence Intensity values are indicated. (J) Bar graphs of transcriptional transactivation of the indicated gene promoters identified as regulated by PD-1/LAG-3 signaling in T-cell lines. Promoters expressing GFP were introduced by lentivector transduction in T-cell lines expressing constitutively active PD-1, LAG-3 or PD-1 + LAG-3 molecules as indicated. Transactivation was quantified by GFP expression. Means from 3 independent repetitions are shown, together with standard deviations as error bars. Error bars correspond to ±SD. Data information: Statistical comparisons are shown in the graph as indicated in Methods. Briefly, for (H) one-way ANOVA was used for multi-comparisons, followed by a posteriori Tukey’s pair-wise comparisons. *, indicate P < 0.05, ns, non-significant differences. For (B, C, D, G), QIAGEN IPA algorithms were used (accessed on 2024), applied on data from curated publicly available datasets of RNA-seq, small RNA-seq, metabolomics, proteomics, microarrays including miRNA and SNP, and small-scale experiments. IPA utilizes two scores for inference; P-values from a Fisher’s exact test to obtain an enrichment score, and a z-score to assess the match of observed and predicted regulation patterns. Source data are available online for this figure.
Figure 4
Figure 4. Molecular dysfunctionality programme in T-cells by PD-1/LAG-3 co-signaling.
(A) Enriched canonical pathways and identified upstream regulators. z-scores represent predicted activation (red, z-score > 0), inhibition (blue, z-score < 0). (B) Potential regulation of key functional targets linked to TCR downregulation within the PD-1 + LAG-3 proteome. IPA analysis identified TCR predicted inhibition as an upstream regulator of PD-1, LAG-3 and PD-1 + LAG-3 T-cell proteomes (accessed on 2024). The graph shows relationships between the predicted inhibited TCR (in the centre in blue) and differential expression of the identified proteins in the PD-1 + LAG-3 proteome. In red, upregulated proteins. In green, downregulated proteins. Blue lines, predicted inhibition; orange lines, predicted activation; grey indicates a predicted relationship with a non-predicted effect, and yellow lines, predicted relationship findings inconsistent with the state of the downstream molecule. The specific legends to inter-nodal relationships are described in IPA (Ingenuity Pathway Analysis | QIAGEN Digital Insights). (C) Heatmap of statistically significant differential interactors of the E3 ubiquitin signaling pathway within the indicated T-cell proteomes. Red, significantly upregulated proteins; Blue, significantly downregulated proteins. Heatmap tree structures represent hierarchical clustering based on Euclidean distances. Data information: Statistical comparisons are shown in the graph as indicated in Methods. For (A, B), QIAGEN IPA algorithms were used (accessed on 2024), applied on data from curated publicly available datasets of RNA-seq, small RNA-seq, metabolomics, proteomics, microarrays including miRNA and SNP, and small-scale experiments. IPA utilizes two scores for inference; P-values from a Fisher’s exact test to obtain an enrichment score, and a z-score to assess the match of observed and predicted regulation patterns. Source data are available online for this figure.
Figure 5
Figure 5. CBL E3 ubiquitin ligases as targets for PD-1/LAG-3 co-blockade.
(A) Single-cell sequencing analysis of biopsies from non-small cell lung cancer (NSCLC) patients. Panels indicate the expression of PDCD1, LAG3 and CBLB and CBLC analyzed from the single-cell lung cancer extended atlas (LuCA) (Salcher et al, 2022) repository as indicated. (B) Dot plot with the percentage of CD4 and CD8 T-cells that co-express PD-1 and LAG-3 after ex vivo activation, from healthy donors (n = 8) and NSCLC patients (n = 10). Statistical comparisons were performed by the Mann–Whitney test. Error bars correspond to ±SD (C) CBL-B expression by mean fluorescent intensities in CD4 and CD8 T-cells from a sample of non-responder NSCLC patients (n = 4), activated ex vivo in the presence of the indicated treatments. Shown data from total CD4 and CD8 gated populations. Statistical comparisons were carried out by a two-way ANOVA to eliminate inter-patient variability followed by pair-wise Tukey tests. Box and whiskers with min to max values are plotted, computing the minimum, maximum, median and quartiles. The box extends from the 25th to 75th percentiles. The whiskers go down to the smallest value and up to the largest. (D) Same as (C) but for C-CBL expression. Box and whiskers with min to max values are plotted, computing the minimum, maximum, median and quartiles. The box extends from the 25th to 75th percentiles. The whiskers go down to the smallest value and up to the largest. (E) Percentage of proliferating CD4 T cells (left) and CD8 T cells (right) from a sample of high PD-1/LAG-3 co-expression patients before starting immunotherapy, activated ex vivo by A549-SC3 cells in the presence of the indicated antibodies. Statistical comparisons were carried out by a two-way ANOVA to eliminate inter-patient variability followed by pair-wise Tukey tests (n = 5). Box and whiskers with min to max values are plotted, computing the minimum, maximum, median and quartiles. The box extends from the 25th to 75th percentiles. The whiskers go down to the smallest value and up to the largest. (F) Flow cytometry histograms of SATB1, Phospho SMAD 2/3, LCK and ZAP70 expression. Gates were established according to unstained controls in T-cells from a sample of non-responder NSCLC patients. Percentage of expression and Mean Fluorescence Intensity values are indicated. Data information: Statistical comparisons are shown in the graph as indicated in Methods. Briefly, for (B) statistical comparisons were performed by the Mann–Whitney test. For (CE), statistical comparisons were carried out by a two-way ANOVA to eliminate inter-patient variability followed by pair-wise Tukey tests. Error bars correspond to ±SD. **, ***, ****, indicate P < 0.01, P < 0.001 and P < 0.0001 differences. Source data are available online for this figure.
Figure 6
Figure 6. PD-1, LAG-3 and CBL-B triple blockade has significant therapeutic antitumor effect.
(A) Real-Time Quantitative Cell Analysis (RTCA) of Lung adenocarcinoma (Lacun3) cells incubated for 70 h with growing concentrations of CBL-B inhibitor (CBL-Bi) as indicated. Error bars correspond to ±SD. Statistical comparisons were carried out by a two-way ANOVA followed by pair-wise Tukey tests (n = 3 independent cultures). (B) Mean tumor size following the indicated treatments (left). Tumor volumes 10 days after treatment initiation (right). Error bars correspond to ±SEM (left) and box and whiskers with min to max values (right), computing the minimum, maximum, median and quartiles. The box extends from the 25th to 75th percentiles. The whiskers go down to the smallest value and up to the largest (n = 6 mice per group). Briefly, BALB/c female mice were randomly allocated and subcutaneously injected with 2 × 10⁶ Lung adenocarcinoma (Lacun3) cells per animal. When tumor growth reached an average diameter of 3.5 mm (day 0), 100 µg of anti-PD-1 mAb and 100 µg of anti-LAG3 mAb were administered intraperitoneally (i.p) at days 0, 5 and 13. Control mice received the same volume of saline. Some groups of mice received 30 mg/kg of CBL-bi at days −1, 2, 4, 6, 8, 10 and 12. As negative control, the same volume of saline was injected. Mice were humanely sacrificed at day 14. Statistical comparisons were carried out by a two-way ANOVA followed by pair-wise Tukey tests. (C) Tumor growth of individual mice in the indicated treatment groups (n = 6 mice per group). (D) Schematic design of the experiment. BALB/c female mice were randomly allocated and subcutaneously injected with 2 × 10⁶ Lung adenocarcinoma (Lacun3) cells per animal. When tumor growth reached an average diameter of 3.5 mm (day 0), 100 µg of anti-PD-1 and 100 µg of anti-LAG3 were administered intraperitoneally at days 0, 5, 13, 16, 20, 25 and 29. Control mice received the same volume of saline. Some groups of mice received 10 mg/kg, 20 mg/kg and 30 mg/kg of CBL-Bi at days −1, 2, 4, 6, 8, 10, 12, 14, 16 and 18. As negative control, the same volume of saline was injected. The two perpendicular tumor diameters were measured every two days. Mice were humanely sacrificed when tumor size reached ~150–200 mm2, or when tumor ulceration or discomfort were observed. (E) Evolution of mean tumor size following the indicated treatments (left). Tumor volumes 14 days after treatment initiation (right). Error bars correspond to ±SEM (left) and box and whiskers with min to max values (right), computing the minimum, maximum, median and quartiles. The box extends from the 25th to 75th percentiles. The whiskers go down to the smallest value and up to the largest (n = 6 mice per group). Statistical comparisons were carried out by a two-way ANOVA followed by pair-wise Tukey tests. (F) Kaplan–Meier survival plot of mice under the indicated treatments (percent). Statistical significance was tested with the Log-rank test. (G) Tumor growth of individual mice in the indicated treatment groups (n = 6 mice per group). Data information: Statistical comparisons are shown in the graph as indicated in Methods. Briefly, for (A, B, E), statistical comparisons were carried out by a two-way ANOVA followed by pair-wise Tukey tests. For (F), Survival was represented by Kaplan–Meier plots and analyzed by log-rank test. *, **, ****, indicate P < 0.05, P < 0.01 and P < 0.0001 differences. Source data are available online for this figure.
Figure 7
Figure 7. CD8 T cells are responsible for the PD-1, LAG-3 and CBL-B triple blockade significant therapeutic antitumor effect.
(A) Schematic design of the experiment. BALB/c female mice were randomly allocated and subcutaneously injected with 2 × 10⁶ Lung adenocarcinoma (Lacun3) cells per animal. 100 µg of anti-PD-1, 100 µg of anti-LAG3, 30 mg/kg of CBL-Bi and the corresponding depletion antibodies were administered intraperitoneally at days 0, 2, 6, 9, 13 and 15 as indicated in the figure. NK, CD4, and CD8 T‐cell depletions were carried out by intraperitoneal administration of 100 μg of anti‐mouse CD8a, CD4 or NK1.1 antibody. Mice were humanely sacrificed when tumor size reached ~150–200 mm2, or when tumor ulceration or discomfort were observed. (B) Kaplan–Meier survival plot of mice under the indicated treatments or depletion (percent). Statistical significance was tested with the Log-rank test. (C) Evolution of mean tumor size following the indicated treatments (left). Tumor volumes 9 days after treatment initiation (right). Error bars correspond to ±SEM (left) and box and whiskers with min to max values (right), computing the minimum, maximum, median and quartiles for 25th and 75th percentiles. The whiskers go down to the smallest value and up to the largest (n = 6 mice per group). Data information: Statistical comparisons were carried out by a two-way ANOVA followed by pair-wise Tukey tests. (D) Tumor growth of individual mice in the indicated treatment groups (n = 6 mice per group). Statistical comparisons are shown in the graph as indicated in Methods. Data information: Briefly, for (B), survival was represented by Kaplan–Meier plots and analyzed by log-rank test. For (C), statistical comparisons were carried out by a two-way ANOVA followed by pair-wise Tukey tests. *, **, ****, indicate P < 0.05, P < 0.01, and P < 0.0001 differences. Source data are available online for this figure.
Figure EV1
Figure EV1. Correlation of PDCD1 and LAG3 expression with immune cell infiltrates.
(A) Heatmap of partial purity-adjusted Spearman’s correlates calculated with TIMER 2.0. between PDCD1/LAG3 expression and lymphoid infiltrates in a total number of 12159 samples distributed on TCGA cancers. (B) Heatmap of partial purity-adjusted Spearman’s correlates calculated with TIMER 2.0. between PDCD1/LAG3 expression and non-lymphoid infiltrates in a total number of 12159 samples distributed on TCGA cancers.
Figure EV2
Figure EV2. Regulatory networks and causal relationships associated with PD-1/LAG-3 signature.
(A) Identified enriched canonical pathways and upstream regulators for the upregulation of PD-1/LAG-3 and combinations. (B) Identified enriched molecular and cellular functions for the upregulation of PD-1/LAG-3 and combinations. (C) Identified enriched diseases and disorders for the upregulation of PD-1/LAG-3 and combinations. (D) Predicted regulatory interactomes and associated networks with the indicated PD-1 and LAG-3 signatures. Key nodes are shown, and inter-nodal lines represent functional relationships between nodes. In red, upregulated input molecules as indicated (PD-1 and LAG-3). In blue, downregulated input molecules as indicated (PD-1 and LAG-3). Blue lines, predicted inhibition; orange lines, predicted activation; grey indicates a predicted relationship with a non-predicted effect, and yellow lines, predicted relationship findings inconsistent with the state of the downstream molecule. (E) Heatmap of partial purity-adjusted Spearman’s correlates calculated with TIMER 2.0. between PDCD1/LAG3 expression and a selection of genes regulating identified by IPA of a total number of 12159 samples distributed on the indicated TCGA cancers. Data information: For (AD), QIAGEN IPA algorithms were used (accessed on 2024), applied on data from curated publicly available datasets of RNA-seq, small RNA-seq, metabolomics, proteomics, microarrays including miRNA and SNP, and small-scale experiments. IPA utilizes two scores for inference; P-values from a Fisher’s exact test to obtain an enrichment score, and a Z-score to assess the match of observed and predicted regulation patterns.
Figure EV3
Figure EV3. Proteomes of T-cells with PD-1/LAG-3-regulated pathways.
(A) Circo plot representing the overlap from the input proteome dataset lists. Upper circle: On the outside, each arc represents the identity of each proteome. On the inside, each arc represents a list, where each gene has a spot on the arc. Dark orange color represents the proteins that appear in multiple lists and light orange color represents proteins that are unique to that list. Purple lines link the same protein that are shared by multiple lists. Above circle: On the outside, same as upper circle. On the inside, each arc represents a list, where each gene has a spot on the arc. Dark orange color represents the molecules that appear in multiple lists and light orange color represents molecules that are unique to that list. Purple lines link the same gene that are shared by multiple lists. Blue lines link the different genes where they fall into the same ontology term (the term has to statistically significantly enriched and with size no larger than 100). Blue links indicate the degree of functional overlap among the input lists. (B) Volcano plots and heatmap with the number of differentially regulated proteins in PD-1, LAG-3, and PD-1 + LAG-3 Jurkat T-cell lines compared to SC3 control cells (p-value ≤ 0.05) for upregulated (Red, Log2 (Fold Change) ≥ 0.38) and downregulated (Blue, Log2 (Fold Change) ≤ −0.38) proteins. Blue: significantly downregulated, red: significantly downregulated. Grey: not significantly regulated. (C) Heatmaps of differential protein expression in the PD-1 + LAG-3 proteomic dataset compared with the proteome of the SC3-Jurkat control cell line. Red, significantly upregulated proteins (p-value ≤ 0.05, Log2 (Fold Change) ≥ 0.38); blue, significantly downmodulated proteins (p-value ≤ 0.05, Log2 (Fold Change) ≤ −0.38). Relevant T-cell pathways and functions are indicated on top. Specific targets are indicated on the right. (D) Identified enriched molecular and cellular functions for the PD-1/LAG-3 proteomes. (E) Identified enriched diseases and disorders for the PD-1/LAG-3 proteomes. Data information: Statistical comparisons are shown in the graph as indicated in Methods. For (B, C), Perseus was used for statistical analyses. An unpaired Student t-test was used for direct comparisons between two groups of samples. Differential PD-1/LAG-3 proteins versus the SC3 control condition comparisons were identified, following p-value ≤ 0.05, Log2 (Fold Change) ≥ 0.38 and Log2 (Fold Change) ≤ −0.38 criteria. For (D, E), QIAGEN IPA algorithms were used (accessed on 2024), applied on data from curated publicly available datasets of RNA-seq, small RNA-seq, metabolomics, proteomics, microarrays including miRNA and SNP, and small-scale experiments. IPA utilizes two scores for inference; P-values from a Fisher’s exact test to obtain an enrichment score, and a Z-score to assess the match of observed and predicted regulation patterns", as indicated in the rest of the legends. It is lacking the last part of the sentence by mistake, sorry for the inconvenience. Source data are available online for this figure.
Figure EV4
Figure EV4. Proteomic interactome networks associated to constitutive activation of PD-1/LAG-3 in Jurkat T-cell lines, generated by IPA.
Top networks describing potential molecular interactions of the 35 commonly regulated dataset molecules associated to the 35 commonly regulated proteins. In red, upregulated proteins. In green, downregulated proteins. Blue lines, predicted inhibition; orange lines, predicted activation; grey indicates a predicted relationship with a non-predicted effect, and yellow lines, predicted relationship findings inconsistent with the state of the downstream molecule. The specific legends to inter-nodal relationships are described in IPA (Ingenuity Pathway Analysis | QIAGEN Digital Insights). QIAGEN IPA algorithms were used (accessed on 2024), applied on data from curated publicly available datasets of RNA-seq, small RNA-seq, metabolomics, proteomics, microarrays including miRNA and SNP, and small-scale experiments. IPA utilizes two scores for inference; P-values from a Fisher’s exact test to obtain an enrichment score, and a Z-score to assess the match of observed and predicted regulation patterns.

References

    1. Aggarwal V, Workman CJ, Vignali DAA (2023) LAG-3 as the third checkpoint inhibitor. Nat Immunol 24:1415–1422 10.1038/s41590-023-01569-z - DOI - PMC - PubMed
    1. Arasanz H, Gato-Canas M, Zuazo M, Ibanez-Vea M, Breckpot K, Kochan G, Escors D (2017) PD1 signal transduction pathways in T cells. Oncotarget 8:51936–51945 10.18632/oncotarget.17232 - DOI - PMC - PubMed
    1. Arasanz H, Zuazo M, Bocanegra A, Gato M, Martinez-Aguillo M, Morilla I, Fernandez G, Hernandez B, Lopez P, Alberdi N et al (2020) Early detection of hyperprogressive disease in non-small cell lung cancer by monitoring of systemic T cell dynamics. Cancers 12:344 10.3390/cancers12020344 - DOI - PMC - PubMed
    1. Bachmaier K, Krawczyk C, Kozieradzki I, Kong YY, Sasaki T, Oliveira-dos-Santos A, Mariathasan S, Bouchard D, Wakeham A, Itie A et al (2000) Negative regulation of lymphocyte activation and autoimmunity by the molecular adaptor Cbl-b. Nature 403:211–216 10.1038/35003228 - DOI - PubMed
    1. Baraibar I, Roman M, Rodriguez-Remirez M, Lopez I, Vilalta A, Guruceaga E, Ecay M, Collantes M, Lozano T, Alignani D et al (2020) Id1 and PD-1 Combined Blockade impairs tumor growth and survival of KRAS-mutant lung cancer by stimulating PD-L1 expression and tumor infiltrating CD8(+) T cells. Cancers 12:3169 10.3390/cancers12113169 - DOI - PMC - PubMed

MeSH terms

Substances

Grants and funding

LinkOut - more resources