. 2025 Jan;21(1):91-99.
doi: 10.1038/s41589-024-01680-8. Epub 2024 Jul 19.

Lysine L-lactylation is the dominant lactylation isomer induced by glycolysis

Affiliations

Lysine L-lactylation is the dominant lactylation isomer induced by glycolysis

Di Zhang et al. Nat Chem Biol. 2025 Jan.

Abstract

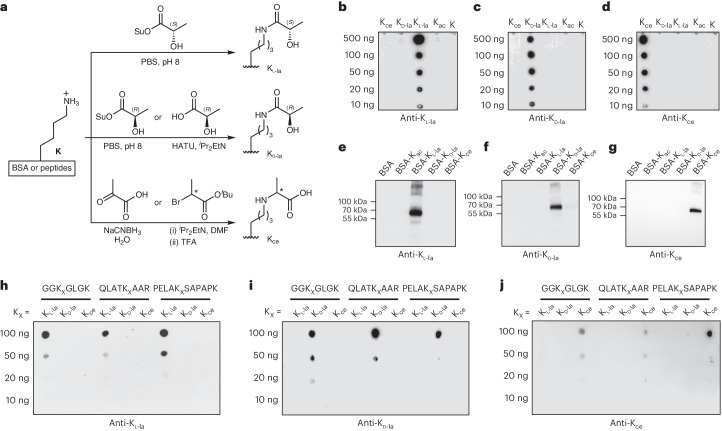
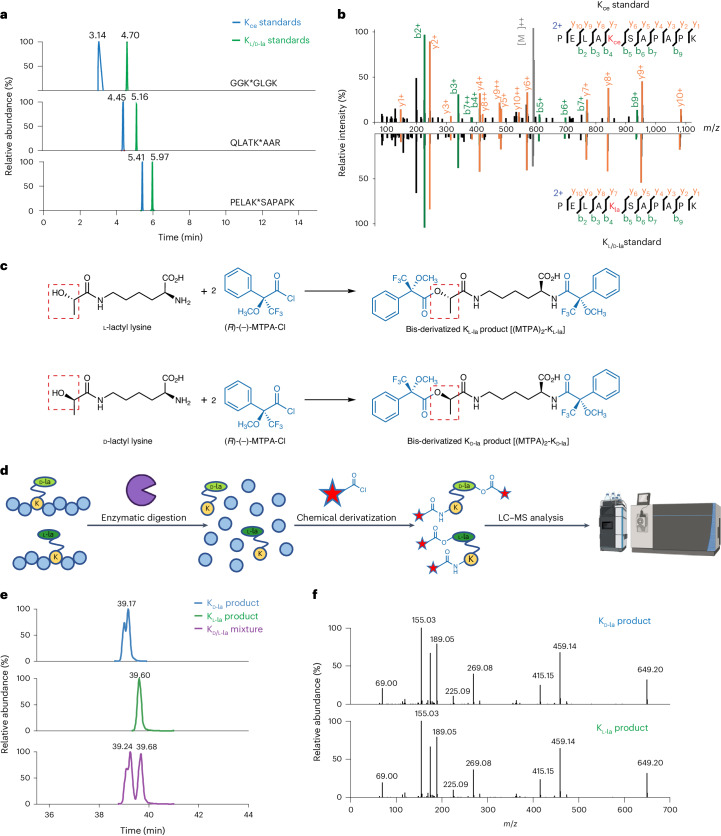
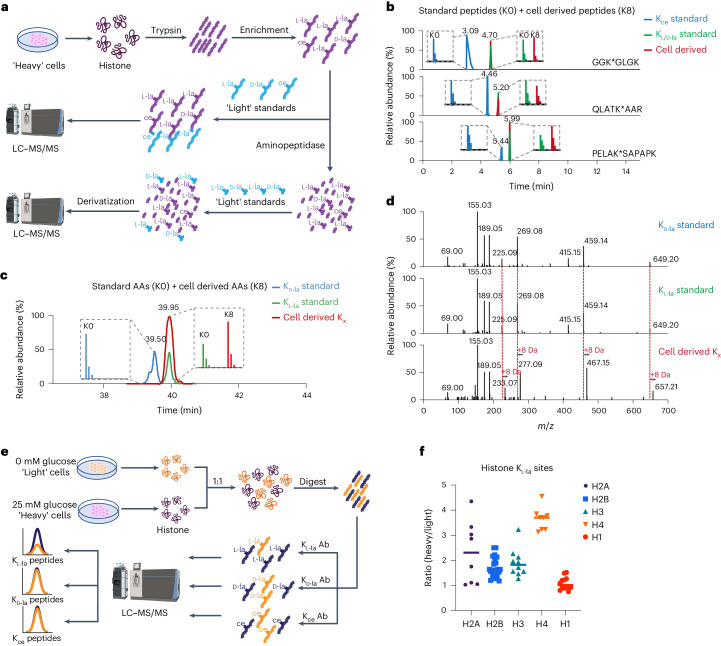
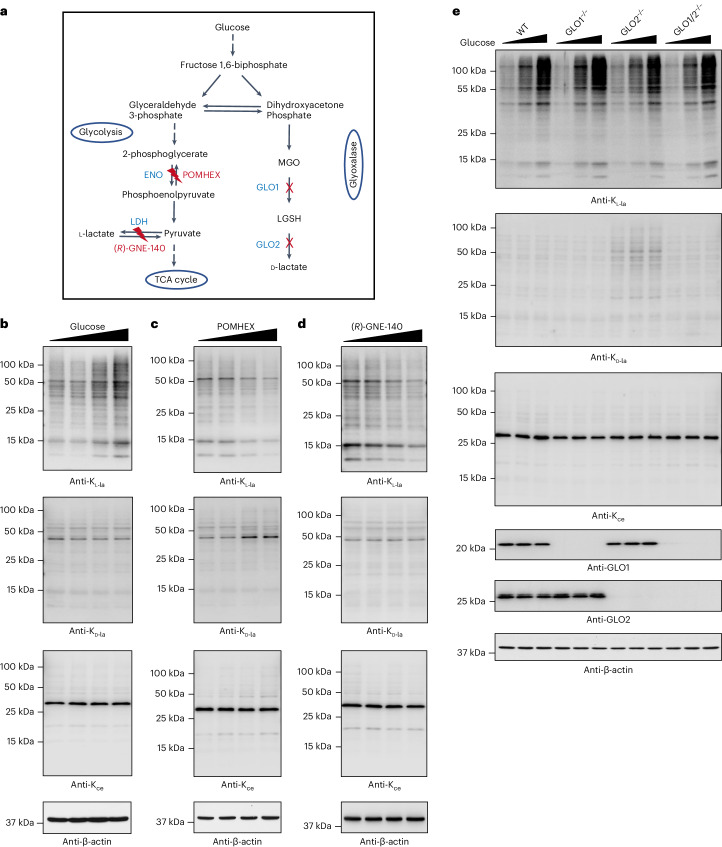
Lysine L-lactylation (Kl-la) is a novel protein posttranslational modification (PTM) driven by L-lactate. This PTM has three isomers: Kl-la, N-ε-(carboxyethyl)-lysine (Kce) and D-lactyl-lysine (Kd-la), which are often confused in the context of the Warburg effect and nuclear presence. Here we introduce two methods to differentiate these isomers: a chemical derivatization and high-performance liquid chromatography analysis for efficient separation, and isomer-specific antibodies for high-selectivity identification. We demonstrated that Kl-la is the primary lactylation isomer on histones and dynamically regulated by glycolysis, not Kd-la or Kce, which are observed when the glyoxalase system was incomplete. The study also reveals that lactyl-coenzyme A, a precursor in L-lactylation, correlates positively with Kl-la levels. This work not only provides a methodology for distinguishing other PTM isomers, but also highlights Kl-la as the primary responder to glycolysis and the Warburg effect.


Conflict of interest statement

Competing interests: Y.Z. is a founder, board member or advisor to and inventor on patents licensed to PTM Bio Inc. (Hangzhou, China and Chicago, IL, USA) and Maponos Therapeutics Inc. (Chicago, IL, USA). The other authors declare no competing interests.

Figures

Fig. 1
Fig. 1. Kl-la, Kd-la and Kce are structural isomers that are associated with glycolysis.
A schematic overview delineating the metabolic relationship between glycolysis and the structural isomers Kl-la, Kd-la and Kce. It includes the chemical structures of these isomers, emphasizing their distinct molecular configurations and how they are produced through the glycolytic pathway.
Fig. 2
Fig. 2. PTM-specific antibodies can distinguish Kl-la, Kd-la and Kce.
a, A schematic diagram illustrating the process of generating PTM-specific compounds used for immunoblotting assays, with detailed procedures available in Methods and Supplementary Information. bj, Immunoblots titrating the antibodies’ specificities against various PTM-specific antigens, including synthetic peptide libraries (Kl-la (b), Kd-la (c), Kce (d)), BSA derivatives (Kl-la (e), Kd-la (f), Kce (g)) and synthetic sequence-specific histone peptides with the indicated modifications (Kl-la (h), Kd-la (i), Kce (j)). These blots represent consistent results from at least three independent repetitions. The peptide libraries are structured with 13 residues in the pattern CXXXXKXXXXX, where ‘X’ represents a mixture of 19 amino acids (excluding cysteine), ‘C’ represents cysteine and the sixth position is a lysine that can be either unmodified or modified with Kl-la, Kd-la, Kce or Kac (acetylation).
Fig. 3
Fig. 3. Separating Kl-la-, Kd-la- and Kce-containing peptides by HPLC–MS/MS.
a, Extracted ion chromatograms showing the separation of peptides containing Kl-la, Kd-la or Kce modifications. Synthetic peptide standards GGK*GLGK, QLATK*AAR and PELAK*SAPAPK were used, with the asterisk indicating the modified lysine. b, High-resolution MS/MS spectra of the PELAK*SAPAPK peptide, modified by either Kce or Kl/d-la. These spectra reveal that both modifications have the same precursor ion mass and fragmentation patterns. c, A schematic diagram illustrating the chemical derivatization reactions between l-lactyl lysine (Kl-la) or d-lactyl lysine (Kd-la) and MTPA-Cl, resulting in (MTPA)2-Kl-la and (MTPA)2-Kd-la products, respectively. d, A workflow diagram showing the process of digesting peptides into individual amino acids, chiral derivatization and subsequent LC–MS/MS analysis for Kl-la and Kd-la. e, Extracted ion chromatograms depicting the separation profiles of derivatized Kd-la, Kl-la and their mixtures. f, High-resolution MS/MS spectra of derivatization products of Kl-la and Kd-la, showing identical fragmentation patterns.
Fig. 4
Fig. 4. Kl-la is the prevalent PTM on cellular histones.
a, A workflow for analyzing Kl-la, Kd-la and Kce on cellular histones. Histones were extracted from cultured human MCF-7 cells, which were labeled with heavy isotopes (K8 or l-Lys-13C6, 15N2). These histones were digested with trypsin, and the resulting peptides containing the target PTMs were enriched using a mixture of pan anti-Kl-la, pan anti-Kd-la and pan anti-Kce antibodies to enhance detection sensitivity. b, The enriched peptides were spiked with light standard peptides (K0 or l-Lys-12C6,14N2) and analyzed by LC–MS/MS. The standard peptide sequences are GGK*GLGK, QLATK*AAR and PELAK*SAPAPK, with the asterisk marking the modified lysine residue. The extracted ion chromatograms indicate the presence of Kl/d-la modifications but not Kce in the cell-derived histone peptides. The coelution of cell-derived peptides with the modified standards confirms the presence of Kl/d-la. c, The enriched peptides were further digested into individual amino acids (cell-derived AAs, K8), spiked with light Kl-la and Kd-la standards (standard AAs, K0), and derivatized with MTPA-Cl before undergoing LC–MS/MS analysis. The extracted ion chromatograms reveal Kl-la is present in the cell-derived histone peptides, while Kd-la is absent. d, High-resolution MS/MS spectra verifying identical fragmentation patterns between cell-derived KL-la and synthetic light standards, with an 8 Da mass shift due to the heavy isotopic lysine backbone. e, A workflow for analyzing histone Kl-la, Kd-la and Kce in response to glycolysis. MCF-7 cells were cultured under different glucose conditions and labeled with isotopes. Histones were extracted and digested and the peptides containing the PTMs were enriched separately and quantified using LC–MS/MS. f, LC–MS/MS quantification results indicate that a high glucose concentration induced Kl-la on most core histones sites (H2A, H2B, H3 and H4), but not on linker histone H1. The heavy to light ratio was normalized to protein abundance.
Fig. 5
Fig. 5. Differential regulation of global Kl-la, Kd-la and Kce by glycolysis.
a, A schematic of enzymes and inhibitors that influence metabolite production related to these modifications, including ENO, LDH, GLO1 (glyoxalase 1), GLO2 (glyoxalase 2), POMHEX (ENO inhibitor) and (R)-GNE-140 (LDH inhibitor). be, Western blots showing the effects of varying glucose concentrations (b), POMHEX (c), (R)-GNE-140 (d) and glyoxalase deletion (e) on these modifications in MCF-7 cells and HEK293T cells. The following treatments were used: glucose 0.1, 1, 5 and 25 mM (b); POMHEX 0, 0.1, 0.5 and 2.5 µM (c); (R)-GNE-140 0, 0.5, 2.5 and 10 µM (d) and glucose 1, 5 and 25 mM (e). β-Actin served as a control across all blots. Results are consistent across three independent experiments. Source data
Fig. 6
Fig. 6. Lactyl-CoA is positively correlated with Kl-la in response to glycolysis.
a, The chemical structure of lactyl-CoA with four MS2 fragments identified through high-resolution nano-HPLC–MS/MS analysis. b, The tandem mass spectrum of lactyl-CoA from HepG2 cells is presented, showing characteristic fragmentation ions and the precursor ion with a molecular weight of 840.1519 Da. c,d, Incorporation of 13C3 l-lactate (c) and 13C6 d-glucose (d) into lactyl-CoA and other metabolites in HepG2 cells. e,f, Lactyl-CoA concentrations were measured using LC–MS/MS, and global Kl-la levels were determined via western blots in wild-type HepG2 cells with or without 2.5 µM POMHEX treatment (e), as well as in HepG2 cells with a deletion of both LDHA and LDHB (f). n = 4 biological replicates. The data are presented as mean values ± s.e.m. Statistical significance was determined using a two-tailed Student’s t-test. Source data
Extended Data Fig. 1
Extended Data Fig. 1. Loading controls and purity assessments for modified BSA and synthesized KL-la-containing histone peptides.
Related to Fig. 2. a-d) Repeated dot blots from Fig. 2b–d, with Colloidal Silver Staining to demonstrate equal loading (d). e) SDS-PAGE and Coomassie blue staining showing the purities of unmodified BSA and BSA samples modified with KL-la, KD-la, Kce, or Kac. This data represents consistent results from at least three independent repetitions. f-i) Chromatography results confirming the purity of synthesized peptides GGKL-laGLGK (f), PELAKL-laSAPAPK (g), and QLATKL-laAAR (h). Notably, in panel h, the first peak corresponds to the correctly synthesized peptide QLATKL-laAAR, while the second peak suggests ammonia loss from glutamine during peptide storage. i) High-resolution MS/MS spectra of the peptide *QLATKL-laAAR, showing the fragmentation pattern and confirming the ammonia loss from glutamine as indicated by the second peak in panel h. The asterisk preceding ‘Q’ in the peptide sequence denotes this modification.
Extended Data Fig. 2
Extended Data Fig. 2. MS/MS spectra of two synthetic KL/D-la- and Kce- containing histone peptides.
Related to Fig. 3. High-resolution MS/MS spectra of the synthetic peptide standards GGK*GLGK (a) and QLATK*AAR (b), each modified by Kce (top) and KL/D-la (bottom). These spectra confirm that peptides with these modifications have the same precursor ion mass and display identical MS/MS fragmentation patterns.
Extended Data Fig. 3
Extended Data Fig. 3. Identification and verification of a KL/D-la-containing histone H2B peptide.
Related to Fig. 4. The high-resolution MS/MS spectrum in panel a presents a cell-derived histone peptide, PELAKlaSAPAPK, labeled with heavy isotopes (L-Lys-13C6, 15N2). This cell-derived peptide is compared against synthetic standard peptides containing Kce or KL/D-la, labeled with light isotopes (L-Lys-12C6, 14N2), as shown in panels b and c, respectively. The comparison reveals that both the cell-derived peptide and the synthetic peptides with the modifications of interest exhibit similar MS/MS fragmentation patterns and precursor ion masses. The only difference observed is the mass shift attributable to the isotope labeling. The specific m/z values of the precursor ions are displayed in the insets of the spectra.
Extended Data Fig. 4
Extended Data Fig. 4. Identification and verification of a KL/D-la-containing histone H3 peptide.
Related to Fig. 4. The high-resolution MS/MS spectrum in panel a presents a cell-derived histone peptide, QLATKlaAAR, labeled with heavy isotopes (L-Lys-13C6, 15N2). This cell-derived peptide is compared against synthetic standard peptides containing Kce or KL/D-la, labeled with light isotopes (L-Lys-12C6, 14N2), as shown in panels b and c, respectively. The comparison reveals that both the cell-derived peptide and the synthetic peptides with the modifications of interest exhibit similar MS/MS fragmentation patterns and precursor ion masses. The only difference observed is the mass shift attributable to the isotope labeling. The specific m/z values of the precursor ions are displayed in the insets of the spectra.
Extended Data Fig. 5
Extended Data Fig. 5. Identification and verification of a KL/D-la-containing histone H4 peptide.
Related to Fig. 4. The high-resolution MS/MS spectrum in panel a presents a cell-derived histone peptide, GGKlaGLGK, labeled with heavy isotopes (L-Lys-13C6, 15N2). This cell-derived peptide is compared against synthetic standard peptides containing Kce or KL/D-la, labeled with light isotopes (L-Lys-12C6, 14N2), as shown in panels b and c, respectively. The comparison reveals that both the cell-derived peptide and the synthetic peptides with the modifications of interest exhibit similar MS/MS fragmentation patterns and precursor ion masses. The only difference observed is the mass shift attributable to the isotope labeling. The specific m/z values of the precursor ions are displayed in the insets of the spectra.
Extended Data Fig. 6
Extended Data Fig. 6. Assessment of the enrichment capabilities of the three antibodies.
Related to Fig. 4. a) An illustration depicting the experimental setup for assessing antibody enrichment. In each immunoprecipitation (IP) experiment, a trace amount (0.3 ng) of three synthetic peptides (GGK*GLGK, QLATK*AAR, and PELAK*SAPAPK) were mixed with a larger quantity of recombinant histone peptides (100 µg). The standard IP-LC-MS/MS procedure was followed, and the peptide intensities were measured to calculate the ratio of intensities ‘after IP’ compared to ‘before IP’. Panel b) displays the resulting intensity ratios for the three modified peptides, which indicate the relative enrichment performance of the antibodies.
Extended Data Fig. 7
Extended Data Fig. 7. Global alterations in KL-la, KD-la, and Kce in response to glycolysis.
Related to Fig. 5. a) Cell cultures exposed to low glucose levels (0.1 mM glucose) and high glucose levels (25 mM glucose) were combined. The resulting whole protein lysates were extracted, digested, and specific peptides modified with KL-la, KD-la, and Kce were selectively enriched using targeted antibodies. The enriched peptides were quantified through SILAC (Stable Isotope Labeling with Amino acids in Cell culture)-assisted LC-MS/MS analyses.
Extended Data Fig. 8
Extended Data Fig. 8. Global changes in KL-la, KD-la, and Kce in cells deficient in glyoxalase enzymes.
Related to Fig. 5. a) GLO1−/− cells are produced by a one-base insertion in GLO1’s exon 2, while GLO2−/− cells result from a 17-base deletion in GLO2’s exon 4. GLO1/2 double-deficient cells (GLO1/2−/−) are created by combing mutations including a one-base insertion in GLO1’s exon 2 and both a 30-base deletion and a 22-base insertion in GLO2’s exon 4. The guide RNA (gRNA) target sites are highlighted in blue with PAM (protospacer adjacent motif) sites in red. b-d) Triplicates of the Western blot experiments corresponding to Fig. 5e, using β-Actin as a loading control. e) The statistical analysis derived from densitometry measurements of the blots shown in panels b-d. Data are presented as mean values +/− SEM. Statistical significance was determined using two-way analysis of variance (ANOVA) followed by Tukey’s test for multiple comparisons. Source data
Extended Data Fig. 9
Extended Data Fig. 9. Quantitative analysis of lactyl-CoA in cells treated with (R)-GNE-140.
Related to Fig. 6. a) Lactyl-CoA concentrations were quantified in wild-type HepG2 cells using LC-MS/MS, with or without treatment by 10 µM (R)-GNE-140. The experiment was conducted with n = 5 biological replicates, and the data were normalized to protein content. The Data are presented as mean values +/− SEM. Statistical significance was determined using a two-tailed Student’s t-test.

References

    1. Allis, C. D. & Jenuwein, T. The molecular hallmarks of epigenetic control. Nat. Rev. Genet.17, 487–500 (2016). - PubMed
    1. Sabari, B. R., Zhang, D., Allis, C. D. & Zhao, Y. M. Metabolic regulation of gene expression through histone acylations. Nat. Rev. Mol. Cell Biol.18, 90–101 (2017). - PMC - PubMed
    1. Dai, Z., Ramesh, V. & Locasale, J. W. The evolving metabolic landscape of chromatin biology and epigenetics. Nat. Rev. Genet.21, 737–753 (2020). - PMC - PubMed
    1. Li, X., Egervari, G., Wang, Y., Berger, S. L. & Lu, Z. Regulation of chromatin and gene expression by metabolic enzymes and metabolites. Nat. Rev. Mol. Cell Biol.19, 563–578 (2018). - PMC - PubMed
    1. Walsh, C. T., Garneau-Tsodikova, S. & Gatto, G. J. Jr. Protein posttranslational modifications: the chemistry of proteome diversifications. Angew. Chem. Int. Ed. Engl.44, 7342–7372 (2005). - PubMed

Publication types

LinkOut - more resources