. 2024 Jul 19;25(1):193.
doi: 10.1186/s13059-024-03332-5.

N6-methyladenosine writer METTL16-mediated alternative splicing and translation control are essential for murine spermatogenesis

Affiliations

N6-methyladenosine writer METTL16-mediated alternative splicing and translation control are essential for murine spermatogenesis

Qian Ma et al. Genome Biol. .

Abstract

Background: The mitosis-to-meiosis switch during spermatogenesis requires dynamic changes in gene expression. However, the regulation of meiotic transcriptional and post-transcriptional machinery during this transition remains elusive.

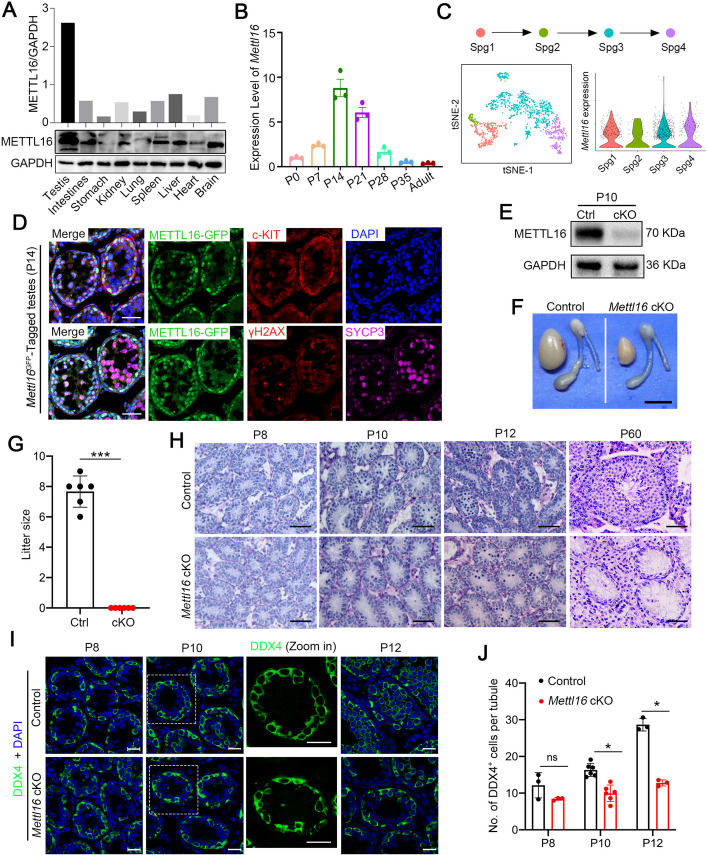
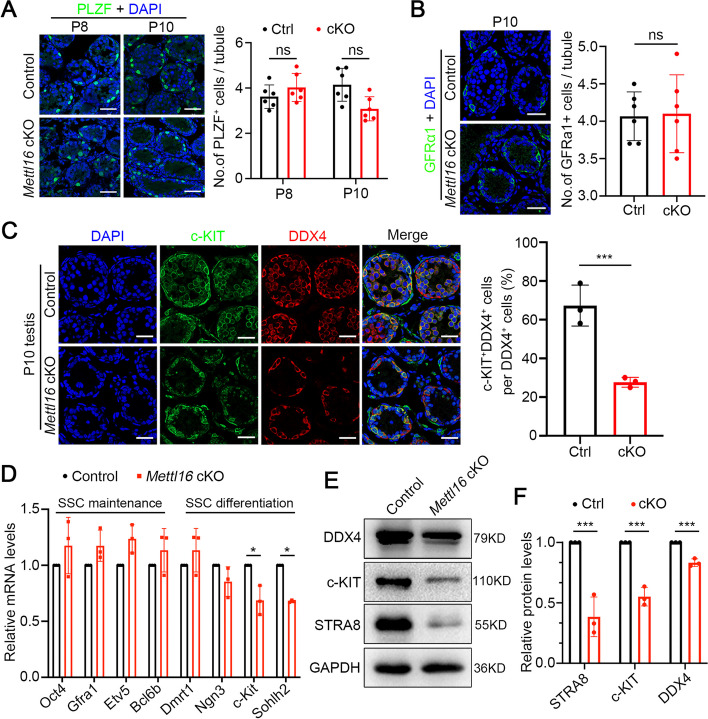
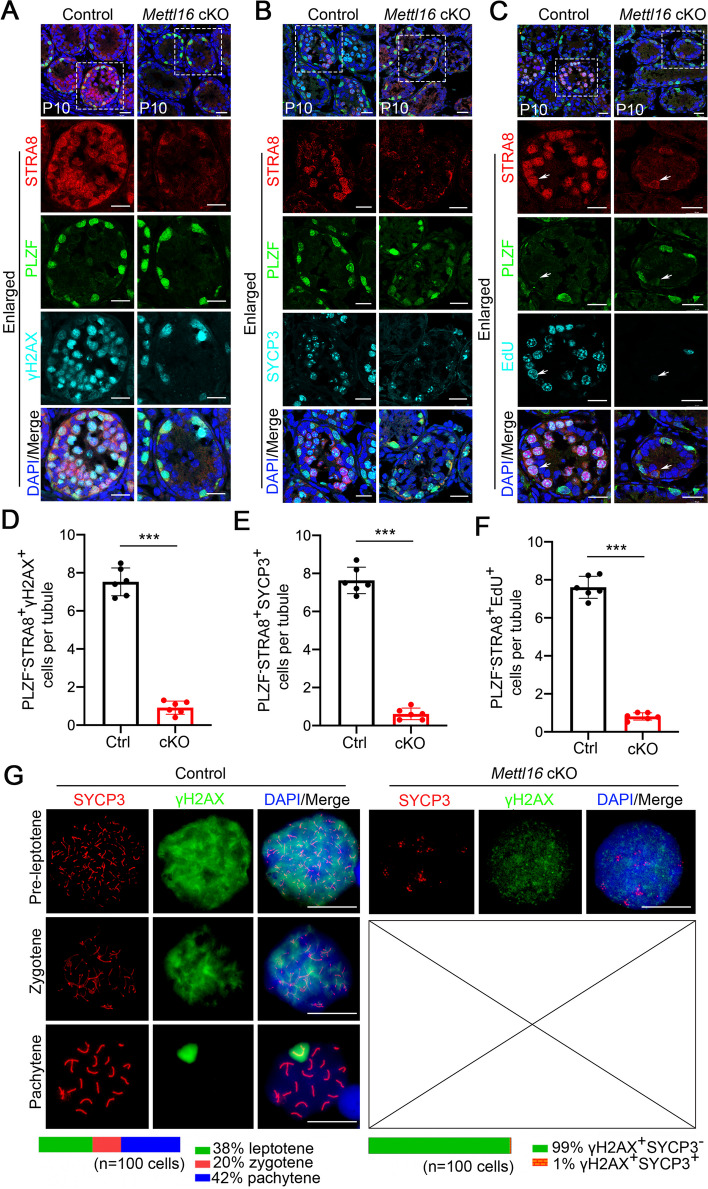
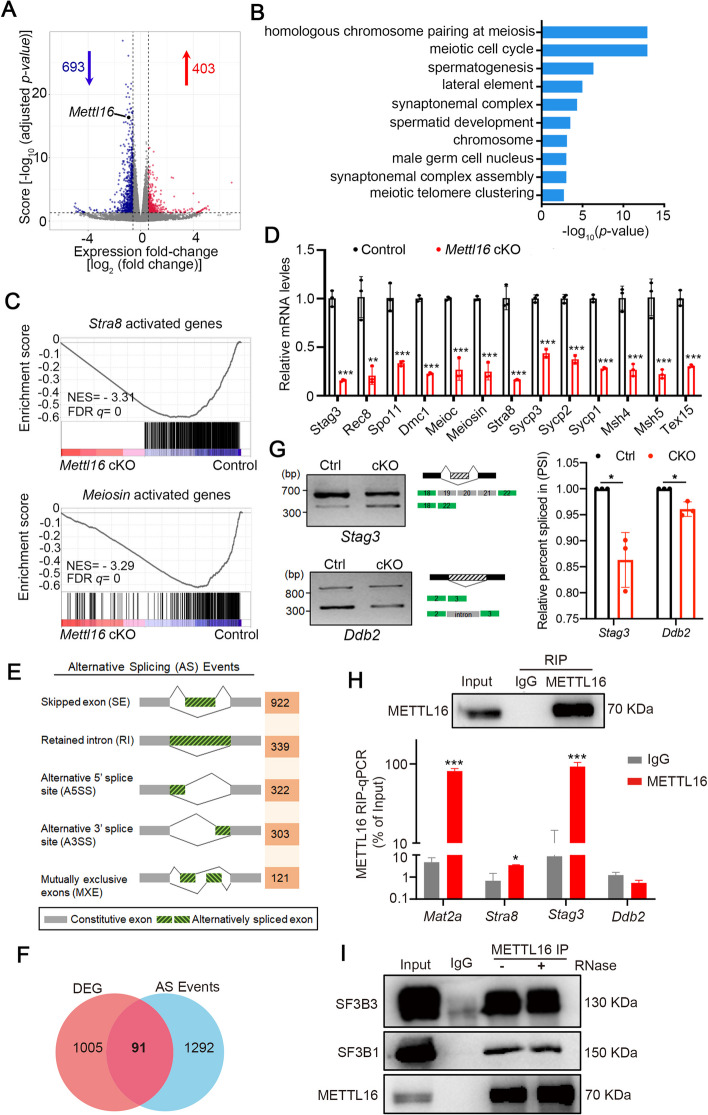
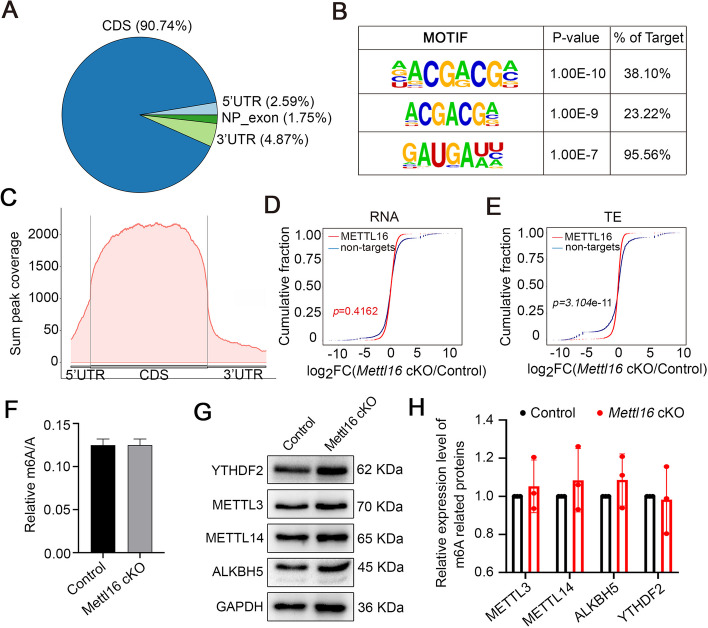
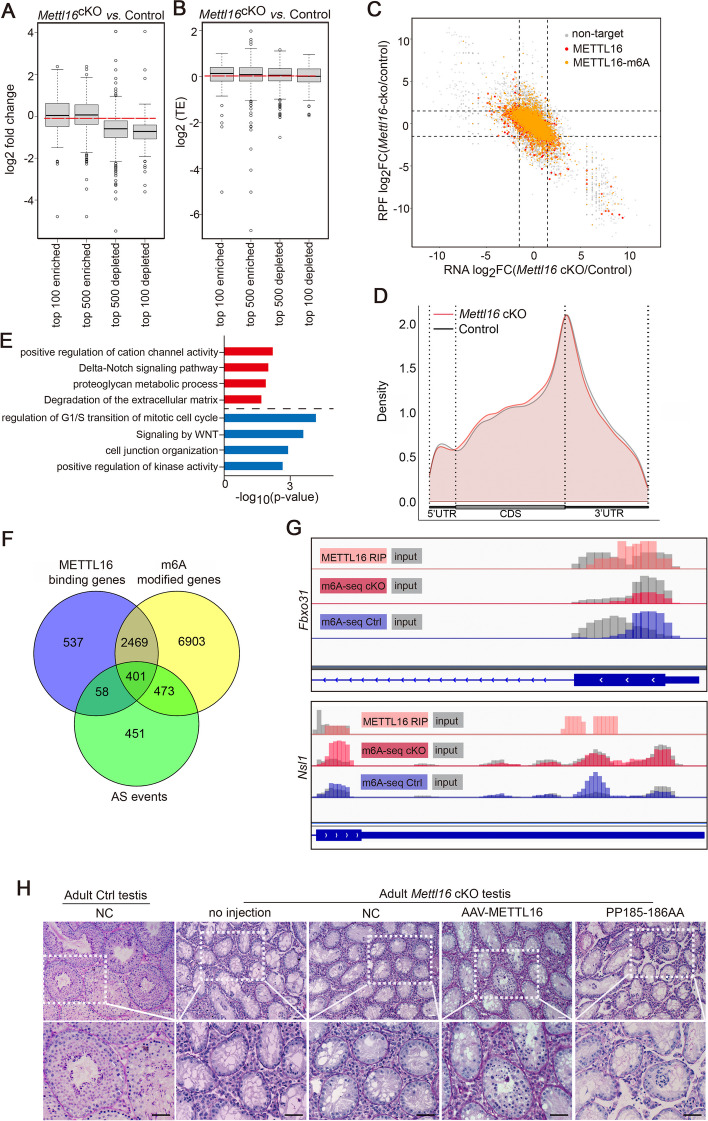
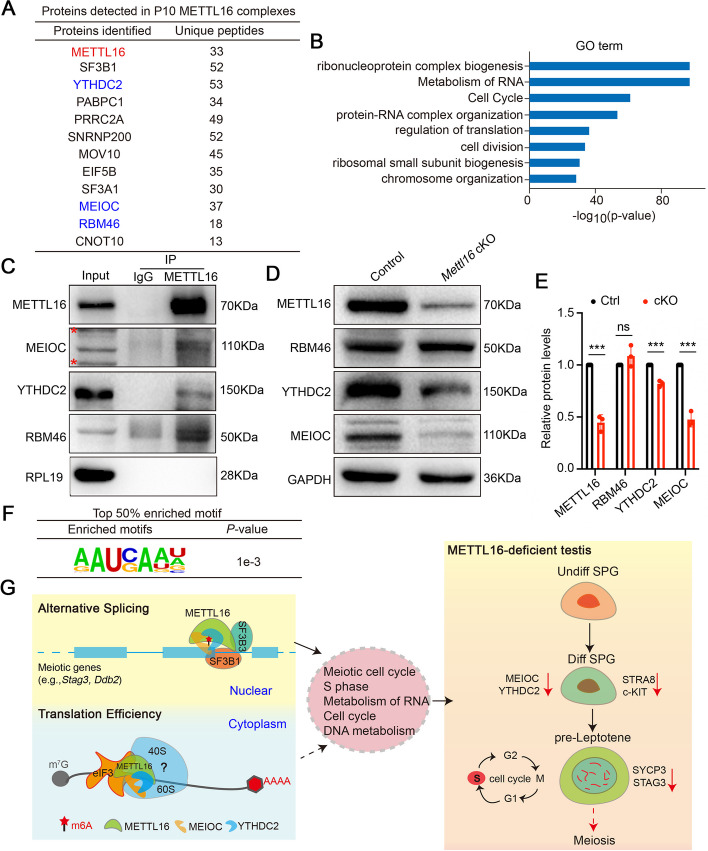
Results: We report that methyltransferase-like protein 16 (METTL16), an N6-methyladenosine (m6A) writer, is required for mitosis-to-meiosis transition during spermatogenesis. Germline conditional knockout of Mettl16 in male mice impairs spermatogonial differentiation and meiosis initiation. Mechanistically, METTL16 interacts with splicing factors to regulate the alternative splicing of meiosis-related genes such as Stag3. Ribosome profiling reveals that the translation efficiency of many meiotic genes is dysregulated in METTL16-deficient testes. m6A-sequencing shows that ablation of METTL16 causes upregulation of the m6A-enriched transcripts and downregulation of the m6A-depleted transcripts, similar to Meioc and/or Ythdc2 mutants. Further in vivo and in vitro experiments demonstrate that the methyltransferase activity site (PP185-186AA) of METTL16 is necessary for spermatogenesis.

Conclusions: Our findings support a molecular model wherein the m6A writer METTL16-mediated alternative splicing and translation efficiency regulation are required to control the mitosis-to-meiosis germ cell fate decision in mice, with implications for understanding meiosis-related male fertility disorders.


Conflict of interest statement

The authors declare that they have no competing interests.

Figures

Fig.1
Fig.1
Germline-specific knockout Mettl16 in male mice impairs spermatogenesis and male fertility. A Expression of METTL16 in various tissues of adult mice (8 weeks) is detected by Western blot. GAPDH was used as a loading control. B Expression of Mettl16 in the developmental testes of mice is assessed through RT-qPCR. Gapdh was used for norminalization. Data were presented as mean ± SEM, n = 3 (three biological replicates). C scRNA-seq analyses of the expression profile of Mettl16 during spermatogonia differentiation is shown. Spg1, Spg2, Spg3, and Spg4 represent SSCs, undifferentiated spermatogonia, differentiating spermatogonia, and differentiated spermatogonia, respectively. D Expression of METTL16-EGFP (green) in testes from P14 Mettl16EGFP-tagged mice is detected by immunofluorescent staining with marker proteins, including c-KIT (red), or SYCP3 (purple) and γH2AX (red). DAPI (blue) was used to counterstain the nuclei. Scale bars = 20 μm. E METTL16 expression in Control and Mettl16 cKO mice at P10 is analyzed by Western blot. GAPDH was used as a loading control. F Gross images of testes from adult Control and Mettl16 cKO mice are shown. Scale bar = 50 mm. G Histogram shows the litter size of adult Control (Ctrl) and Mettl16 cKO (cKO) male mice. Data were presented as mean ± SEM, n = 6. ***P < 0.001. H PAS staining of testes from Control and Mettl16 cKO mice at P8, P10, P12, and P60. Scale bars = 50 μm. I Immunofluorescent staining of germ cell marker (DDX4, green) on testicular sections from Control and Mettl16 cKO mice at P8, P10, and P12. DAPI was used to counterstain the nuclei. Scale bars = 20 μm. J The histogram shows the quantification of the number of DDX4+ cells per tubule in (I). Data were presented as mean ± SEM. n = 3 for P8 mice, n = 6 for P10 mice, and n = 3 for P12 mice. ns, not significant. *P < 0.05
Fig.2
Fig.2
Ablation of METTL16 in mice causes aberrant spermatogonia differentiation. A Representative images of immunofluorescent staining for PLZF on testicular sections from Control (Ctrl) and Mettl16 cKO (cKO) mice at P8 and P10 are shown. The DNA was stained with DAPI. Scale bars = 50 μm. The right histogram shows the quantification of the number of PLZF+ cells per tubule in (A). Data were presented as mean ± SEM. n = 6. ns, not significant. B Representative images of immunofluorescent staining for GFRα1 on testicular sections from Control and Mettl16 cKO mice at P10 are shown. The DNA was stained with DAPI. Scale bars = 50 μm. The right histogram shows the quantification of the number of GFRα1+ cells per tubule in (B). Data were presented as mean ± SEM. n = 6. ns, not significant. C Representative images of co-immunofluorescent staining of c-KIT (green) and DDX4 (red) on P10 testicular sections from Control and Mettl16 cKO mice are shown. Scale bars = 50 μm. The right histogram quantifies the ratio of c-KIT+ DDX4+ cells to DDX4+ cells in (C). D Histogram shows the expression of genes involved in SSC maintenance and differentiation in P10 testes from Control and Mettl16 cKO mice. Gapdh was used for nominalization. Data were presented as mean ± SEM, n = 3. *P < 0.05. E Western blotting analyses of DDX4, c-KIT, and STRA8 in P10 testes from Control and Mettl16 cKO mice. GAPDH was used as a loading control. F Histogram shows the quantification of the protein expression in (E). Data were presented as mean ± SEM, n = 3. ***P < 0.001
Fig.3
Fig.3
Male germline conditional knockout Mettl16 results in meiosis arrested. A Representative images of co-immunofluorescent staining of STRA8 (red), PLZF (green), and γH2AX (cyan) on testicular sections from Control (Ctrl) and Mettl16 cKO (cKO) mice at P10 are shown. The DNA was stained with DAPI. Scale bars = 20 μm. B Representative images of co-immunofluorescent staining of STRA8 (red), PLZF (green), and SYCP3 (cyan) on testicular sections from Control and Mettl16 cKO mice at P10 are shown. The DNA was stained with DAPI. Scale bars = 20 μm. C Representative images of co-immunofluorescent staining of STRA8 (red), PLZF (green), and EdU (cyan) on testicular sections from Control and Mettl16 cKO mice at P10 are shown. The DNA was stained with DAPI. Scale bars = 20 μm. D-F The histogram shows the quantification of the number of PLZFSTRA8+γH2AX+, PLZFSTRA8+SYCP3+, PLZFSTRA8+EdU+ cells per tubule in (A-C). Data were presented as mean ± SEM. n = 6. ***P < 0.001. G Representative images of co-immunofluorescent staining of SYCP3 (red) and γH2AX (green) on spermatocyte spreads from P14 Control and Mettl16 cKO mice are shown. The percent of each cell type was calculated in the lower panel. The DNA was stained with DAPI. Scale bars = 5 μm
Fig.4
Fig.4
Mettl16 cKO mouse testes display abnormal gene expression profiles and alternative splicing. A The volcano plot shows differentially expressed genes (DEGs) identified from RNA-seq from P10 Mettl16 cKO and control testes. |log2FC|> 0.7 and an adjusted P-value < 0.05 were considered significant. Total identified 403 genes upregulated and 693 genes downregulated in Mettl16 cKO testes. B GO term enrichment analysis of DEGs shows the top 10 enriched biological processes. C GSEA analyses of the RNA-seq data from P10 control and Mettl16 cKO testes are shown. FDR q < 25%. NES, normalized enriched score. D RT-qPCR analysis verifies the indicated downregulated meiosis-related genes from RNA-seq data in c-KIT+ cells purified from P10 testes. Data are presented as mean ± SEM, n = 3. **P < 0.01, ***P < 0.001. Actin was used as an internal control for gene expression normalization. E Summary of differential alternative splicing (AS) events in testes from P10 Control and Mettl16 cKO mice. The numbers of predicted AS events in each category are indicated. F Venn diagrams show the overlap between DEGs and AS events in Mettl16 cKO versus control testes. G RT-PCR analysis for indicated genes (Stag3 and Ddb2) in c-KIT-positive spermatogonia isolated from Control and Mettl16 cKO mice at P10. The middle panels represent the schematic diagram of indicated AS exons. Right panel shows the quantification of percent spliced in (PSI). Data are presented as mean ± SEM, n = 3. *P < 0.05. H RIP-qPCR analysis of METTL16 binding genes as indicated. IgG was used as a control versus METTL16 antibody. RIP-qPCR enrichment was calculated concerning the Input. Mat2a was used as a positive control of selected METTL16 targets. I Immunoprecipitation (IP) analysis of METTL16 binding proteins (SF3B3 and SF3B1) in the presence or absence of RNase A is shown
Fig.5
Fig.5
METTL16 decreases the mRNA abundance and improves the translation efficiency of its targets. A Pie chart depicting the binding peaks of METTL16 from the RIP-seq data. B The top 3 METTL16 binding peaks were identified through motif analysis based on RIP-seq data. C The distribution of METTL16 RIP peaks along the length of mRNA transcripts is shown. CDS indicates the coding sequence. D-E Cumulative distribution of RNA abundance (D) and translation efficiency (E) changes between Control (Ctrl) and Mettl16 cKO (cKO) testes. RNA abundance was presented as the log2Fold Change(cKO/Ctl) in the X-axis. The blue curves indicate non-targets of METTL16, and the red curves indicate METTL16-RIP. P-values were calculated using a two-sided Wilcoxon test. F The m6A levels of testes from Control and Mettl16 CKO mice at P8 are analyzed by LC-ESI-MS/MS. G Western blot analysis shows the expression levels of other m6A pathway proteins (METTL3, METTL14, YTHDF2, and ALKBH5) in testes from control and Mettl16 cKO testis at P8. GAPDH was used as a loading control. H Histogram shows the quantification of the protein expression in (G). Data were presented as mean ± SEM, n = 3
Fig.6
Fig.6
The catalytic activity of METTL16 is essential for spermatogenesis in mice. A, B Combined analysis of transcripts harboring differential m6A levels (Top 100 or 500 genes that are m6A-enriched or m6A-depleted in m6A-IP libraries) with DEGs (Mettl16 cKO v.s. Control) from RNA-seq (A) or genes with differential TE (B). The m6A-enriched or m6A-depleted genes were identified based on P-values in P8 testis according to previously reported m6A-IP data (PMID: 29033321). C Scatter plots show the combined analysis of RIP-seq and m6A-seq from Control and Mettl16 cKO testes. Gray dots (non-target) indicate genes with no METTL16-binding sites. Red dots indicate genes with METTL16-binding sites. Orange dots indicate genes with overlapped METTL16-binding and m6A-modified sites. D Distribution of m6A-modified peaks of Control and Mettl16 cKO along the length of mRNA transcripts. E GO term enrichment analyses of genes with m6A-modification show the top 4 terms enriched in genes with down-regulated (blue) and up-regulated (red) m6A-modified peaks. F Venn diagrams show the overlap among AS genes (Mettl16 cKO vs Control in RNA-seq), METTL16 binding genes (RIP-seq), and m6A modified genes (wild-type in m6A-seq). G Integrative Genomics Viewer (IGV) shows the distribution of m6A-modified peaks and METTL16-binding peaks along with indicated transcripts (Fbxo31 and Nsl1) in METTL16 RIP-seq and m6A-seq data. H Histological analyses of testes from Mettl16 cKO adult mice injected into AAV9 vectors carrying wild-type or mutant (catalytic dead) METTL16 are shown. No injection or NC (empty vector) injection was used as the negative control. The histology was analyzed by PAS two weeks after injection. Scale bars = 50 μm
Fig.7
Fig.7
METTL16 is a binding partner of MEIOC/YTHDC2/RBM46 complex in mouse testes. A A list of eleven METTL16-interacting partners in P10 mouse testes identified by IP-MS is shown. B Go term enrichment analyses showing the METTL16-interacting proteins identified from IP-MS data. C Validation of interactions between METTL16 and three putative METTL16-interacting proteins (MEIOC, YTHDC2, and RBM46) in P10 mouse testes by IP assays are shown. Mouse testis lysates were subjected to IP with anti-METTL16 or IgG control antibodies. Asterisk indicates non-specific bands. D Western blot analyses show the expression levels of METTL16-interacting proteins (MEIOC, YTHDC2, and RBM46) in testes from control and Mettl16 cKO testis at P10. GAPDH was used as a loading control. E Histogram shows the quantification of the protein expression in (D). Data were presented as mean ± SEM, n = 3. ns, not significant. ***P < 0.001. F The motif analysis shows that the top 50% METTL16 binding sites are ‘AAUCAA’, similar to the YTHDC2 and RBM46 binding sites. G A schematic illustration of the function of METTL16 during spermatogenesis is shown. METTL16 interacts with alternative splicing factors (e.g., SF3B1 and SF3B3) to regulate AS of meiotic genes for governing the meiotic gene expression program in the nuclear of male germ cells. Meanwhile, METTL16 balance translation efficiency for proper cell cycle and a successful meiosis initiation in the cytoplasm of male germ cells

References

    1. Suzuki S, McCarrey JR, Hermann BP. An mTORC1-dependent switch orchestrates the transition between mouse spermatogonial stem cells and clones of progenitor spermatogonia. Cell Rep. 2021;34:108752. 10.1016/j.celrep.2021.108752 - DOI - PMC - PubMed
    1. Lin Z, Tong MH. m(6)A mRNA modification regulates mammalian spermatogenesis. Biochim Biophys Acta Gene Regul Mech. 2019;1862:403–11. 10.1016/j.bbagrm.2018.10.016 - DOI - PubMed
    1. Gewiss RL, Schleif MC, Griswold MD. The role of retinoic acid in the commitment to meiosis. Asian J Androl. 2021;23:549–54. 10.4103/aja202156 - DOI - PMC - PubMed
    1. Kasowitz SD, Ma J, Anderson SJ, Leu NA, Xu Y, Gregory BD, Schultz RM, Wang PJ. Nuclear m6A reader YTHDC1 regulates alternative polyadenylation and splicing during mouse oocyte development. PLoS Genet. 2018;14:e1007412. 10.1371/journal.pgen.1007412 - DOI - PMC - PubMed
    1. Wang X, Lu Z, Gomez A, Hon GC, Yue Y, Han D, Fu Y, Parisien M, Dai Q, Jia G, et al. N6-methyladenosine-dependent regulation of messenger RNA stability. Nature. 2014;505:117–20. 10.1038/nature12730 - DOI - PMC - PubMed

LinkOut - more resources