

The phase behavior of skin-barrier lipids: A combined approach of experiments and simulations
- PMID: 39030908
- PMCID: PMC11447553
- DOI: 10.1016/j.bpj.2024.07.018
The phase behavior of skin-barrier lipids: A combined approach of experiments and simulations
Abstract
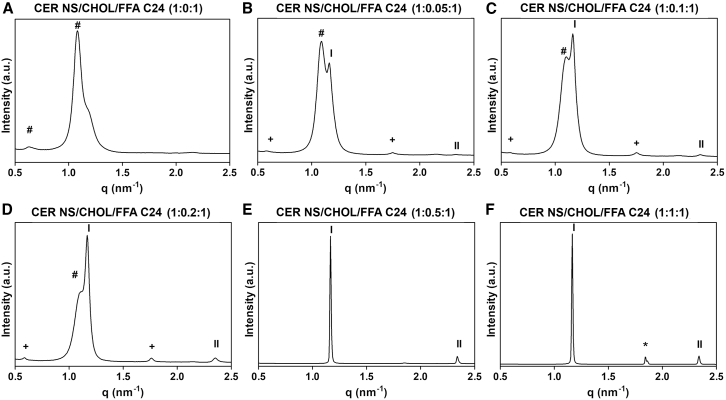
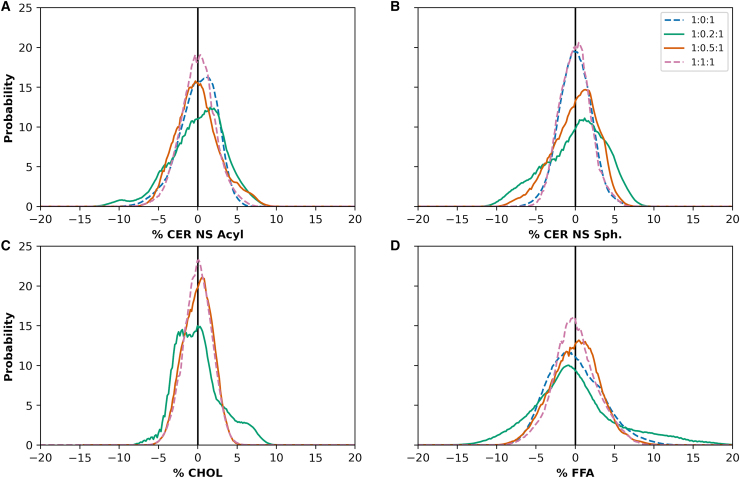
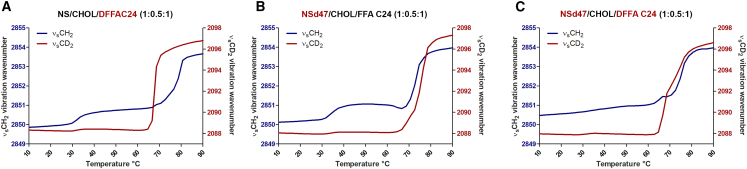
Skin barrier function is localized in its outermost layer, the stratum corneum (SC), which is comprised of corneocyte cells embedded in an extracellular lipid matrix containing ceramides (CERs), cholesterol (CHOL), and free fatty acids (FFAs). The unique structure and composition of this lipid matrix are important for skin barrier function. In this study, experiments and molecular dynamics simulation were combined to investigate the structural properties and phase behavior of mixtures containing nonhydroxy sphingosine CER (CER NS), CHOL, and FFA. X-ray scattering for mixtures with varying CHOL levels revealed the presence of the 5.4 nm short periodicity phase in the presence of CHOL. Bilayers in coarse-grained multilayer simulations of the same compositions contained domains with thicknesses of approximately 5.3 and 5.8 nm that are associated with elevated levels, respectively, of CER sphingosine chains with CHOL, and CER acyl chains with FFA chains. The prevalence of the thicker domain increased with decreasing CHOL content. This might correspond to a phase with ∼5.8 nm spacing observed by x-rays (other details unknown) in mixtures with lower CHOL content. Scissoring and stretching frequencies from Fourier transform infrared spectroscopy (FTIR) also indicate interaction between FFA and CER acyl chains and little interaction between CER acyl and CER sphingosine chains, which requires CER molecules to adopt a predominantly extended conformation. In the simulated systems, neighbor preferences of extended CER chains align more closely with the FTIR observations than those of CERs with hairpin ceramide chains. Both FTIR and atomistic simulations of reverse mapped multilayer membranes detect a hexagonal to fluid phase transition between 65 and 80°C. These results demonstrate the utility of a collaborative experimental and simulation effort in gaining a more comprehensive understanding of SC lipid membranes.
Copyright © 2024 The Author(s). Published by Elsevier Inc. All rights reserved.
Conflict of interest statement
Declaration of interests The authors declare no competing interests.
Figures


Similar articles
-
Molecular Dynamics Simulation Study of Skin Lipids: Effects of the Molar Ratio of Individual Components over a Wide Temperature Range.J Phys Chem B. 2015 Sep 3;119(35):11643-55. doi: 10.1021/acs.jpcb.5b02093. Epub 2015 Aug 21. J Phys Chem B. 2015. PMID: 26274913
-
Role of ceramide 1 in the molecular organization of the stratum corneum lipids.J Lipid Res. 1998 Jan;39(1):186-96. J Lipid Res. 1998. PMID: 9469597
-
The role of ceramide composition in the lipid organisation of the skin barrier.Biochim Biophys Acta. 1999 Jul 15;1419(2):127-36. doi: 10.1016/s0005-2736(99)00057-7. Biochim Biophys Acta. 1999. PMID: 10407065
-
Using molecular simulation to understand the skin barrier.Prog Lipid Res. 2022 Nov;88:101184. doi: 10.1016/j.plipres.2022.101184. Epub 2022 Aug 19. Prog Lipid Res. 2022. PMID: 35988796 Free PMC article. Review.
-
State of the Art in Stratum Corneum Research. Part II: Hypothetical Stratum Corneum Lipid Matrix Models.Skin Pharmacol Physiol. 2020;33(4):213-230. doi: 10.1159/000509019. Epub 2020 Jul 17. Skin Pharmacol Physiol. 2020. PMID: 32683377 Free PMC article. Review.
Cited by
-
Presence of Different Ceramide Species Modulates Barrier Function and Structure of Stratum Corneum Lipid Membranes: Insights from Molecular Dynamics Simulations.Mol Pharm. 2025 Jul 7;22(7):4280-4292. doi: 10.1021/acs.molpharmaceut.5c00580. Epub 2025 Jun 25. Mol Pharm. 2025. PMID: 40560383 Free PMC article.
-
Insights into Dermal Permeation of Skin Oil Oxidation Products from Enhanced Sampling Molecular Dynamics Simulation.J Phys Chem B. 2025 Feb 13;129(6):1784-1794. doi: 10.1021/acs.jpcb.4c08090. Epub 2025 Feb 3. J Phys Chem B. 2025. PMID: 39901666 Free PMC article.
References
-
- Weerheim A., Ponec M. Determination of stratum corneum lipid profile by tape stripping in combination with high-performance thin-layer chromatography. Arch. Dermatol. Res. 2001;293:191–199. - PubMed
-
- Bouwstra J.A., Gooris G.S., et al. Ponec M. Role of ceramide 1 in the molecular organization of the stratum corneum lipids. J. Lipid Res. 1998;39:186–196. - PubMed
-
- Bouwstra J.A., Gooris G.S., et al. Ponec M. Phase behavior of lipid mixtures based on human ceramides: coexistence of crystalline and liquid phases. J. Lipid Res. 2001;42:1759–1770. - PubMed
-
- Schreiner V., Pfeiffer S., et al. Bouwstra J. Barrier Characteristics of Different Human Skin Types Investigated with X-Ray Diffraction, Lipid Analysis, and Electron Microscopy Imaging. J. Invest. Dermatol. 2000;114:654–660. - PubMed
Publication types
MeSH terms
Substances
Grants and funding
LinkOut - more resources
Full Text Sources
Medical
Miscellaneous
