. 2024 Sep 4;14(9):jkae166.
doi: 10.1093/g3journal/jkae166.

Characterization of mycobacteriophage Adephagia cytotoxic proteins

Affiliations

Characterization of mycobacteriophage Adephagia cytotoxic proteins

Krista G Freeman et al. G3 (Bethesda). .

Abstract

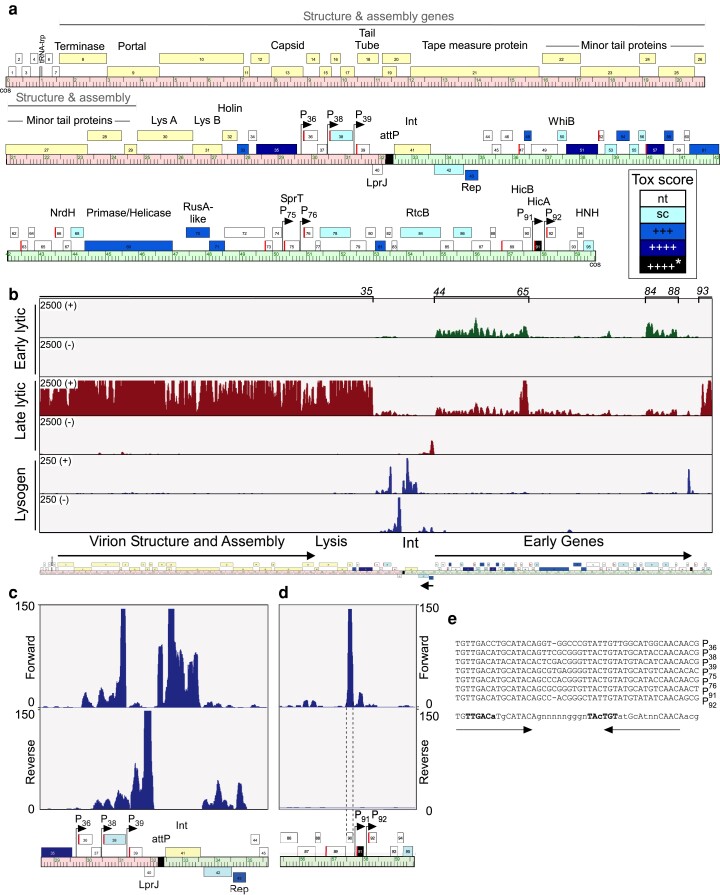
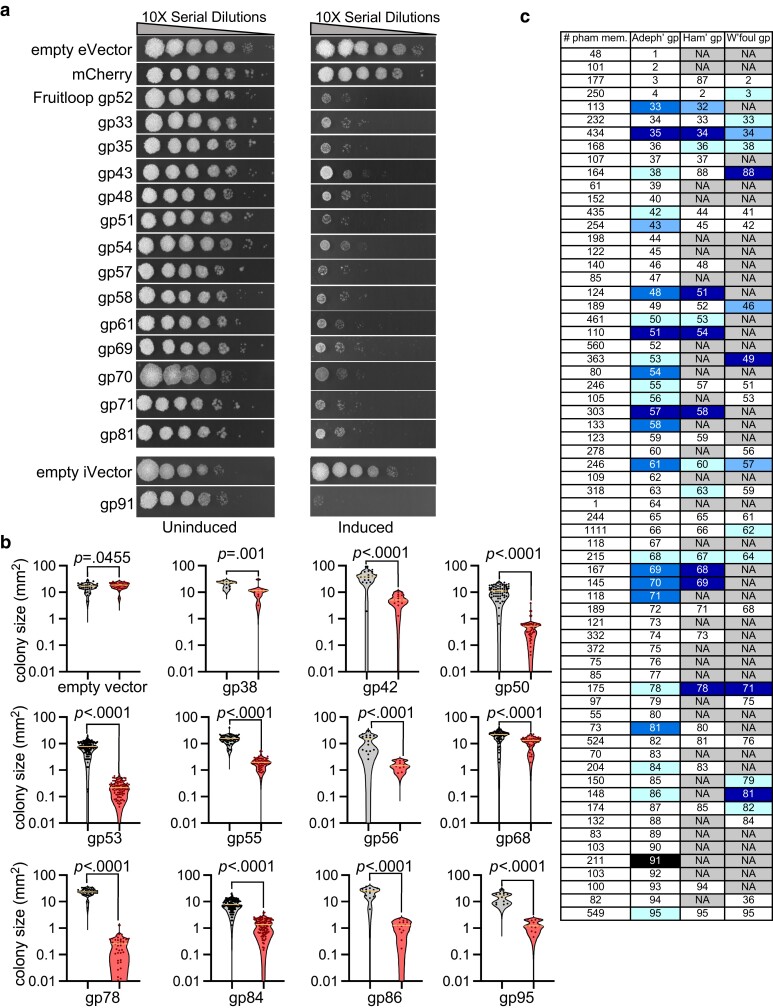
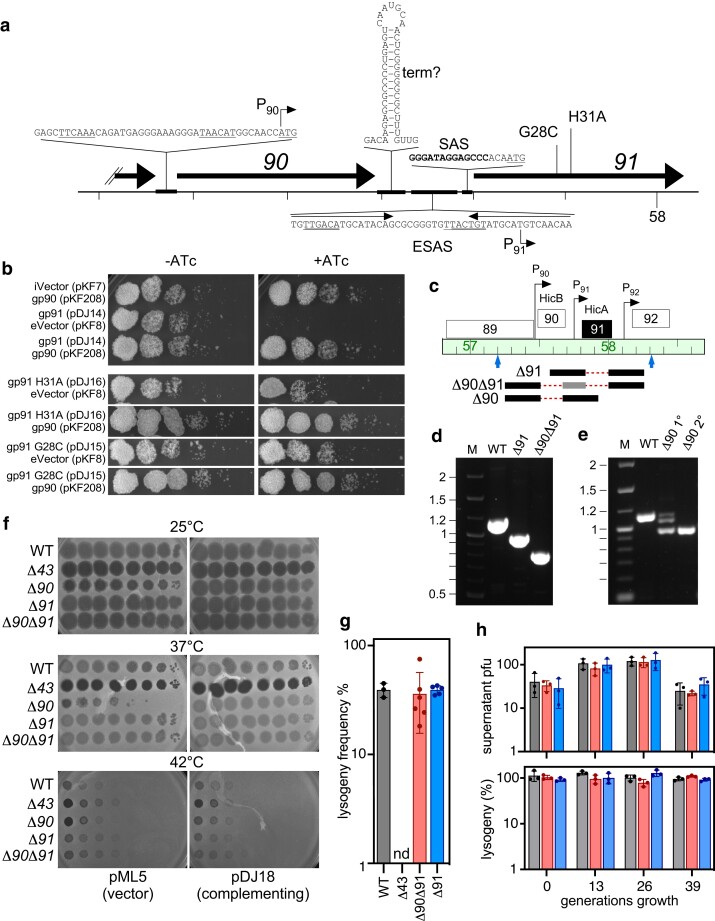
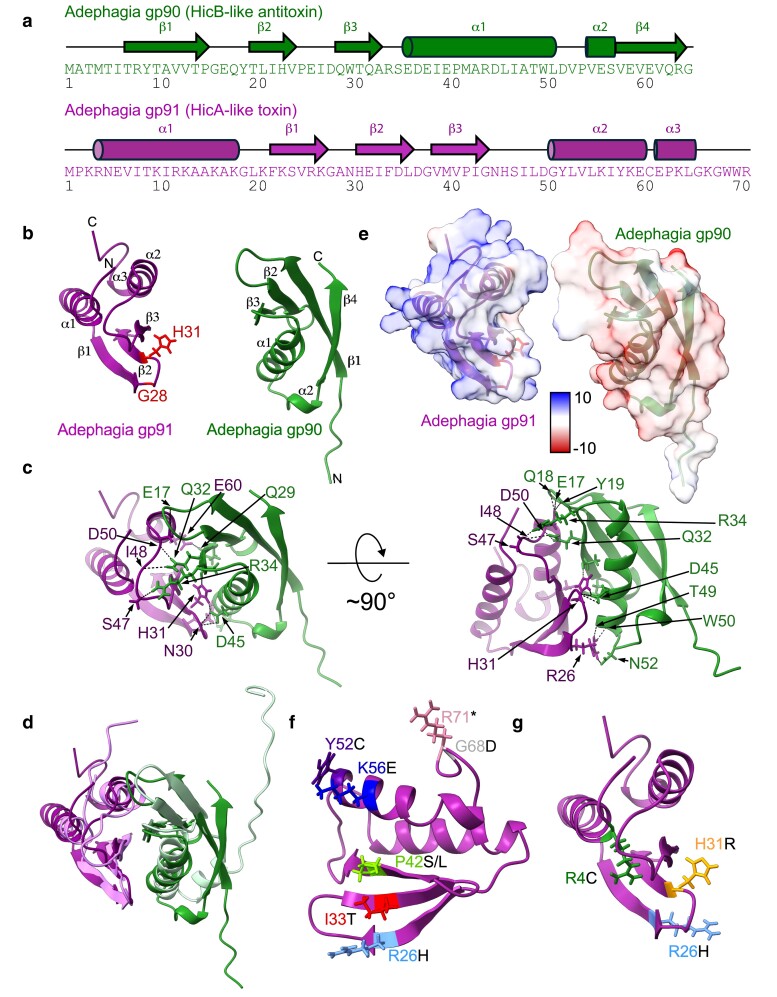
Mycobacterium phage Adephagia is a cluster K phage that infects Mycobacterium smegmatis and some strains of Mycobacterium pathogens. Adephagia has a siphoviral virion morphology and is temperate. Its genome is 59,646 bp long and codes for one tRNA gene and 94 predicted protein-coding genes; most genes not associated with virion structure and assembly are functionally ill-defined. Here, we determined the Adephagia gene expression patterns in lytic and lysogenic growth and used structural predictions to assign additional gene functions. We characterized 66 nonstructural genes for their toxic phenotypes when expressed in M. smegmatis, and we show that 25 of these (38%) are either toxic or strongly inhibit growth, resulting in either reduced viability or small colony sizes. Some of these genes are predicted to be involved in DNA metabolism or regulation, but others are of unknown function. We also characterize the HicAB-like toxin-antitoxin (TA) system encoded by Adephagia (gp91 and gp90, respectively) and show that the gp90 antitoxin is lysogenically expressed, abrogates gp91 toxicity, and is required for normal lytic and lysogenic growth.

Keywords: cytotoxic genes; mycobacteriophage; toxin–antitoxin.


Conflict of interest statement

Conflicts of interest The author(s) declare no conflicts of interest.

Figures

Fig. 1.
Fig. 1.
Mycobacteriophage Adephagia genome organization and expression. a) The Adephagia genome is shown as a ruler, with genes shown as boxes above or below the ruler (indicating right- or leftward transcription, respectively). The left arm (from cos to attP) is shaded light red and the right arm (attP to cos) is shaded light green. Putative protein functions are indicated above the corresponding genes, where known. The virion structure and assembly genes and the lysis cassette are indicated. The genes are colored in shades of blue according to the cytotoxic effect of the expressed protein, as indicated with the tox score scale (nt, nontoxic; sc, small colony phenotype; +++, reduction in EOP of 10−3; ++++, reduction in EOP of 10−4; ++++*, reduction in EOP of 10−4 in an integrative vector). Genes that were not tested for cytotoxicity are colored light yellow. Genes with a SAS are shown with a red bar at the start of the gene. The positions of 7 ESASs, each containing a putative promoter, are indicated with arrows, and the predicted promoters are indicated by the closest downstream gene. b) Transcription of the Adephagia genome. Sequencing reads obtained from RNA isolated during Adephagia early lytic infection (30 minutes; green) and Adephagia late lytic infection (210 minutes; red), as well as from an M. smegmatis mc2155(Adephagia) lysogen (blue), are mapped onto the Adephagia genome depicted below. Reads mapping forward (+) and reverse (−) strands are shown as indicated. Note that the read scale maximum is 2,500 for the lytic conditions, but only 250 for the lysogen. c) Expanded view of RNA-seq reads of the lysogenic sample in the central genomic region of the Adephagia genome. d) Expanded view of RNA-seq reads of the lysogenic sample in the gene 8695 region. e) Extended SAS motifs in Adephagia with putative promoter sequences for genes 36, 38, 39, 75, 76, 91, and 92 as indicated to the right. A consensus sequence is shown at the bottom with putative −35 and −10 hexamer sequences shown in bold type; bases conserved in all sequences are shown in upper case and in lower case if present in at least 5 of the genomes.
Fig. 2.
Fig. 2.
Cytotoxic protein assay. a) Toxicity assays are shown for a series of Adephagia genes expressed from an ATc-inducible promoter. Cultures of M. smegmatis strains expressing Adephagia proteins as indicated at the left were 10-fold serially diluted and plated on solid media without (uninduced) or with (induced) ATc (100 ng/mL). Strains expressing either mCherry or Fruitloop gp52 are shown as controls. Adephagia gp91 was expressed from integration-proficient vector pKF7; all others were expressed from extrachromosomal vector pKF8. Empty vectors of pKF8 (empty eVector) and pKF7 (empty iVector) are shown as controls. Solid media plates were incubated at 37°C for 3 days. b) Violin plots showing the distributions of colony sizes for strains expressing Adephagia genes as indicated below each plot. M. smegmatis cultures were diluted and plated on solid media with or without ATc inducer for single colonies and imaged after 5 days of incubation at 37°C. Statistical significance was assessed by an unpaired t-test of the colony size distributions on uninduced (gray) and induced (red) media; P-values are indicated. c) A summary of gene toxicities in phages Adephagia, Hammy, and Waterfoul. Each tested Adephagia gene, indicated in the second column, encodes a protein that belongs to a phamily of homologues; the current (as of February 2024) number of phamily members is indicated in the first column. Phamily construction is described in detail elsewhere (Gauthier et al. 2022). The homologous gene numbers for Hammy/Waterfoul are shown, or the box is labeled N/A and colored gray if there is no homologue. Cytotoxic and inhibitory gene products are highlighted in shades of blue (as in Fig. 1a) for each phage. A white background indicates that the protein expression had no negative impact on cell growth.
Fig. 3.
Fig. 3.
Adephagia gp91–gp90 is a HicAB-like TA system. a) Organization of the gene 9091 region of Adephagia. The Adephagia genome is represented as the thin black line with markers every 100 bp, and the 58 kbp coordinate is indicated. Genes 90, 91, and the 3′ end of 89 are shown as black arrows. Shown above and below are key sequence features: A putative promoter for gene 90 (P90) is shown that predicts transcription initiation at coordinate 57,504 and use of a leaderless transcript for gene 90; a putative RNA secondary structure that likely acts as a transcriptional terminator (“term?”); the ESAS sequence with the P91 promoter with −35 and −10 sequences underlined and inverted repeats illustrated by arrows; the SAS sequence upstream of gene 91 with the conserved position shown in bold type; the positions of gp91 substitutions G28C and H31A. b) Ten-fold serial dilutions of M. smegmatis cultures (OD600 = 0.2) carrying plasmids as shown on the left were plated on solid media either with or without ATc inducer and incubated for 3 days. Plasmids are as follows: integration-proficient vector (iVector) and extrachromosomal vector (eVector) are pKF7 and pKF8, respectively. Plasmids pDJ14, pDJ16, and pDJ15 express Adephagia gp91, gp91 H31A, and gp91 G28C, respectively, in the iVector. Plasmid pKF208 expresses gp90 from the eVector. c) A section of the Adephagia genome map as in Fig. 1a, zoomed into the region of genes 90 and 91. Below the genome ruler are indicated primer locations (blue arrows) and BRED substrates for the creation of deletion mutants (black solid lines indicate regions of homology and red dotted lines indicate deleted portions of the genome). The gray bar in the Δ90Δ91 mutant indicates a region that is retained (see Materials and Methods) d) A gel showing PCR products for WT Adephagia, Adephagia Δ91, and AdephagiaΔ90Δ91 amplified with the primers shown in panel c. e) A gel showing PCR products for mixed primary (1°) and pure secondary (2°) plaque picks from the Adephagia Δ90 BRED reaction amplified with the primers shown in panel c. f) Ten-fold dilutions of lysates of WT Adephagia and the Δ43, Δ90, Δ91, and Δ90Δ91 mutants were spotted onto lawns of M. smegmatis mc2 155 carrying plasmids pML5 (empty vector) or pDJ18 (constitutively expressing gp90) as indicated at the bottom and incubated at 3 temperatures as indicated above each set of plates. g) The frequency of lysogen formation on plates seeded with WT Adephagia (gray) and the Δ43 (no lysogens detected, nd), Δ90Δ91 (red), and Δ91 (blue) mutants. h) Levels of spontaneous phage release (PFU in 100 μL of supernatant from saturated cultures normalized to OD600 = 1), top, and % of CFU in culture belonging to lysogens, bottom, measured every 13 generations (via repeated subculturing) for WT Adephagia (gray) and the Δ90Δ91 (red) and Δ91 (blue) mutants.
Fig. 4.
Fig. 4.
Adephagia gp90 and gp91 structural models. a) Sequences of Adephagia gp90 (green) and gp91 (magenta) with arrows and cylinders shown above the sequence to indicate beta strands and alpha helices, respectively. Numbers below the sequences indicate every 10th residue. b) AlphaFold2-predicted models of Adephagia gp90 (magenta, left) and gp91 (green, right), with features named as in panel a. H31 and G28 are shown with sticks and colored red in the gp91 structure. c) The same models in the same orientation shown in panel b but with semitransparent surfaces showing coulombic electrostatic potential. The color key is shown, with values ranging from +10 to −10 kcal/(mol·e). d) A complex of gp90 and gp91 folded with AlphaFold-Multimer, with hydrogen bonds shown with black dotted lines and side chains involved in these bonds shown with sticks. The same gp90/gp91 complex model is shown on the right but rotated 90° into the page. e) The gp90/gp91 complex aligned with AlphaFold2-predicted models of the HicB/HicA proteins encoded by Campylobacter sp. RM12654, shown with lighter hues of the same colors. f) Single amino acid substitutions in gp91 are mapped onto the predicted gp91 model; these mutations were isolated from Adephagia Δ90 plaques grown on a noncomplementing strain of M. smegmatis at 37°C. Amino acid side chains of the WT residues are shown with color-coded identifiers; the black letter at the end of each label indicates the substitution. g) Single amino acid substitutions in gp91 were identified in putative Adephagia Δ90 lysogens, and these are mapped onto the predicted model. Amino acid side chains of the WT residues are shown with color-coded residue identifiers; the black letter at the end of each label indicates the substitution.

References

    1. Amaya I, Edwards K, Wise BM, Bhattacharyya A, Pablo CHD, Mushrush E, Coats AN, Dao S, Dittmar G, Gore T, et al. 2023. A genome-wide overexpression screen reveals Mycobacterium smegmatis growth inhibitors encoded by mycobacteriophage Hammy. G3 (Bethesda). 13(12):jkad240. doi: 10.1093/g3journal/jkad240. - DOI - PMC - PubMed
    1. Brown KL, Sarkis GJ, Wadsworth C, Hatfull GF. 1997. Transcriptional silencing by the mycobacteriophage L5 repressor. EMBO J. 16(19):5914–5921. doi: 10.1093/emboj/16.19.5914. - DOI - PMC - PubMed
    1. Brussow H, Hendrix RW. 2002. Phage genomics: small is beautiful. Cell. 108(1):13–16. doi: 10.1016/S0092-8674(01)00637-7. - DOI - PubMed
    1. Butt A, Higman VA, Williams C, Crump MP, Hemsley CM, Harmer N, Titball RW. 2014. The HicA toxin from Burkholderia pseudomallei has a role in persister cell formation. Biochem J. 459(2):333–344. doi: 10.1042/BJ20140073. - DOI - PMC - PubMed
    1. Dedrick RM, Abad L, Storey N, Kaganovsky AM, Smith BE, Aull HA, Cristinziano M, Morkowska A, Murthy S, Loebinger MR, et al. 2023a. The problem of Mycobacterium abscessus complex: multi-drug resistance, bacteriophage susceptibility and potential healthcare transmission. Clin Microbiol Infect. 29(10):1335.e9–1335.e16. doi: 10.1016/j.cmi.2023.06.026. - DOI - PMC - PubMed

MeSH terms

LinkOut - more resources