. 2024 Oct;11(40):e2309983.
doi: 10.1002/advs.202309983. Epub 2024 Jul 19.

KDM3A Ablation Activates Endogenous Retrovirus Expression to Stimulate Antitumor Immunity in Gastric Cancer

Affiliations

KDM3A Ablation Activates Endogenous Retrovirus Expression to Stimulate Antitumor Immunity in Gastric Cancer

Jiabin Zheng et al. Adv Sci (Weinh). 2024 Oct.

Abstract

The success of immunotherapy for cancer treatment is limited by the presence of an immunosuppressive tumor microenvironment (TME); Therefore, identifying novel targets to that can reverse this immunosuppressive TME and enhance immunotherapy efficacy is essential. In this study, enrichment analysis based on publicly available single-cell and bulk RNA sequencing data from gastric cancer patients are conducted, and found that tumor-intrinsic interferon (IFN) plays a central role in TME regulation. The results shows that KDM3A over-expression suppresses the tumor-intrinsic IFN response and inhibits KDM3A, either genomically or pharmacologically, which effectively promotes IFN responses by activating endogenous retroviruses (ERVs). KDM3A ablation reconfigures the dsRNA-MAVS-IFN axis by modulating H3K4me2, enhancing the infiltration and function of CD8 T cells, and simultaneously reducing the presence of regulatory T cells, resulting in a reshaped TME in vivo. In addition, combining anti-PD1 therapy with KDM3A inhibition effectively inhibited tumor growth. In conclusions, this study highlights KDM3A as a potential target for TME remodeling and the enhancement of antitumor immunity in gastric cancer through the regulation of the ERV-MAVS-IFN axis.

Keywords: ERV; KDM3A; gastric cancer; immunotherapy.


Conflict of interest statement

The authors declare no conflict of interest.

Figures

Figure 1
Figure 1
Insufficient tumor‐intrinsic IFN contributed to a non‐MSI TME according to single‐cell and bulk RNA sequence analysis. A) Uniform manifold approximation and projection (UMAP) plot visualization of major cell clusters, colored by cell type. T, T cells. NK, natural killer cell. B, B cells. DC, dendritic cell. B) Box plots showing the cell proportion of each cell type in each sample. C) Bar plots showing the GO/KEGG pathways enriched with genes whose expression significantly increased in the MSI subgroup. D) Density plots showing the M1 score of macrophages from the MSI or non‐MSI group. E) Density plots showing the M2 score of macrophages from the MSI or non‐MSI group. F) Violin plots showing the differences in CD4 T cell, NK cell and CD8 T cell expression between the MSI and non‐MSI groups. G) Box plot showing the Simpson diversity of TCR CDR3 sequences from T cells in each sample in the MSI and non‐MSI subgroups. H) Box plots showing the tumor immune infiltration score (indicated by CibersortX) in each sample grouped by MSI or non‐MSI status in the ACRG and TCGA‐STAD datasets. I) GSEA plot showing that the “response to type I interferon” pathway was enriched in the MSI subgroup in the ACRG (left) and TCGA‐STAD (right) datasets. Figure 1A to G were based on GSE183904 single‐cell dataset. ns, not significant; *p < 0.05; **p < 0.01; ***p < 0.001.
Figure 2
Figure 2
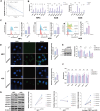
KDM3A overexpression inhibited tumor‐intrinsic IFN. A) Heatmap showing the correlation between genes that encode histone methyltransferases and genes related to type I IFN in merged datasets (TCGA and GEO). B) Venn diagram showing intersection genes with negative type I IFN correlations in merged datasets (TCGA and GEO). C) Density plot showing the correlation between target genes and genes related to type I interferons in merged datasets (TCGA and GEO). Redline, the correlation between all genes and type I IFN genes. Green, correlation between all histone methyltransferase genes and type I IFN genes. Blue line, correlation between KDM3A and type I IFN genes. D) Violin plot showing the different expression levels of KDM3A in normal or tumor samples in the TCGA, ACRG, and GSE184336 datasets. E) Survival plot showing that KDM3A is a risk factor for poor survival, with a P‐value of 0.019 (log‐rank test) in the merged datasets (TCGA and GEO). F) Relative KDM3A mRNA expression (left) and representative images of KDM3A protein expression (right) in 6 pairs of gastric cancer tissues (T) and adjacent normal tissues (NT). G) IHC analysis of KDM3A expression in serial sections of gastric cancer tissue from two distinct patients. H) The Ki‐67+ expression of 40 cases based on IHC in patients with high and low KDM3A expression. I) qPCR analysis of CXCL10, IFNB1, and ISG15 mRNA transcripts in CTL, sgKDM3A group, and KDM3A inhibitor (IOX1) group. In hibitor group, tumor cells were pretreated with 5 µmol mL−1 IOX1 for 48 h. J) IFNβ production by CTL and sgKDMA was determined by ELISA. K) Western blot showing the expression of RIG‐I, MDA5, MAVS, TBK1, phosphorylated TBK1 (ρ‐TBK1), IRF3, and ρ‐IRF3 in CTL and sgKDM3A. Inhibitor group, tumor cells were pretreated with 5 µmol mL−1 IOX1 for 48 h. The data are representative of three independent experiments; the data are presented as the means ± SDs. ns, not significant; *p < 0.05; **p < 0.01; ***p < 0.001.
Figure 3
Figure 3
KDM3A ablation activates ERV‐MAVS‐IFN signaling by increasing H3K4me2. A) Correlation between the KDM3A expression level and total ERVs UMI count (log2 transformed) in epithelial cells from non‐MSI TME datasets (GSE150290). The blue line indicates a negative correlation with R = −0.67 and P value < 2.2e‐16. Wilcoxon‐rank Sum test. B) qPCR analysis of mouse ERVs in CTL and sgKDM3A MFC cells (left); qPCR analysis of human ERVs in CTL and sgKDM3A AGS cells (middle); Inhibitor group, IOX1 treatment at 5 µmol ml−1 for 48 h in AGS cells (right); C) dsRNA expression was detected in the control (CTL) and sgKDM3A groups by flow cytometry; left, MFC cells; middle, AGS cells; right, AGS cells treated with different IOX1 concentrations (µmol ml−1) for 48 h. D) Representative immunofluorescence images and relative integrated immunofluorescence intensities of dsRNA‐specific J2 antibody staining in CTL and sgKDM3A cells. E) Western blot analysis of MAVS, IRF3 and ρ‐IRF3 expression in sgKDM3A cells transfected with siNC or siMAVS for 48 h. qPCR analysis of CXCL10, IFNB1, and ISG15 mRNA transcripts in sgKDM3A cells transfected with NC, siMAVS#1 and siMAVS#2. F) The levels of ERVs in sgKDM3A cells transfected with NC, siMAVS#1 or siMAVS#2 were measured by qPCR. G) Western blot analysis of H3, H3K4me2, H3K4me3, H3K9me1, H3K9me2, H3K9me3, H3K79me1 and H3K79me2 expression in MFC and AGS cells. KO, sgKDM3A; CTL, control. Quantification of the results (left). The relative average gray value of the results of the two cell lines was calculated. The data are representative of three independent experiments; the data are presented as the means ± SDs. ns, not significant; *p < 0.05; **p < 0.01; ***p < 0.001.
Figure 4
Figure 4
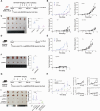
KDM3A inhibition suppressed tumor growth in type I IFN dependent way in vivo. A–C) BGC823 tumor cells were inoculated into nude mice (2 × 106 cells per mouse). The KDM3A inhibitors BIX01294 (10 mg kg−1) and IOX1 (12.5 mg kg−1) were administered by intraperitoneal injection. Timeline of the experimental setup (A). The tumor growth (B) and tumor weight (C) of BGC823 xenografts were measured. D–F) CTL or sgKDM3A MC38 cells were inoculated into C57BL/6 mice (1 × 106 cells per mouse). Timeline of the experimental setup (D). The growth (E) and weight (F) of the MC38 xenograft tumors were measured. G–I) The antitumor effect of KDM3A knockout was reversed by anti‐IFNAR1 antibody treatment. CTL or sgKDM3A MC38 cells were inoculated into C57BL/6 mice (1 × 106 cells per mouse). The mice were intraperitoneally injected with an anti‐IFNAR1 antibody (10 mg kg−1) four times. Timeline of the experimental setup (G). The growth (H) and weight I) of the MC38 xenograft tumors were measured. n = 5 per group; Data are presented as the means ± SDs; ns, not significant; *p < 0.05; **p < 0.01; ***p < 0.001.
Figure 5
Figure 5
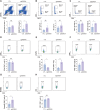
Knockout of KDM3A reshaped the TME in MC38 tumors. A) Percentages of myeloid cells (CD11b+CD45) and lymphoid cells (CD11b+CD45+) in CTL or sgKDM3A MC38 tumor tissues. B) NKT cells (NK1.1+CD3+) and NK cells (NK1.1+CD11b) in CTL or sgKDM3A MC38 tumor tissues. C) Percentages of CD4+ T cells (CD11bCD3+CD4+) and CD8 T cells (CD11bCD3+CD8+) in CTL or sgKDM3A MC38 tumor tissues. D) Percentage of IFNγ+ CD4 T cells (IFNγ+CD4+ CD3+) in CTL or sgKDM3A MC38 tumor tissues. E) Percentage of Treg cells (FoxP3+CD4+ CD3+) and the ratio of CD8 T cells to Treg cells in CTL or sgKDM3A MC38 tumor tissues. F–H) The function of tumor‐infiltrated T cells was assessed by analyzing IFNγ+CD8 T cells (F), Granzyme B+ CD8 T cells (G) and PD1+CD8 T cells (H). The data are presented as the means ± SDs; n = 5 per group; ns, not significant; *p < 0.05; **p < 0.01; ***p < 0.001.
Figure 6
Figure 6
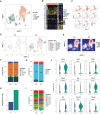
Single‐cell sequencing revealed that KDM3A ablation remodeled the TME. A) UMAP plots showing the cell clusters in the control and KDM3A‐ablation samples. Top panel, cells are colored by cell type. Bottom panel, cells are colored according to cell density. B) Heatmap showing the top 6 genes expressed in each cell type. C) UMAP plots show the canonical cell type‐specific genes expressed in cells. D) UMAP plots of major cell types in the CTL and KDM3A‐ablation samples. The cells are colored according to cell subtype. E) t‐SNE map of major cell types in the CTL and KDM3A‐ablation samples. The cells are colored according to cell subtype. F) Bar plot showing the proportions of immune cells infiltrated inside tumors in the CTL and KDM3A‐ablation groups. G) Bar plot showing the proportions of T‐cell types infiltrating inside tumors in the CTL and KDM3A‐ablation samples. Each T‐cell type is marked by its highly expressed gene. H) Bar plot showing the cell count ratio of CD8 T effector cells to CD4 T regulator cells in the CTL and KDM3A‐ablated samples. I) Bar plot showing the proportions of T cell types infiltrating inside tumors in the CTL and KDM3A‐ablation samples. Each T cell type was grouped by major T minor type. J) Violin plot showing the expression levels of cytotoxicity genes, interferon‐induced genes, and costimulatory genes in the CTL and KDM3A‐ablation samples. The p value was calculated by the Wilcoxon rank sum test.
Figure 7
Figure 7
KDM3A ablation enhanced the efficacy of anti‐PD1 treatment in vivo. A–C) CTL or sgKDM3A MC38 cells were inoculated into C57BL/6 mice (4 × 106 cells per mouse). Anti‐PD1 antibody was intraperitoneally injected (5 mg kg−1). Timeline of the experimental setup (A). MC38 xenograft tumor growth (B) and tumor weight (C) were measured. D–F) CTL or sgKDM3A MFC cells were inoculated into 615 mice (4 × 106 cells per mouse). Anti‐PD1 antibody was intraperitoneally injected (5 mg kg−1). Timeline of the experimental setup (D). Tumor growth (E) and tumor weight (F) of MFC xenografts were measured. n = 5 per group; Data are presented as the means ± SDs; ns, not significant; *p < 0.05; **p < 0.01; ***p < 0.001.

References

    1. Sung H., Ferlay J., Siegel R. L., Laversanne M., Soerjomataram I., Jemal A., Bray F., Ca‐Cancer J. Clin. 2021, 71, 209. - PubMed
    1. a) Satoh T., Xu R. H., Chung H. C., Sun G. P., Doi T., Xu J. M., Tsuji A., Omuro Y., Li J., Wang J. W., Miwa H., Qin S. K., Chung I. J., Yeh K. H., Feng J. F., Mukaiyama A., Kobayashi M., Ohtsu A., Bang Y. J., J. Clin. Oncol. : Off. J. Am. Soc. Clin. Oncol. 2014, 32, 2039; - PubMed
    2. b) Bang Y. J., Van Cutsem E., Feyereislova A., Chung H. C., Shen L., Sawaki A., Lordick F., Ohtsu A., Omuro Y., Satoh T., Aprile G., Kulikov E., Hill J., Lehle M., Rüschoff J., Kang Y. K., Lancet 2010, 376, 687. - PubMed
    1. Janjigian Y. Y., Shitara K., Moehler M., Garrido M., Salman P., Shen L., Wyrwicz L., Yamaguchi K., Skoczylas T., Campos Bragagnoli A., Liu T., Schenker M., Yanez P., Tehfe M., Kowalyszyn R., Karamouzis M. V., Bruges R., Zander T., Pazo‐Cid R., Hitre E., Feeney K., Cleary J. M., Poulart V., Cullen D., Lei M., Xiao H., Kondo K., Li M., Ajani J. A., Lancet 2021, 398, 27. - PMC - PubMed
    1. a) Lu Z., Yang S., Luo X., Shi Y., Lee J. S., Deva S., Liu T., Chao Y., Zhang Y., Huang R., Xu Y., Shen Z., Shen L., Gastric Cancer 2022, 25, 943. - PMC - PubMed
    2. b) Zhang P., Liu M., Cui Y., Zheng P., Liu Y., Brief. Bioinform.s 2021, 22, bbaa180;
    3. c) Le D. T., Uram J. N., Wang H., Bartlett B. R., Kemberling H., Eyring A. D., Skora A. D., Luber B. S., Azad N. S., Laheru D., Biedrzycki B., Donehower R. C., Zaheer A., Fisher G. A., Crocenzi T. S., Lee J. J., Duffy S. M., Goldberg R. M., de la Chapelle A., Koshiji M., Bhaijee F., Huebner T., Hruban R. H., Wood L. D., Cuka N., Pardoll D. M., Papadopoulos N., Kinzler K. W., Zhou S., Cornish T. C., et al., N. Engl. J. Med. 2015, 372, 2509. - PMC - PubMed
    1. a) Maio M., Ascierto P. A., Manzyuk L., Motola‐Kuba D., Penel N., Cassier P. A., Bariani G. M., De Jesus Acosta A., Doi T., Longo F., Miller W. H., Oh D. Y., Gottfried M., Xu L., Jin F., Norwood K., Marabelle A., Ann. Oncol. : Off. J. Eur. Soc. Med. Oncol. 2022, 33, 929; - PubMed
    2. b) Saeed A., Park R., Dai J., Al‐Rajabi R., Kasi A., Baranda J., Williamson S., Saeed A., Ripp J., Collins Z., Mulvaney K., Shugrue M., Firth‐Braun J., Godwin A. K., Madan R., Phadnis M., Sun W., Cell Rep. 2023, 4, 100916,; - PMC - PubMed
    3. c) Liu Y., Sethi N. S., Hinoue T., Schneider B. G., Cherniack A. D., Sanchez‐Vega F., Seoane J. A., Farshidfar F., Bowlby R., Islam M., Kim J., Chatila W., Akbani R., Kanchi R. S., Rabkin C. S., Willis J. E., Wang K. K., McCall S. J., Mishra L., Ojesina A. I., Bullman S., Pedamallu C. S., Lazar A. J., Sakai R., Thorsson V., Bass A. J., Laird P. W., Cancer Cell 2018, 33, 721; - PMC - PubMed
    4. d) Zhao W., Jia Y., Sun G., Yang H., Liu L., Qu X., Ding J., Yu H., Xu B., Zhao S., Xing L., Chai J., Nat. Commun. 2023, 14, 2985; - PMC - PubMed
    5. e) Kwon M., An M., Klempner S. J., Lee H., Kim K. M., Sa J. K., Cho H. J., Hong J. Y., Lee T., Min Y. W., Kim T. J., Min B. H., Park W. Y., Kang W. K., Kim K. T., Kim S. T., Lee J., Cancer Discov. 2021, 11, 2168; - PubMed
    6. f) Chen J., Liu K., Luo Y., Kang M., Wang J., Chen G., Qi J., Wu W., Wang B., Han Y., Shi L., Wang K., Han X., Ma X., Liu W., Ding Y., Wang L., Liang H., Wang L., Chen J., Gastroenterology 2023, 165, 88. - PubMed

MeSH terms

Substances

LinkOut - more resources