. 2024 Aug;11(32):e2404171.
doi: 10.1002/advs.202404171. Epub 2024 Jun 20.

Mesenchymal Stem Cell Membrane-Camouflaged Liposomes for Biomimetic Delivery of Cyclosporine A for Hepatic Ischemia-Reperfusion Injury Prevention

Affiliations

Mesenchymal Stem Cell Membrane-Camouflaged Liposomes for Biomimetic Delivery of Cyclosporine A for Hepatic Ischemia-Reperfusion Injury Prevention

Haitian Chen et al. Adv Sci (Weinh). 2024 Aug.

Abstract

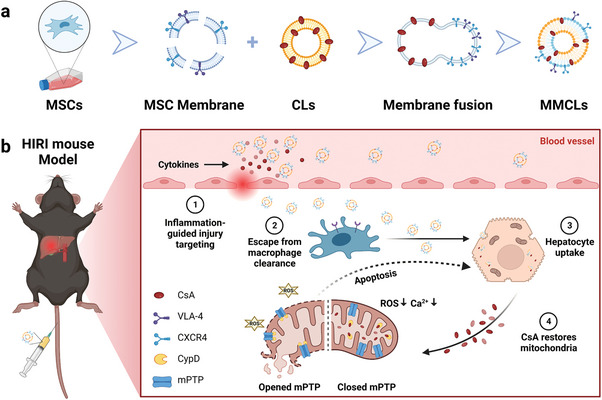
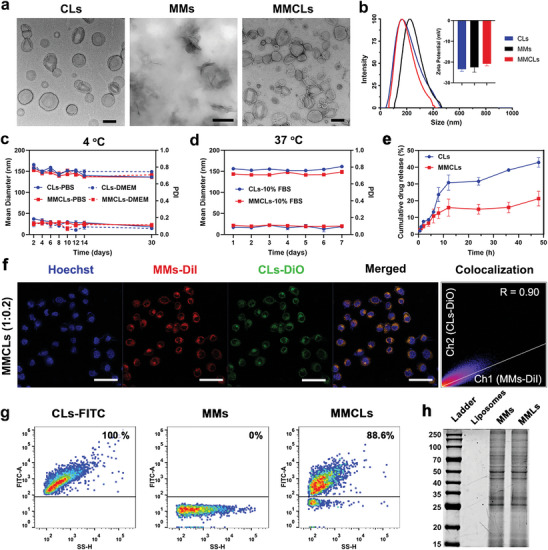
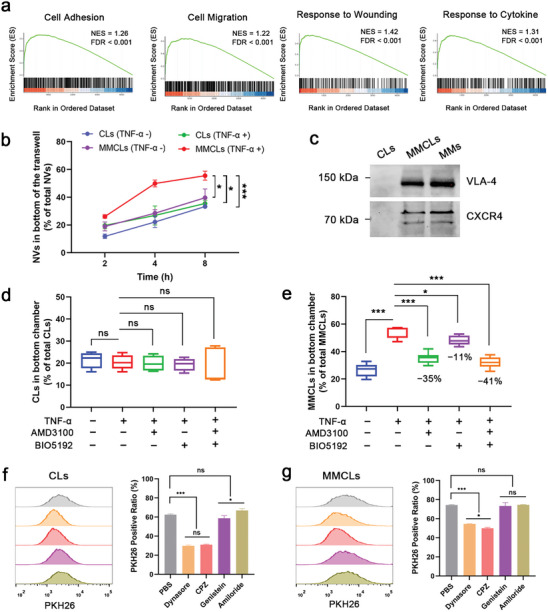
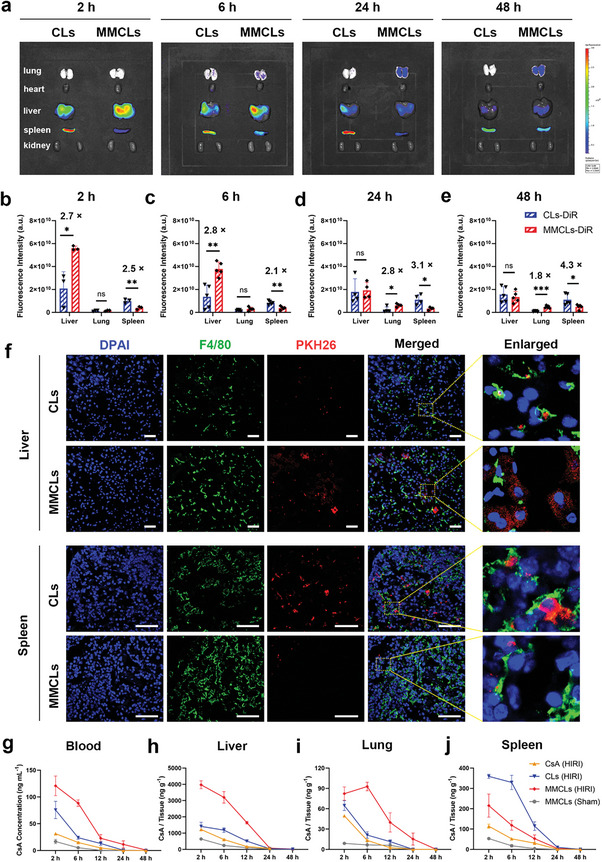
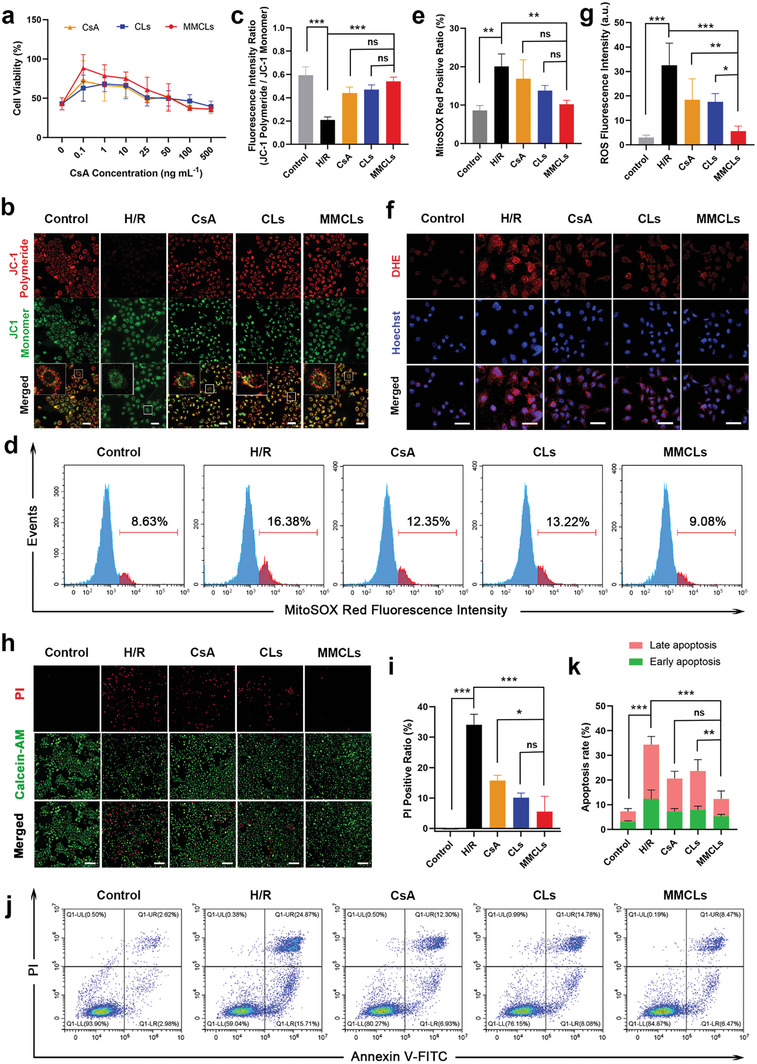
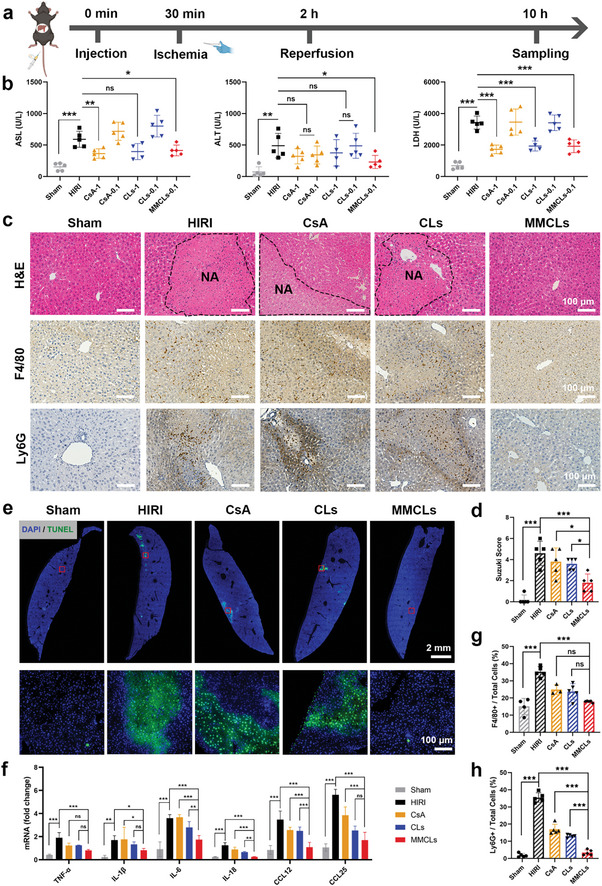
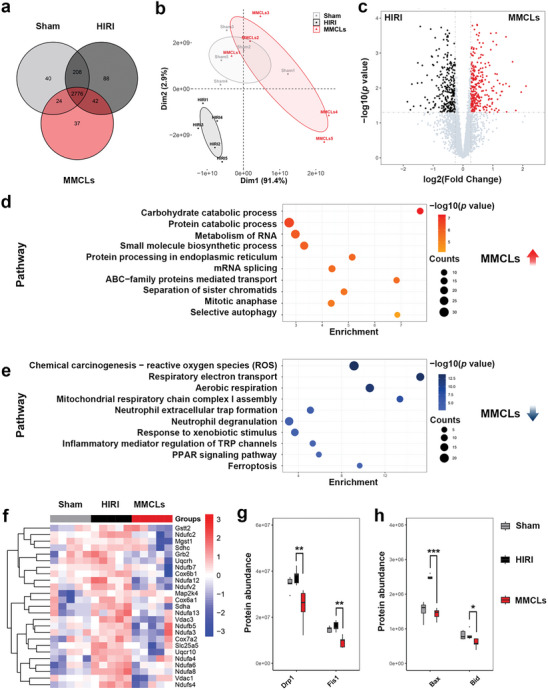
Hepatic ischemia-reperfusion injury (HIRI) is a prevalent issue during liver resection and transplantation, with currently no cure or FDA-approved therapy. A promising drug, Cyclosporin A (CsA), ameliorates HIRI by maintaining mitochondrial homeostasis but has systemic side effects due to its low bioavailability and high dosage requirements. This study introduces a biomimetic CsA delivery system that directly targets hepatic lesions using mesenchymal stem cell (MSC) membrane-camouflaged liposomes. These hybrid nanovesicles (NVs), leveraging MSC-derived proteins, demonstrate efficient inflammatory chemotaxis, transendothelial migration, and drug-loading capacity. In a HIRI mouse model, the biomimetic NVs accumulated at liver injury sites entered hepatocytes, and significantly reduced liver damage and restore function using only one-tenth of the CsA dose typically required. Proteomic analysis verifies the protection mechanism, which includes reactive oxygen species inhibition, preservation of mitochondrial integrity, and reduced cellular apoptosis, suggesting potential for this biomimetic strategy in HIRI intervention.

Keywords: biomimetic delivery; cyclosporine A; ischemia‐reperfusion injury; mesenchymal stem cell.


Conflict of interest statement

The authors declare no conflict of interest.

Figures

Scheme 1
Scheme 1
Schematic illustration of using biomimetic nanovesicles to prevent HIRI by MMs with CLs. a) Construction of MMCLs by the extrusion method. b) MMCLs exhibited inflammation chemotaxis to the hepatic lesion site and escaped from macrophage clearance after tail intravenous injection. Hepatocyte uptake of MMCLs can release CsA to bind with CypD on the mitochondrial membrane, close the mPTP, alleviate mitochondrial dysfunction, and reduce cell apoptosis.
Figure 1
Figure 1
Characterization of CLs, MMs, and MMCLs. a) Morphology of CLs, MMs, and MMCLs under TEM. b) DLS size distribution and zeta potentials of CLs, MMs, and MMCLs. c) Time‐dependent colloidal stability and dispersibility of CLs and MMCLs in PBS or DMEM at 4 °C for 30 days. d) Time‐dependent stability and dispersibility of CLs and MMCLs in 10% FBS at 37 °C for 7 days. e) Drug release profile of CLs and MMCLs in PBS buffer containing 0.5% Tween 80 under 37 °C for 48 h. f) Colocalization analysis of CLs and MMs after co‐extruded at phospholipid‐to‐membrane protein ratio of 1:0.2 and incubated with AML12 cells for 2 h. CLs were labeled by DiO and MMs were labeled by DiI, as visualized using a CLSM. Scale bar: 50 µm. g) The FITC‐positive ratio of CLs‐FITC, MMs, and MMCLs after co‐extruded at phospholipid‐to‐membrane protein ratio of 1:0.2 as detected by nano‐flow cytometry. h) The protein profile of liposomes, MMs, and MMLs as measured by SDS‐PAGE.
Figure 2
Figure 2
Inflammatory chemotaxis and endocytosis pathway of CLs and MMCLs. a) Gene Set Enrichment Analysis (GSEA) of MMs. Enrichment plots for significant datasets enriched in GSEA analysis show the profile of the normalized ES and false discovery rate (FDR) ratio. b) The amount of NVs in the bottom chamber at 2, 4, and 8 h after the addition of PKH26‐labeled CLs or MMCLs (n = 3). c) CXCR4 and VLA‐4 expression of CLs, MMCLs, and MMs detected by western blot assay. Inhibition by AMD3100 and BIO5192 of the suppression of transendothelial migration capability of PKH26‐labeled d) CLs and e) MMCLs (n = 5). Flow cytometry analysis and quantification of mean fluorescence intensity of PKH26‐labeled f) CLs and g) MMCLs internalized by AML12 cells under different endocytosis inhibitors (n = 3). Data are presented as mean ± SD. The statistical significance was analyzed using one‐way ANOVA following Tukey's multiple comparisons test (*p < 0.05; **p < 0.01; ***p < 0.001, ns = no significance).
Figure 3
Figure 3
Biodistribution and pharmacokinetic behavior of CsA, CLs, and MMCLs in a HIRI mice model through tail vein injection. a) Ex vivo tissue distribution of DiR‐labeled CLs and MMCLs in the main organs at different time points and the corresponding fluorescence signals of liver, lung, and spleen at b) 2 h, c) 6 h, d) 24 h, and e) 48 h after reperfusion (data are analyzed using two‐tailed t‐test, n = 5, *p < 0.05; **p < 0.01; ***p < 0.001; and ns, no significant difference). f) Immunofluorescence images of liver and spleen sections after intravenous administration of PKH26‐labeled CLs or MMCLs, with cell nuclei stained blue (DAPI) and macrophages stained green (F4/80). Scale bar: 50 µm. Quantification of the concentration of CsA in g) blood, h) liver, i) lung, and j) spleen after injection of free CsA, CLs, or MMCLs (at a CsA dose of 0.1 mg kg−1) into HIRI mice or sham‐operated mice (n = 3). The samples were homogenized and subjected to quantification of CsA concentration through LC‐MS analysis.
Figure 4
Figure 4
Verification of the protection effect of MMCLs on H/R‐injured AML12 cells in vitro. a) Cell viability of H/R‐injured cells after being treated with free CsA, CLs, and MMCLs at CsA concentrations of 0 − 500 ng mL−1 as evaluated by CCK‐8 assay. b) JC‐1 mitochondrial membrane potential in normal cells and H/R‐injured cells following the treatment with CsA, CLs, and MMCLs as imaged by CLSM (scale bar: 50 µm), and c) the corresponding fluorescence intensity ratio of JC‐1 polymeride and monomer (n = 5). d) Flow cytometry analysis of the superoxide levels using MitoSOX Red staining, and e) the corresponding positive ratio of MitoSOX Red (n = 5). f) CLSM images of AML12 cells stained by DHE (scale bar: 50 µm), and g) the corresponding fluorescence intensity of intracellular ROS (n = 5). h) HCI analysis of cell death using PI staining (scale bar: 200 µm) and i) the corresponding positive ratio of PI (n = 5). j) Flow cytometry analysis of early and late apoptosis by annexin V‐FITC/PI dual staining assay, and k) the corresponding rates of early and late apoptosis (n = 5). Data are presented as mean ± SD. The statistical significance was analyzed using one‐way ANOVA following Tukey's multiple comparisons test (*p < 0.05; **p < 0.01; ***p < 0.001, ns = no significance).
Figure 5
Figure 5
Alleviation of the hepatic injury by CsA, CLs, and MMCLs in a HIRI mouse model. a) Schematic illustration for the drug treatments in HIRI mice. C57BL/6 mice were intravenously injected with PBS, CsA, CLs, or MMCLs, followed by an I/R procedure, and then the blood and liver samples were collected 10 h after injection. A sham‐operated group of healthy mice (Sham) was set as a control. b) Evaluation of liver functions of AST, ALT, and LDH after administration of PBS, CsA, CLs, or MMCLs at a CsA dosage of 0.1 or 1 mg kg−1 (n = 5). c) H&E staining and immunohistochemical staining of liver sections in different treatment groups. NA, necrotic area. Macrophages were stained using F4/80 and neutrophils using Ly6G. d) Suzuki scores of the H&E staining (n = 5). e) TUNEL images visualized by a panoramic scanning microscope and the enlarged images of the red boxes. f) The mRNA expression of inflammatory cytokines and chemokines in hepatic tissues was measured by RT‐qPCR (n = 5). Percentage of g) macrophages (F4/80+) and h) neutrophils (Ly6G+) in total cells of liver sections after the indicated treatments (n = 5). Data are presented as mean ± SD. The statistical significance was analyzed using one‐way ANOVA following Tukey's multiple comparisons test (*p < 0.05; **p < 0.01; ***p < 0.001, ns = no significance).
Figure 6
Figure 6
Protein profile analysis of liver samples from the Sham group, HIRI group, and MMCLs treatment group. a) Venn diagram showing the overlap of high‐quality proteins. b) Principal components analysis of the enriched proteins. c) Volcano diagram showing the differently expressed proteins between the HIRI and the MMCLs treatment group, fold change > 1.2 or < 0.8, p < 0.05. Functional enrichment analysis of the differently expressed proteins d) upregulated or e) downregulated in the MMCLs treatment group compared to the HIRI group. f) Heatmap generated by clustering of the differentially expressed proteins in the three groups. Red: up‐regulation; blue: downregulation. The expression quantity of the corresponding proteins enriched in positive regulation of g) mitochondrial fission and h) cellular apoptosis. Data are analyzed using a two‐tailed t‐test, *p < 0.05; **p < 0.01; ***p < 0.001.

References

    1. Wertheim J. A., Petrowsky H., Saab S., Kupiec‐Weglinski J. W., Busuttil R. W., Am. J. Transplant. 2011, 11, 1773. - PMC - PubMed
    1. Zhai Y., Petrowsky H., Hong J. C., Busuttil R. W., Kupiec‐Weglinski J. W., Nat. Rev. Gastro. Hepat. 2013, 10, 79. - PMC - PubMed
    1. Monga S. P., Nat. Med. 2018, 24, 6. - PubMed
    1. Pabla N., Bajwa A., Nephron 2022, 146, 253. - PMC - PubMed
    1. Teodoro J. S., Da Silva R. T., Machado I. F., Panisello‐Roselló A., Roselló‐Catafau J., Rolo A. P., Palmeira C. M., Cells 2022, 11, 688. - PMC - PubMed

Grants and funding

LinkOut - more resources