. 2025 Feb;34(1):19-32.
doi: 10.1111/imb.12946. Epub 2024 Jul 19.

'Drifting' Buchnera genomes track the microevolutionary trajectories of their aphid hosts

Affiliations

'Drifting' Buchnera genomes track the microevolutionary trajectories of their aphid hosts

Joshua A Thia et al. Insect Mol Biol. 2025 Feb.

Abstract

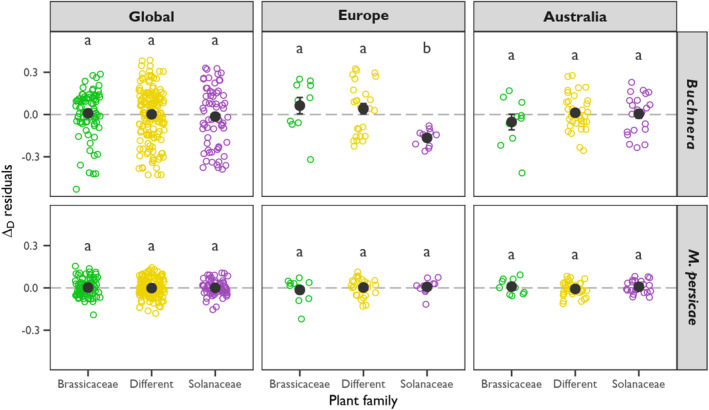
Evolution of Buchnera-aphid host symbioses is often studied among species at macroevolutionary scales. Investigations within species offer a different perspective about how eco-evolutionary processes shape patterns of genetic variation at microevolutionary scales. Our study leverages new and publicly available whole-genome sequencing data to study Buchnera-aphid host evolution in Myzus persicae, the peach potato aphid, a globally invasive and polyphagous pest. Across 43 different asexual, clonally reproducing isofemale strains, we examined patterns of genomic covariation between Buchnera and their aphid host and considered the distribution of mutations in protein-coding regions of the Buchnera genome. We found Buchnera polymorphisms within aphid strains, suggesting the presence of genetically different Buchnera strains within the same clonal lineage. Genetic distance between pairs of Buchnera samples was positively correlated to genetic distance between their aphid hosts, indicating shared evolutionary histories. However, there was no segregation of genetic variation for both M. persicae and Buchnera with plant host (Brassicaceae and non-tobacco Solanaceae) and no associations between genetic and geographic distance at global or regional spatial scales. Abundance patterns of non-synonymous mutations were similar to synonymous mutations in the Buchnera genome, and both mutation classes had similar site frequency spectra. We hypothesize that a predominance of neutral processes results in the Buchnera of M. persicae to simply 'drift' with the evolutionary trajectory of their aphid hosts. Our study presents a unique microevolutionary characterization of Buchnera-aphid host genomic covariation across multiple aphid clones. This provides a new perspective on the eco-evolutionary processes generating and maintaining polymorphisms in a major pest aphid species and its obligate primary endosymbiont.

Keywords: Myzus persicae; eco‐evolutionary dynamics; endosymbionts; population genomics.


Conflict of interest statement

The authors declare no conflict of interests associated with this work.

Figures

FIGURE 1
FIGURE 1
Global distribution of clonal Myzus persicae samples used in this study. Points are coloured by plant host family (see legend). See Table S1 for associated metadata.
FIGURE 2
FIGURE 2
Patterns of genetic diversity in Buchnera and their Myzus persicae hosts. Genetic diversity within clones (y‐axis) was measured as a function of host plant (x‐axis). For Buchnera, genetic diversity is the proportion of sites that are polymorphic across haploid genomes within a clonal strain. For the M. persicae host, genetic diversity is the genomic heterozygosity of the diploid genome within a clonal strain. Open points represent clonal strains, and large closed circles represent the mean with standard error bars. Panels separate estimates for Buchnera (left) and M. persicae hosts (right). Letters delineate significant groups for the hypothesis that genetic diversity differs between plant hosts.
FIGURE 3
FIGURE 3
Patterns of pairwise genetic differentiation among samples. In all plots, points represent pairs of samples, coloured by host plant (see legend: within Brassicaceae, within Solanaceae or between ‘different’ plant families). Rows represent different partitions of our dataset: (a–c) global; (d–f) Europe; and (g–i) Australia. Columns represent different comparisons of genetic differentiation: (a, d, g) between Buchnera samples (y‐axis) as a function of geographic distance in megametres (x‐axis); (c, e, h) between M. persicae samples (y‐axis) as a function of geographic distance in megametres (x‐axis); and (c, f, i) between Buchnera samples (y‐axis) as a function of genetic differentiation between M. persicae samples (x‐axis) and hypothetical 1:1 relationship with dashed lines.
FIGURE 4
FIGURE 4
Aligned phylogenetic trees for Buchnera and aphid host genomes in Myzus persicae. The Buchnera tree is on the left, and the aphid host tree is on the right. Points on tree tips and sample labels are coloured by host plant; where known, post hoc microsatellite clonal classification is depicted by point shapes (see legend). Node support is indicated as the proportion of 100 bootstrap replicates with values >0.9 presented. The scale bar indicates the relative genetic distance.
FIGURE 5
FIGURE 5
Genetic differentiation between samples of Buchnera or M. persicae from the same host plant family (within Brassicaceae or Solanaceae) or ‘different’ host plants (Brassicaceae vs. Solanaceae). Plots depict residual variation in pairwise genetic differentiation (y‐axis) as a function of host plant (x‐axis). Open points represent pairs of clonal samples, and large filled points represent the mean with standard error bars. Lowercase letters denote a significant difference within each group. The dashed grey line delimits a mean of zero. Each panel represents a different combination of organism (Buchnera or M. persicae, in rows) and dataset partition (global, European or Australian, in columns).
FIGURE 6
FIGURE 6
Distribution of non‐synonymous and synonymous mutations along the Buchnera phylogenetic tree. Points on the tree tips and sample labels are coloured by host plant; where known, a post hoc microsatellite clonal classification is depicted by point shapes (see legend). Node support is indicated as the proportion of 100 bootstrap replicates, with values >0.9 presented. The scale bar indicates the relative distance. Panels depict the number of mutations (x‐axis) per sample (y‐axis) for non‐synonymous (left) and synonymous (right) sites. Bars are portioned and coloured by relative counts of different alternate allele frequency bins (<5%, 5%–95% and >95%, see legend). Classification of non‐synonymous versus synonymous mutations is relative to the reference genome, GenBank Accession CP002697.1.

References

    1. Argandona, J.A. , Kim, D. & Hansen, A.K. (2023) Comparative transcriptomics of aphid species that diverged > 22 MYA reveals genes that are important for the maintenance of their symbiosis. Scientific Reports, 13(1), 1–12. Available from: 10.1038/s41598-023-32291-3 - DOI - PMC - PubMed
    1. Bass, C. & Field, L.M. (2011) Gene amplification and insecticide resistance. Pest Management Science, 67(8), 886–890. Available from: 10.1002/ps.2189 - DOI - PubMed
    1. Bennett, G.M. & Moran, N.A. (2015) Heritable symbiosis: the advantages and perils of an evolutionary rabbit hole. PNAS, 112(33), 10169–10176. Available from: 10.1073/pnas.1421388112 - DOI - PMC - PubMed
    1. Bourguignon, T. , Kinjo, Y. , Villa‐Martín, P. , Coleman, N.V. , Tang, Q. , Arab, D.A. et al. (2020) Increased mutation rate is linked to genome reduction in prokaryotes. Current Biology, 30(19), 3848–3855.e4. Available from: 10.1016/j.cub.2020.07.034 - DOI - PubMed
    1. Burger, N.F.V. , Nicolis, V.F. & Botha, A. (2024) Host‐specific co‐evolution likely driven by diet in Buchnera aphidicola. BMC Genomics, 25, 153. Available from: 10.21203/rs.3.rs-3493959/v1 - DOI - PMC - PubMed

Publication types

LinkOut - more resources