. 2024 Jul;14(7):e1776.
doi: 10.1002/ctm2.1776.

Novel chimeric antigen receptors for the effective and safe treatment of NY-BR-1 positive breast cancer

Affiliations

Novel chimeric antigen receptors for the effective and safe treatment of NY-BR-1 positive breast cancer

Dirk Jäger et al. Clin Transl Med. 2024 Jul.
No abstract available


Conflict of interest statement

Dirk Jäger, Inka Zörnig and Patrick Schmidt are owners and inventors on the patents WO2023/083982 and WO2023/083985 regarding the commercial use of CAR‐T cells targeting NY‐BR‐1.

Figures
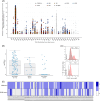
FIGURE 1
FIGURE 1
NY‐BR‐1 Expression analyses. (A) Normalized NY‐BR‐1 RNAseq data derived from The Cancer Genome Atlas (TCGA) datasets is shown, correlated with metastatic status (AJCC Metastasis Stage Code) and grouped by tumour entity (Study of Origin). Each dot represents a study sample, data was analyzed at cbioportal.org. (B) NY‐BR‐1 expression across intrinsic subtypes of an institutional, real‐world, metastatic breast cancer cohort (RNAseq, normalized by transcripts per kilobase million). (C) Representative FACS plot of two NY‐BR‐1 surface stainings using clone2 mAb on pleural effusion cells derived from breast cancer patients. Score1 indicates an MFI change to isotype control < 10‐fold, and Score2 indicates an MFI change to isotype control ≥10‐fold. (D) Combined scoring analysis of 91 primary breast cancer samples based on FACS stainings for HER2 and NY‐BR‐1 shows a positivity rate of 47.25% (43/91 samples) with respect to NY‐BR‐1 protein.
FIGURE 2
FIGURE 2
Cross‐reactivity investigations on new binders and in vitro functionality assays of anti‐NY‐BR‐1 chimeric antigen receptor (CAR)‐T cells. (A) PEPperMAP technology of overlapping peptide scanning exposes the clone2 epitope sequence. Shown here is the median fluorescence intensity of the secondary PE‐conjugated anti‐mouse Ab detecting clone2 mAb bound to a chip spotted with the indicated peptide sequences (left panel—each peptide was spotted on chip in triplicates). (B) Sequence alignment of the NY‐BR‐1 peptide used for clone2 mAb generation with NY‐BR‐1.1 full‐length protein reveals a highly similar sequence to the clone2 epitope in NY‐BR‐1.1. RNAseq data of NY‐BR‐1.1 derived from proteinatlas.org shows detectable NY‐BR‐1.1 signals in neuronal and sperm cells (lower panel). (C) Epitope discovery data of 10D11 and clone3 mAbs derived as in A is displayed. (D) FACS histogram plots of NY‐BR‐1 or −1.1 transfected BOSC23 cells incubated with serial dilutions of 10D11 and clone3 mAbs (purified mAb or hybridoma supernatant) followed by PE‐conjugated secondary anti‐mouse immunoglobulin G (IgG) Ab (upper two panels) or with fusion proteins in scFv‐Fc format (i.e. extracellular CAR domain) followed by PE‐conjugated secondary anti‐human IgG Ab. (E) Bar plot of interferon (IFN)γ secretion ELISA of supernatant derived from incubation of anti‐NY‐BR‐1 CAR‐T cells on protein‐coated plates (Mean ± SD n = 3; two‐tailed unpaired t‐test). (F) FACS plot images of CAR+ T cells 2 days after genetic engineering detected by the anti‐human IgG Ab. (G) Real‐time cytotoxicity assay of CAR‐T cells co‐cultivated with human pleural effusion cells from breast cancer patients. Measurement was done every 5 min with technical triplicates, dashed lines represent SD. (H) Bar plot of IFNγ ELISA derived from the supernatant of B at assay endpoint (Mean ± SD, one‐way analysis of variance [ANOVA] with multiple comparisons, Tukey corrected).
FIGURE 3
FIGURE 3
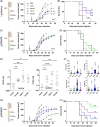
In vivo activity of NY‐BR‐1 directed chimeric antigen receptor (CAR)‐T cells in dependency of the mode of genetic engineering. (A) Tumour growth curves and (B) Kaplan‐Meier plot of mice bearing xenotransplanted tumour cells and treated with a single dose of lentivirally engineered CAR‐T cells. The arrow indicates the time of treatment, seven mice treated per group, and mean tumour growth plotted with SD (Ordinary two‐way analysis of variance [ANOVA] with Bonferroni corrected multiple comparisons). Survival proportions are plotted according to the number of subjects at risk (Log‐rank Mantel‐Cox test). (C) Mean tumour growth and (D) survival as in (A) for CAR‐T cells engineered with DNA vectors. (E) Scatter plots of FACS analyses from individual mice derived from (C). The amount of human CD3+ cells was determined in the suspension of tumour and splenic cells (n = 7; Kruskal‐Wallis test with uncorrected Dunn's test for multiple comparisons). (F) Violin plots of multiplexed cytokine measurement data of blood samples derived from (B) (n = 7; Wilcoxon signed‐rank test). (G) Mean tumour growth and (H) survival as in (A), for CAR‐T cells engineered with DNA vectors harbouring modified co‐stimulatory domains.
FIGURE 4
FIGURE 4
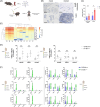
Safety investigations on anti‐NY‐BR1 chimeric antigen receptor (CAR)‐T cells. (A) Schematic overview of experimental design. (B) Representative IHC micrographs of CD3+ infiltration into affected organs at x40 magnification, the bar represents 500 μm. (C) Quantification of infiltrated T cells in CAR‐treated transgenic or wildtype mice determined by HALO software algorithm on tissue sections (n = 3 per tissue). (D) Heatmap of log2 fold change of multiplexed plasma cytokine measurements derived from transgenic and wildtype mice injected with clone2 CAR‐T cells, 24 h post‐injection. Non‐injected mice served as baseline control (n = 5, Euclidean distance measure with average linkage; Data analyzed using the ClustVis tool). (E) Scatter plots of FACS analyses from individual transgenic or wild‐type mice treated with syngeneic CAR‐T cells. The amount of CD3+/CAR+ cells was determined in suspension splenic cells (n = 5; Ordinary two‐way analysis of variance [ANOVA] with Bonferroni corrected multiple comparisons). (F) Violin plots of multiplexed cytokine measurement data of blood samples according to B (n = 5; Wilcoxon signed‐rank test).

References

    1. Rosenberg SA, Restifo NP. Adoptive cell transfer as personalized immunotherapy for human cancer. Science. 2015;348:62‐68. doi: 10.1126/science.aaa4967 - DOI - PMC - PubMed
    1. Chen Y‐J, Abila B, Mostafa Kamel Y. CAR‐T: what is next? Cancers. 2023;15:663. doi: 10.3390/cancers15030663 - DOI - PMC - PubMed
    1. Varga Z, Theurillat J‐P, Filonenko V, et al. Preferential nuclear and cytoplasmic NY‐BR‐1 protein expression in primary breast cancer and lymph node metastases. Clinical Cancer Research. 2006;12:2745‐2751. doi: 10.1158/1078-0432.CCR-05-2192 - DOI - PubMed
    1. Theurillat J‐P, Zürrer‐Härdi U, Varga Z, et al. Distinct expression patterns of the immunogenic differentiation antigen NY‐BR‐1 in normal breast, testis and their malignant counterparts. Int J Cancer. 2008;122:1585‐1591. doi: 10.1002/ijc.23241 - DOI - PubMed
    1. Seil I, Frei C, Sültmann H, et al. The differentiation antigen NY‐BR‐1 is a potential target for antibody‐based therapies in breast cancer. Int J Cancer. 2007;120:2635‐2642. doi: 10.1002/ijc.22620 - DOI - PubMed

Substances

Grants and funding

LinkOut - more resources