. 2024 Oct:121:192-210.
doi: 10.1016/j.bbi.2024.07.010. Epub 2024 Jul 18.

Autoimmune inflammation triggers aberrant astrocytic calcium signaling to impair synaptic plasticity

Affiliations

Autoimmune inflammation triggers aberrant astrocytic calcium signaling to impair synaptic plasticity

A M Baraibar et al. Brain Behav Immun. 2024 Oct.

Abstract

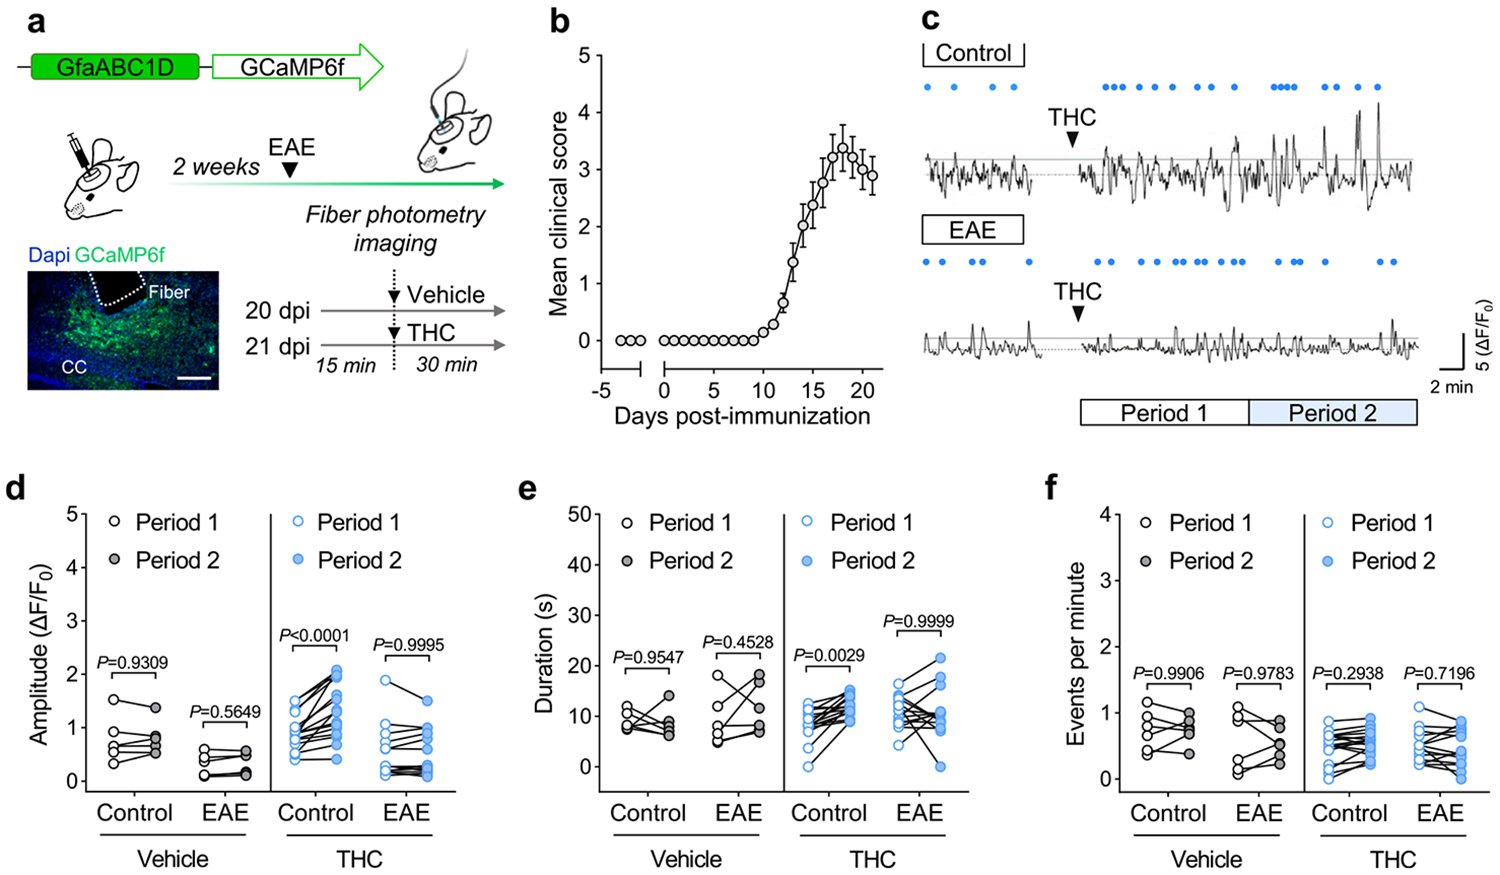
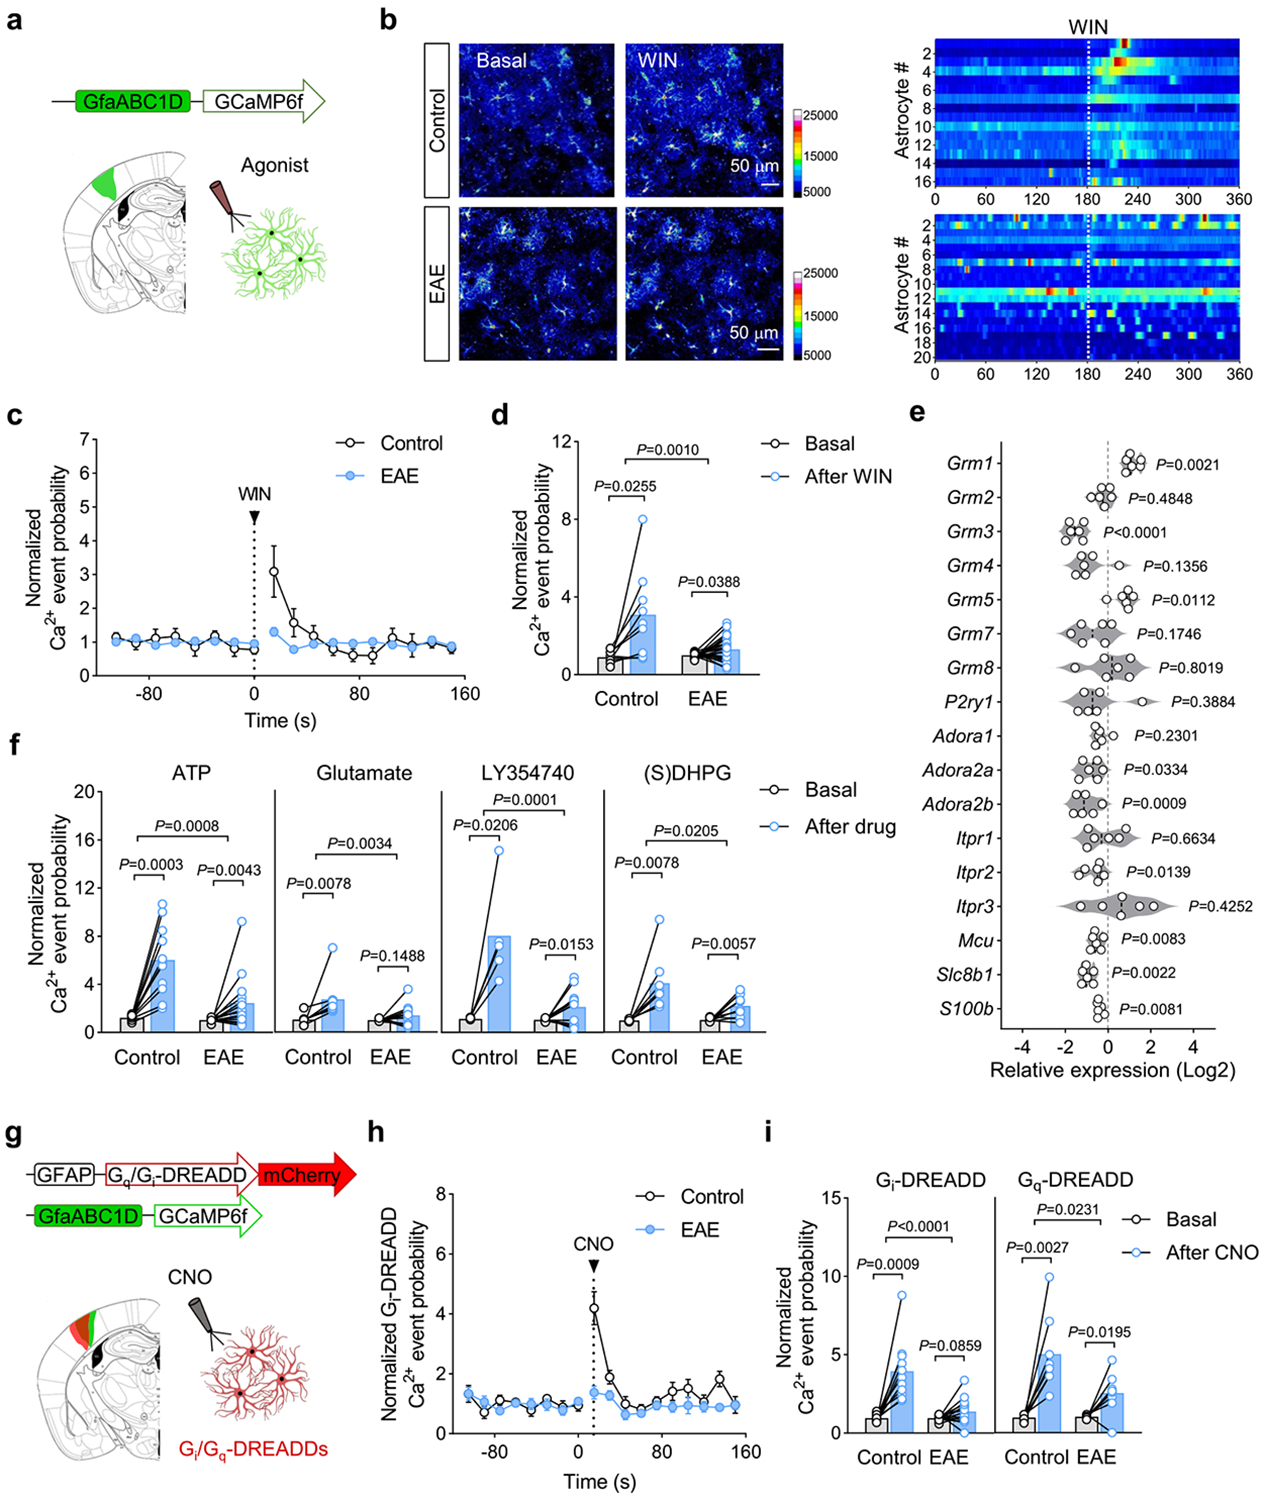
Cortical pathology involving inflammatory and neurodegenerative mechanisms is a hallmark of multiple sclerosis and a correlate of disease progression and cognitive decline. Astrocytes play a pivotal role in multiple sclerosis initiation and progression but astrocyte-neuronal network alterations contributing to gray matter pathology remain undefined. Here we unveil deregulation of astrocytic calcium signaling and astrocyte-to-neuron communication as key pathophysiological mechanisms of cortical dysfunction in the experimental autoimmune encephalomyelitis (EAE) model of multiple sclerosis. Using two-photon imaging ex vivo and fiber photometry in freely behaving mice, we found that acute EAE was associated with the emergence of spontaneously hyperactive cortical astrocytes exhibiting dysfunctional responses to cannabinoid, glutamate and purinoreceptor agonists. Abnormal astrocyte signaling by Gi and Gq protein coupled receptors was observed in the inflamed cortex. This was mirrored by treatments with pro-inflammatory factors both in vitro and ex vivo, suggesting cell-autonomous effects of the cortical neuroinflammatory environment. Finally, deregulated astrocyte calcium activity was associated with an enhancement of glutamatergic gliotransmission and a shift of astrocyte-mediated short-term and long-term plasticity mechanisms towards synaptic potentiation. Overall, our data identify astrocyte-neuronal network dysfunctions as key pathological features of gray matter inflammation in multiple sclerosis and potentially additional neuroimmunological disorders.

Keywords: Astrocyte; Calcium; Cortex; Gliotransmission; Multiple sclerosis.


Figures

Fig. 1.
Fig. 1.
Spontaneous hyperactivity of cortical astrocytes during EAE. (a) Experimental approach for ex vivo recording of astrocytic calcium activity in the mouse somatosensory cortex during EAE. Two-photon imaging was performed in cortical slices from control and EAE mice injected with GFAP-GCaMP6f viral particles. (b) Neurological score mice included in the analysis of spontaneous calcium activity in cortical astrocytes (13–20 dpi). (c) Representative images and individual traces of astrocyte calcium events accumulated over a 3 min period in acute cortical slices from control (top) and EAE (bottom) mice. (d) Heat maps and raster plots depicting calcium levels and spontaneous events along time in control and EAE astrocytes. (e-g) Analysis of calcium event frequency, duration and amplitude in cortical astrocytes from control (28 slices, 5 mice) and EAE (53 slices, 8 mice) conditions. (f) Left: Representative histogram showing the percentage of astrocyte calcium events and their duration in control and immunized mice. Box: percentages of events with longer duration in EAE mice and representative traces from control (gray) and EAE (blue) astrocytes. Right: width of calcium events in cortical astrocytes from naïve and immunized mice. Data were analyzed with unpaired t test or Mann-Whitney test. Error bars express SEM.
Fig. 2.
Fig. 2.
EAE impairs CB1 receptor-mediated astrocyte calcium responses. (a) Fiber photometry approach for in vivo recording of astrocytic calcium responses to THC in EAE mice. Fiber photometry imaging was performed in control and EAE mice on 2 independent recording sessions at 20 dpi (vehicle) and 21 dpi (THC). Below: representative image of GCaMP6s expression in the somatosensory cortex. DAPI is marked in blue and GCaMP6s in green. Scale bar: 200 μm. (b) Neurological score of EAE mice included in the study (14 mice; 3 independent EAE experiments). (c) Representative recordings from the mouse somatosensory cortex showing the effect of THC (10 mg/Kg; i.p.) on astrocytic calcium activity in control (top) and EAE (bottom) mice. Blue dots correspond to detected transients above the threshold (median + 2*MAD) in mice injected with vehicle and THC. White and blue rectangles show the time window of analyzed period 1 and period 2, respectively. The first minute before and after injection was removed to exclude mouse-handling/injection effects. (df) Quantitative analysis of astrocyte calcium responses to vehicle and THC in control and EAE mice (6–16 mice per experimental group). Data were analyzed by two-way ANOVA followed by Šídák’s multiple comparisons test.
Fig. 3.
Fig. 3.
Cell autonomous deregulation of astrocyte calcium signaling pathways during EAE. (a) Ex vivo analysis of neurotransmitter receptor-mediated astrocyte calcium responses during EAE. Agonists were applied locally to the somatosensory cortex in acute slices from mice injected with the AAV vector encoding for GCaMP6f under the Gfa-ABC1D promoter. (b) Left: pseudocolor images obtained from cortical astrocytes of control (top) and EAE (bottom) mice before and after local application of the CB1 receptor agonist WIN55,212-2 (WIN; 300 μM). Right: heat map depicting calcium levels along time following application of the cannabinoid agonist in control and EAE astrocytes. (c) Normalized astrocyte calcium event probability over time showing the effect of WIN in control and immunized mice. (d) Bar graph depicting calcium event probability normalized to basal activity before and after WIN application in control (9 slices, 5 mice) and EAE astrocytes (25 slices, 7 mice). The dotted lines in b and c indicate 5 sec of WIN application. Data were analyzed by two-tailed paired Student’s t test (before and after) and unpaired t test or Mann-Whitney test (between groups). (e) Expression levels of calcium handling genes in astrocytes purified at acute EAE disease relative to those in healthy controls. Data were analyzed by two-tailed unpaired Student’s t test or Mann-Whitney test. (f) Calcium event probability normalized to basal activity before and after application of ATP (200 μM; 11–15 slices, 5–7 mice), glutamate (200 μM; 8–13 slices, 4–6 mice), LY354740 (100 μM; 5–14 slices, 2–2 mice) and (S)DHPG (100 μM; 8–10 slices, 2–2 mice) in control and EAE astrocytes. Data were analyzed by two-tailed paired Student’s t test (before and after) and unpaired t test or Mann-Whitney test (between groups). (g) Ex vivo analysis of Gi and Gq mediated signaling on astrocyte calcium responses during EAE. Clozapine-N-oxide (CNO, 1 mM) was applied locally in acute cortical slices from mice injected with AAV vectors encoding for GCaMP6f and for Gi- or Gq-DREADDs under the astrocyte promoters GFAP or GfaABC1D. (h) Calcium event probability normalized to basal activity over time before and after CNO application in control and EAE mice injected with AAV5-GFAP-Gi-DREADD-mCherry. The dotted line indicates 5 sec of CNO application. (i) Normalized calcium event before and after CNO application in control and EAE astrocytes expressing Gi-DREADDs (11–15 slices; 2–4 mice) or Gq-DREADDs (8–9 slices, 3–3 mice). Data were analyzed by two-tailed Student’s paired t test (before and after) and unpaired t test or Mann-Whitney test (between groups). Error bars express SEM.
Fig. 4.
Fig. 4.
Local inflammation in the cortex of EAE mice. (a) Gene expression analysis of pro-inflammatory mediators and inflammatory markers in the somatosensory cortex of EAE mice at acute disease (16 dpi; 7 mice) relative to those in control animals (5 mice). The mean clinical score of EAE mice included in the analysis is depicted on the right panel. Data were analyzed by two-tailed paired Student’s t test or Mann-Whitney test. (b) Representative images and quantitative analysis of meningeal CD3+ immunopositive T cells in coronal sections of EAE (14 dpi; 6 mice) and control conditions (5 mice) Scale bar = 50 μm. Data were analyzed by two-tailed Mann-Whitney test. (c) Representative confocal images showing the distribution of CD68 immunopositive puncta and Iba1-positive microglia in layer VI of the somatosensory cortex from control and EAE mice (17 dpi). Scale bar = 25 μm. (d) Quantification of CD68 levels within Iba1-positive profiles indicate microglia activation the EAE cortex (5–6 mice). Data were analyzed by two-tailed unpaired Student t test. (e) Representative confocal micrographs depict immunolabeling of the astrocyte reactivity marker GFAP and complement component 3 (C3) in layer VI from control and EAE conditions. Scale bar = 25 μm. (fh) Quantitative analysis of GFAP (f) and C3 (g) levels and C3 expression in astroglial profiles (h) shows augmented astrocyte reactivity in the EAE cortex. Data were analyzed by two-tailed unpaired Student t test. Error bars express SEM.
Fig. 5.
Fig. 5.
Pro-inflammatory signals engage aberrant astrocyte calcium activity. (a) Gene expression analysis of astrocyte calcium handling molecules in cultured cells activated in vitro by incubation with the pro-inflammatory factors TNFα (25 ng/ml), IL-1α (3 ng/ml) and C1q (400 ng/ml) (18–24 h). Data were analyzed by two-tailed paired Student’s t test or Mann-Whitney test. (b) Representative imaging experiments showing calcium responses of individual astrocytes evoked by in vitro exposure to ATP (200 μM). (c) Quantitative analysis of calcium responses by ATP (200 μM), glutamate (200 μM), (S) DHPG (200 μM), LY354740 (200 μM), ATP (200 μM) and thapsigargin (1 μM) in astrocyte cultures incubated with TNFα + IL-1α + C1q. AUC, area under the curve. Data were analyzed by two-tailed paired Student’s t test or Mann-Whitney test. (d) Ex vivo analysis of astrocyte calcium dynamics in response to pro-inflammatory factors. Acute cortical slices from mice injected with the AAV vector encoding for GCaMP6f under the Gfa-ABC1D promoter were imaged following incubation with TNFα + IL-1α C1q (30 min). (e) Heat maps showing astrocytic calcium levels of individual astrocytes along time in cortical slices activated ex vivo with TNFα + IL-1α + C1q. (f) Frequency, duration and amplitude of spontaneous astrocyte calcium events in control conditions (28 slices, 5 mice) and following activation with pro-inflammatory factors (22 slices, 4 mice). Data were analyzed by two-tailed unpaired Student’s t test. (g) Calcium event probability normalized to basal activity over time depicting the effect of ATP (200 μM) in cortical astrocytes activated ex vivo with TNFα + IL-1α + C1q. (h) Calcium event probability normalized to basal activity depicting the effect of WIN55,212–2 (WIN; 300 μM), ATP (200 μM) or glutamate (200 μM) in control astrocytes (8–11 slices, 5 mice) and following incubation with pro-inflammatory factors (5–10 slices, 4 mice). Data were analyzed by two-tailed paired Student’s t test (before and after). Error bars express SEM.
Fig. 6.
Fig. 6.
Exacerbated astrocytic glutamate release in the EAE cortex. (a) Representative traces depicting slow inward currents (SICs) (asterisks) in layer V pyramidal neurons within the somatosensory cortex from control and EAE mice. (b) Frequency of SICs in control (19 neurons, 4 mice), EAE (17 neurons, 6 mice), IP3R2-KO (7 neurons, 2 mice) and IP3R2-KO EAE (7 neurons, 2 mice) animals. Data were analyzed by one-way ANOVA followed by a Dunn’s test for multiple comparisons. Error bars express SEM. (c) Cumulative frequency of SICs in cortical neurons from wild-type and IP3R2-KO mice in control and EAE conditions.
Fig. 7.
Fig. 7.
EAE disrupts astrocyte-mediated cortical neuron network plasticity. (a) Double patch-recordings from layer V pyramidal neurons in the somatosensory cortex for the analysis of astrocyte-neuron communication. (b) Time-courses and representative EPSC traces show heteroneuronal depression (b, left panel) and potentiation (b, right panel) of synaptic transmission following homoneuronal depolarization (ND) in control and EAE mice. (c) Percentages of heteroneurons that showed depression, potentiation or no plasticity in wild-type (WT) mice (control, 42 pairs, 7 mice; EAE, 49 pairs, 9 mice; P < 0.0001) and CB1ff mice injected with AAV9-GFAP-Cre in the somatosensory cortex (aCB1-KO) (control, 13 pairs, 2 mice; EAE, 15 pairs, 2 mice; P = 0.9646). Data were analyzed by Chi-square test. (d) Relative changes in EPSC amplitude depict heteroneuronal depression and potentiation in control (14 and 10 pairs, 6–5 mice), AM251 (2 μM) (9 and 4 pairs, 5–4 mice), EAE (4 and 21 pairs, 3–8 mice), EAE+AM251 (3 and 12 pairs, 2–8 mice) conditions. Data were analyzed by two-tailed paired Student t test. (e) Time-course of EPSC amplitude in layer V pyramidal neurons depicts spike-timing dependent plasticity (STDP) induced in control and EAE mice by pairing a postsynaptically evoked action potential with an EPSP (Δt = −25 ms) 60 times in 10 min (gray area). (f) Relative changes in EPSC amplitude after the pairing period in control and immunized mice (8 and 10 neurons, 4–7 mice), in the presence of AM251 (4 and 5 neurons, 2–3 mice), in IP3R2-KO animals (4 and 4 neurons, 2–2 mice), and in aCB1-KO (5–7 neurons, 2–3 mice) or aCB1-WT (9 and 6 neurons, 3–3 mice) mice injected with AAV9-GFAP-Cre and AAV9-GFAP-mCherry, respectively. Data were analyzed by two-tailed paired Student’s t test or Wilcoxon test (before and after) and Mann-Whitney test (between groups). Error bars express SEM.

References

    1. Akerboom J, Carreras Calderón N, Tian L, Wabnig S, Prigge M, Tolö J, Gordus A, Orger MB, Severi KE, Macklin JJ, Patel R, Pulver SR, Wardill TJ, Fischer E, Schüler C, Chen TW, Sarkisyan KS, Marvin JS, Bargmann CI, Kim DS, Kügler S, Lagnado L, Hegemann P, Gottschalk A, Schreiter ER, Looger LL, 2013. Genetically encoded calcium indicators for multi-color neural activity imaging and combination with optogenetics. Front. Mol. Neurosci 6, 2. 10.3389/fnmol.2013.00002. - DOI - PMC - PubMed
    1. Araque A, Carmignoto G, Haydon PG, Oliet SH, Robitaille R, Volterra A, 2014. Gliotransmitters travel in time and space. Neuron 81 (4), 728–739. 10.1016/j.neuron.2014.02.007. - DOI - PMC - PubMed
    1. Baker D, Pryce G, Croxford JL, Brown P, Pertwee RG, Makriyannis A, Khanolkar A, Layward L, Fezza F, Bisogno T, Di Marzo V, 2001. Endocannabinoids control spasticity in a multiple sclerosis model. FASEB J. 15 (2), 300–302. 10.1096/fj.00-0399fje. - DOI - PubMed
    1. Baraibar AM, Belisle L, Marsicano G, Matute C, Mato S, Araque A, Kofuji P, 2023. Spatial organization of neuron-astrocyte interactions in the somatosensory cortex. Cereb. Cortex 33 (8), 4498–4511. 10.1093/cercor/bhac357. - DOI - PMC - PubMed
    1. Calabrese M, Rocca MA, Atzori M, Mattisi I, Favaretto A, Perini P, Gallo P, Filippi M, 2010. A 3-year magnetic resonance imaging study of cortical lesions in relapse-onset multiple sclerosis. Ann. Neurol 67 (3), 376–383. 10.1002/ana.21906. - DOI - PubMed