. 2024 Sep;65(9):100599.
doi: 10.1016/j.jlr.2024.100599. Epub 2024 Jul 18.

Spatial lipidomics reveals zone-specific hepatic lipid alteration and remodeling in metabolic dysfunction-associated steatohepatitis

Affiliations

Spatial lipidomics reveals zone-specific hepatic lipid alteration and remodeling in metabolic dysfunction-associated steatohepatitis

Patcharamon Seubnooch et al. J Lipid Res. 2024 Sep.

Abstract

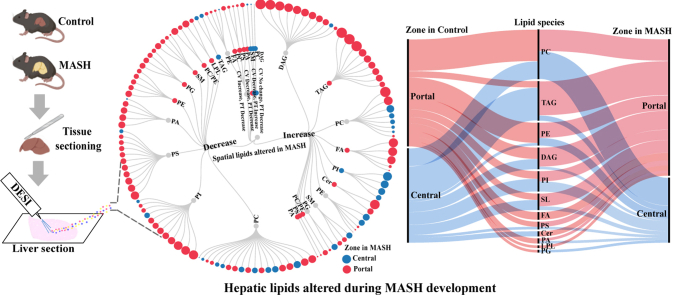
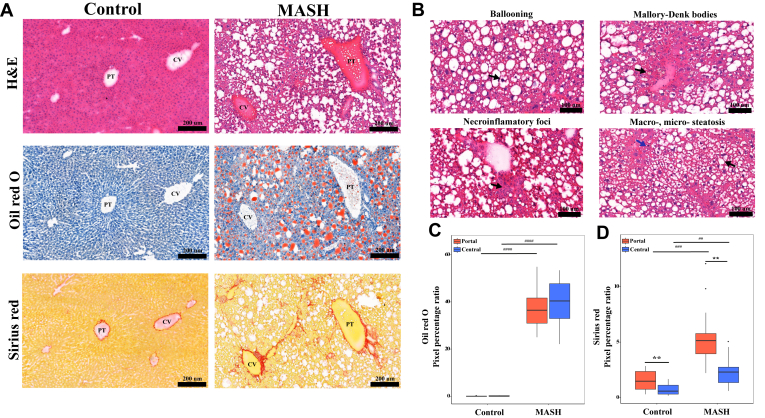
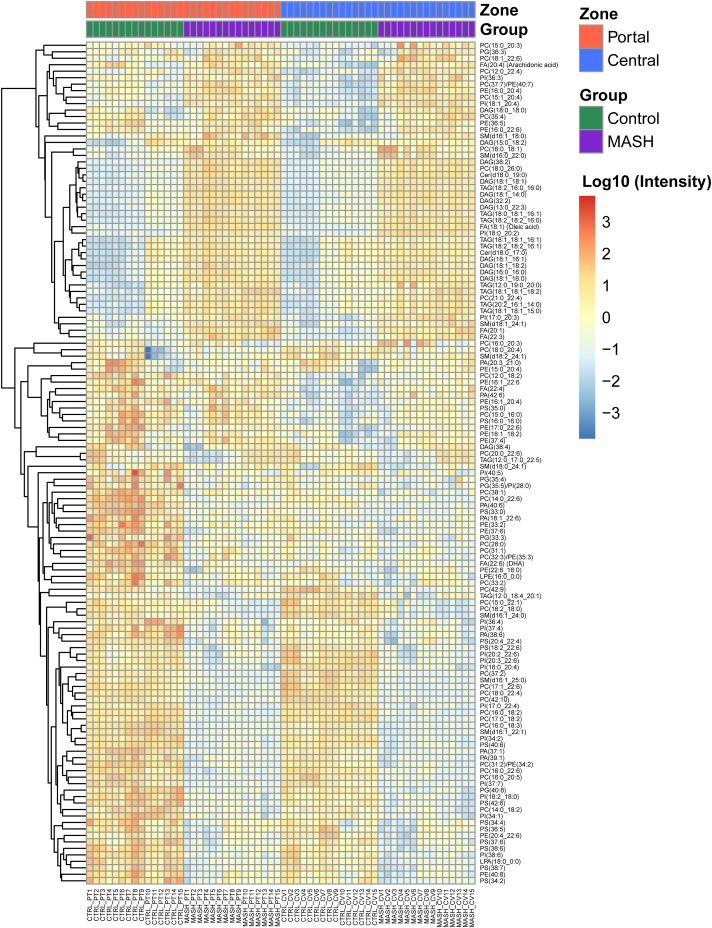
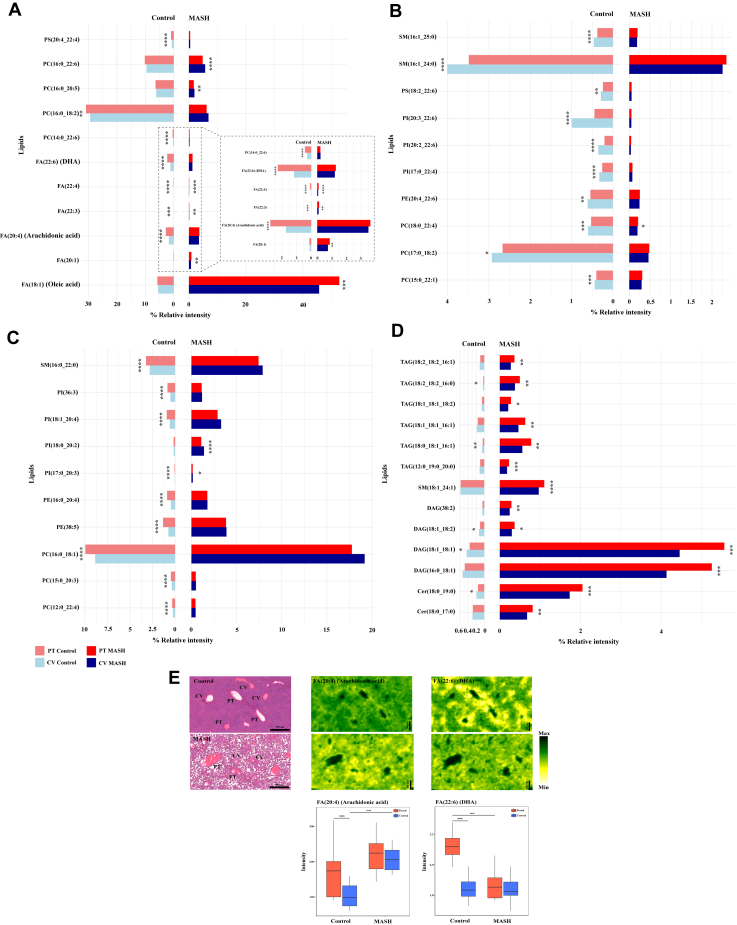
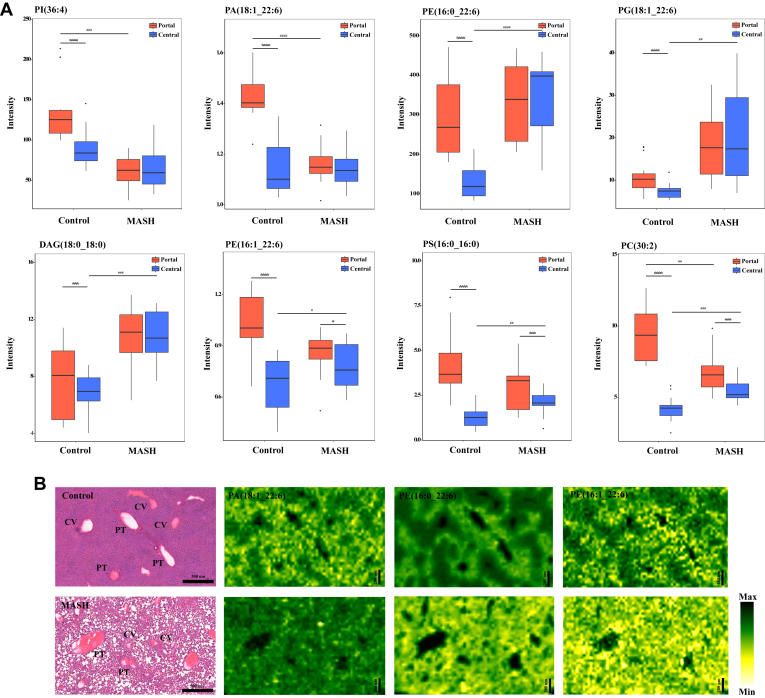
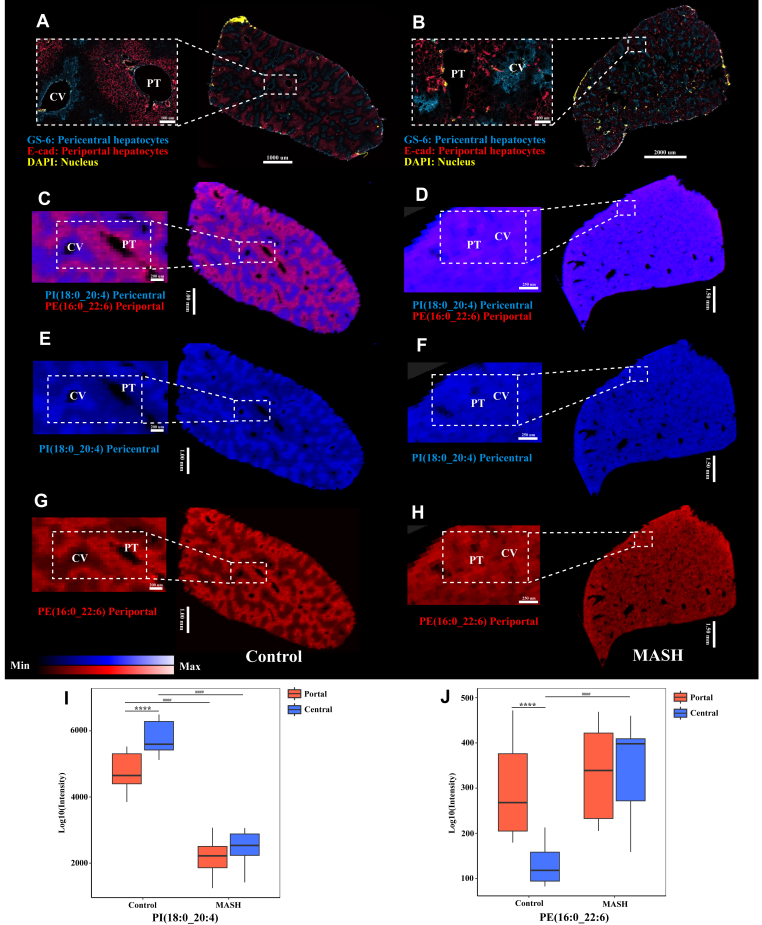
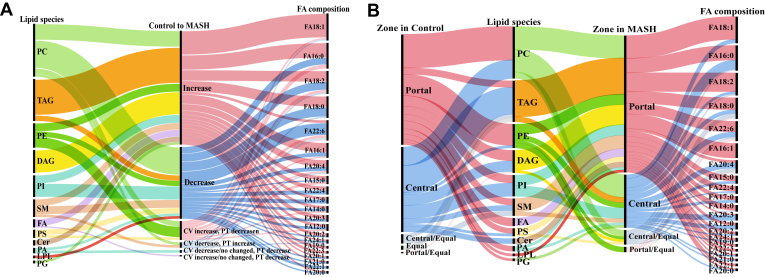
Alteration in lipid metabolism plays a pivotal role in developing metabolic dysfunction-associated steatohepatitis (MASH). However, our understanding of alteration in lipid metabolism across liver zonation in MASH remains limited. Within this study, we investigated MASH-associated zone-specific lipid metabolism in a diet and chemical-induced MASH mouse model. Spatial lipidomics using mass spectrometry imaging in a MASH mouse model revealed 130 lipids from various classes altered across liver zonation and exhibited zone-specific lipid signatures in MASH. Triacylglycerols, diacylglycerols, sphingolipids and ceramides showed distinct zone-specific changes and re-distribution from pericentral to periportal localization in MASH. Saturated and monounsaturated fatty acids (FA) were the primary FA composition of increased lipids in MASH, while polyunsaturated FAs were the major FA composition of decreased lipids. We observed elevated fibrosis in the periportal region, which could be the result of observed metabolic alteration across zonation. Our study provides valuable insights into zone-specific hepatic lipid metabolism and demonstrates the significance of spatial lipidomics in understanding liver lipid metabolism. Identifying unique lipid distribution patterns may offer valuable insights into the pathophysiology of MASH and facilitate the discovery of diagnostic markers associated with liver zonation.

Keywords: MASH; MASLD; NAFLD; NASH; hepatic lipid zonation; lipid distribution; liver lipid metabolism; liver zonation; steatotic liver disease.


Conflict of interest statement

Conflict of interest The authors declare that they have no conflicts of interest with the contents of this article.

Figures

None
Graphical abstract
Fig. 1
Fig. 1
Histological staining showed WD diet- and chemical-induced MASH. A: the H & E, Oil Red O, and Sirius red staining of the portal (PT) and central (CV) areas of the control and MASH livers (20X). B: the H&E staining showed MASH pathophysiology, including ballooning, Mallory-Denk bodies, inflammation and accumulation of macro- (black arrow) and micro-vascular fat (blue arrow) in the MASH liver. C: The quantification of the oil red o staining in pixel percentage ratio. D: The quantification of the Sirius red staining in pixel percentage ratio. ##P-value < 0.01, ###P-value < 0.001 and ####P-value < 0.0001 the MASH compared with the control, ∗∗ P-value < 0.01 the pericentral areas of each group compared with the periportal areas.
Fig. 2
Fig. 2
Heatmap illustrating significant alterations of hepatic lipids across periportal (PT) and pericentral (CV) zones in control and MASH samples.
Fig. 3
Fig. 3
Zone-specific localisation of the significant hepatic lipids altered in control and MASH. A–D: Two-sided bar plots illustrate lipid alterations across two zones (periportal, PT, and pericentral, CV) in control and MASH samples. A and B: Zone-specific localization of the decreasing lipids in the MASH stage. C and D: Zone-specific localization of the increasing lipids in the MASH stage. E: Ion images and box plots displayed the spatial distribution of FA20:4 and FA 22:6 in the periportal (PT) and pericentral (CV) of control and MASH samples. ∗P-value < 0.05, ∗∗P-value < 0.01, ∗∗∗P-value < 0.001 and ∗∗∗∗P-value < 0.0001 the pericentral areas of each group compared with the periportal areas, ####P-value < 0.0001 the MASH compared with the control (box plot (E)).
Fig. 4
Fig. 4
Zone-specific perturbations of hepatic lipids alteration in control and MASH. A: Box plots illustrating the zone-specific alteration of lipids across the liver zonation in control and MASH livers, including PI(36:4), PA(18:1_22:6), PE(16:0_22:6), PG(18:1_22:6), DAG(18:0_18:0), PE(16:1_22:6), PS(16:0_16:0) and PC(30:2). B: Ion images displaying the spatial distribution of PA(18:1_22:6), PE(16:0_22:6), and PC(30:2) in control and MASH samples. In this figure, the H&E staining images of the control and MASH groups are derived from the same H&E staining of the same samples as Fig. 3E. These images are reused across figures due to their representation of consistent staining results for comparative analysis. #P-value < 0.05, ##P-value < 0.01, ###P-value < 0.001 and ####P-value < 0.0001 the MASH compared with the control, ∗P-value < 0.05, ∗∗∗P-value < 0.001 and ∗∗∗∗P-value < 0.0001 the pericentral areas of each group compared with the periportal areas.
Fig. 5
Fig. 5
The zonation patterns observed in control and MASH livers by double-immunofluorescence staining and molecular imaging with DESI. Double-immunofluorescence staining shows the proto-central axis and the liver zonation of control (A) and MASH (B) livers. GS-6, pericentral hepatocytes (blue); E-Cad, periportal hepatocytes (red); and DAPI (yellow). Red and blue overlay ion images from DESI-MSI: PI(18:0_20:4) located in the pericentral area (blue) and PE(16:0_22:6) predominantly presented in the periportal region (red) of control (C) and MASH (D) livers. Ion images displayed spatial distribution obtained from control and MASH mice show the predominantly localisation of PI(18:0_20:4) in the pericentral (E, control) and (F, MASH) and PE(16:0_22:6) in the periportal (G, control) and (H, MASH). CV, central vein; PT, Portal tried; GS-6, glutamine synthetase; E-Cad, E-cadherin. Box plots visualising the zone-specific alteration of PI(18:0_20:4) (I) and PE(16:0_22:6) (J) across the liver zonation in control and MASH livers. The box plot data for PE(16:0_22:6) presented in the Figure are the same as those in Fig. 4A. This reuse is intended to highlight the lipid's specific localisation and changes in the MASH group's pericentral areas. ####P-value < 0.0001 the MASH compared with the control, ∗∗∗∗P-value < 0.0001 the pericentral areas of each group compared with the periportal areas.
Fig. 6
Fig. 6
Alluvial diagram depicting FA chain composition in the significant hepatic lipids altered and exhibited spatial changes predominantly during MASH. A: The FA compositions of hepatic lipids with altered levels (increased and decreased) in the MASH group compared to the control. B: The FA compositions of hepatic lipids exhibited significant spatial changes predominantly within specific zones in the MASH group compared to the control.

References

    1. Younossi Z.M., Golabi P., de Avila L., Paik J.M., Srishord M., Fukui N., et al. The global epidemiology of NAFLD and NASH in patients with type 2 diabetes: a systematic review and meta-analysis. J. Hepatol. 2019;71:793–801. - PubMed
    1. Kucukoglu O., Sowa J.P., Mazzolini G.D., Syn W.K., Canbay A. Hepatokines and adipokines in NASH-related hepatocellular carcinoma. J. Hepatol. 2021;74:442–457. - PubMed
    1. Kleiner D.E., Brunt E.M., Van Natta M., Behling C., Contos M.J., Cummings O.W., et al. Design and validation of a histological scoring system for nonalcoholic fatty liver disease. Hepatology. 2005;41:1313–1321. - PubMed
    1. Choi S.S., Diehl A.M. Hepatic triglyceride synthesis and nonalcoholic fatty liver disease. Curr. Opin. Lipidol. 2008;19:295–300. - PubMed
    1. Cohen J.C., Horton J.D., Hobbs H.H. Human fatty liver disease: old questions and new insights. Science. 2011;332:1519–1523. - PMC - PubMed