Randomized Controlled Trial
. 2024 Sep 9;73(10):1737-1748.
doi: 10.1136/gutjnl-2024-332290.

HBcrAg values may predict virological and immunological responses to pegIFN-α in NUC-suppressed HBeAg-negative chronic hepatitis B

Affiliations
Randomized Controlled Trial

HBcrAg values may predict virological and immunological responses to pegIFN-α in NUC-suppressed HBeAg-negative chronic hepatitis B

Andrea Vecchi et al. Gut. .

Abstract

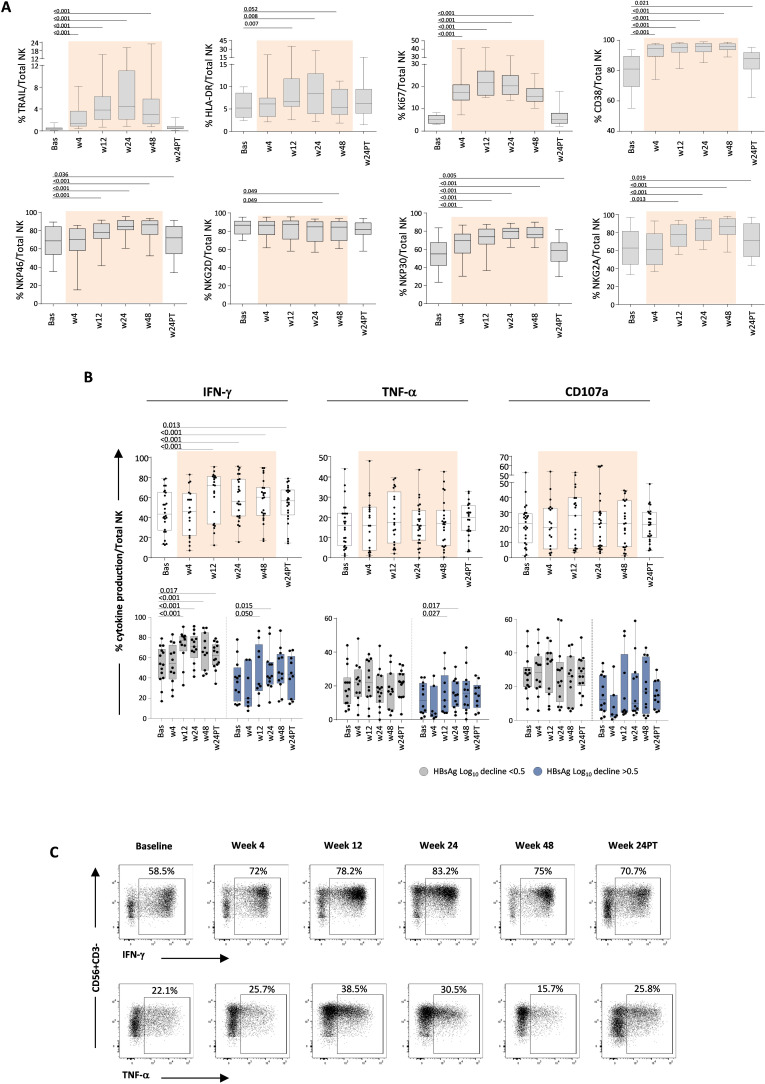
Objective: Selected populations of patients with chronic hepatitis B (CHB) may benefit from a combined use of pegylated interferon-alpha (pegIFN-α) and nucleos(t)ides (NUCs). The aim of our study was to assess the immunomodulatory effect of pegIFN-α on T and natural killer (NK) cell responses in NUC-suppressed patients to identify cellular and/or serological parameters to predict better T cell-restoring effect and better control of infection in response to pegIFN-α for a tailored application of IFN-α add-on.

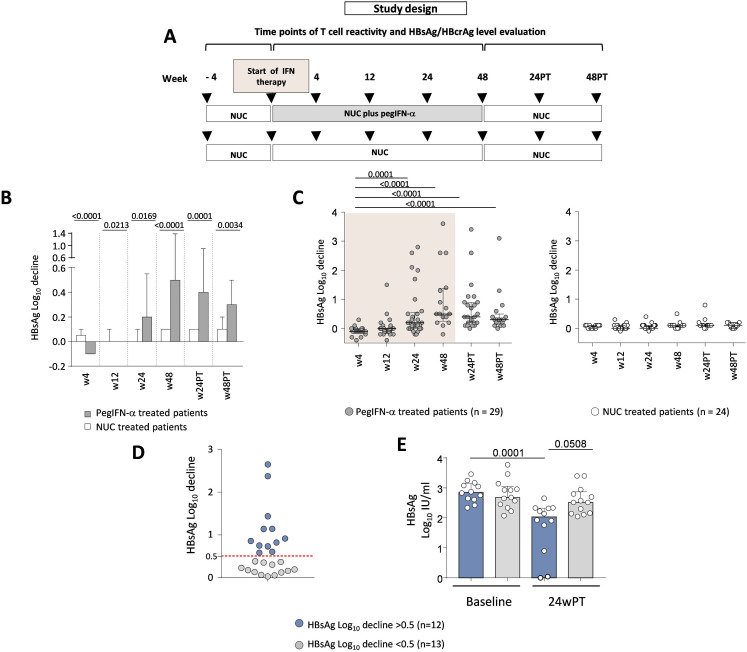
Design: 53 HBeAg-negative NUC-treated patients with CHB were randomised at a 1:1 ratio to receive pegIFN-α-2a for 48 weeks, or to continue NUC therapy and then followed up for at least 6 months maintaining NUCs. Serum hepatitis B surface antigen (HBsAg) and hepatitis B core-related antigen (HBcrAg) levels as well as peripheral blood NK cell phenotype and function and HBV-specific T cell responses upon in vitro stimulation with overlapping HBV peptides were measured longitudinally before, during and after pegIFN-α therapy.

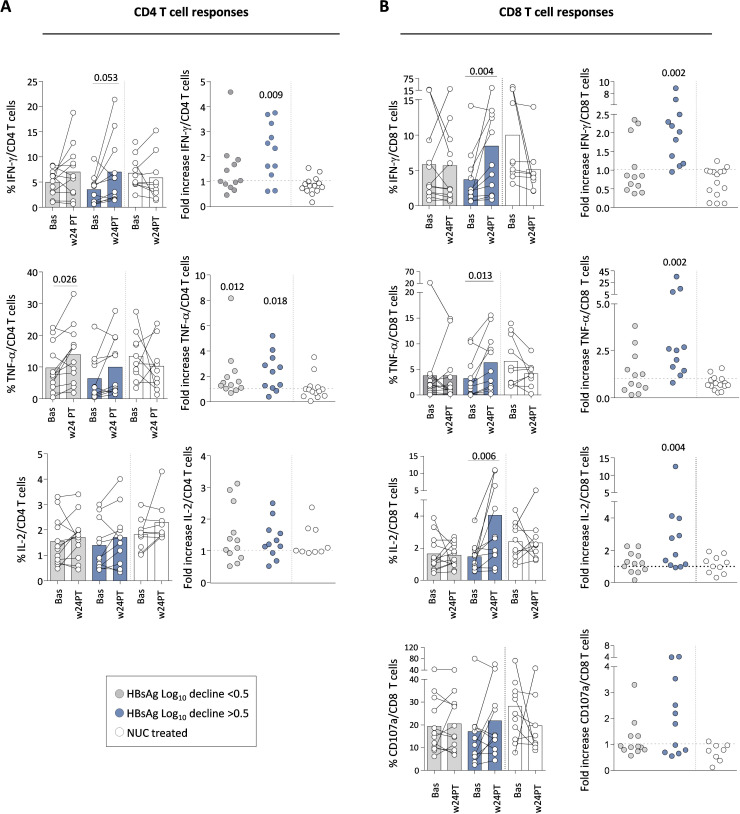
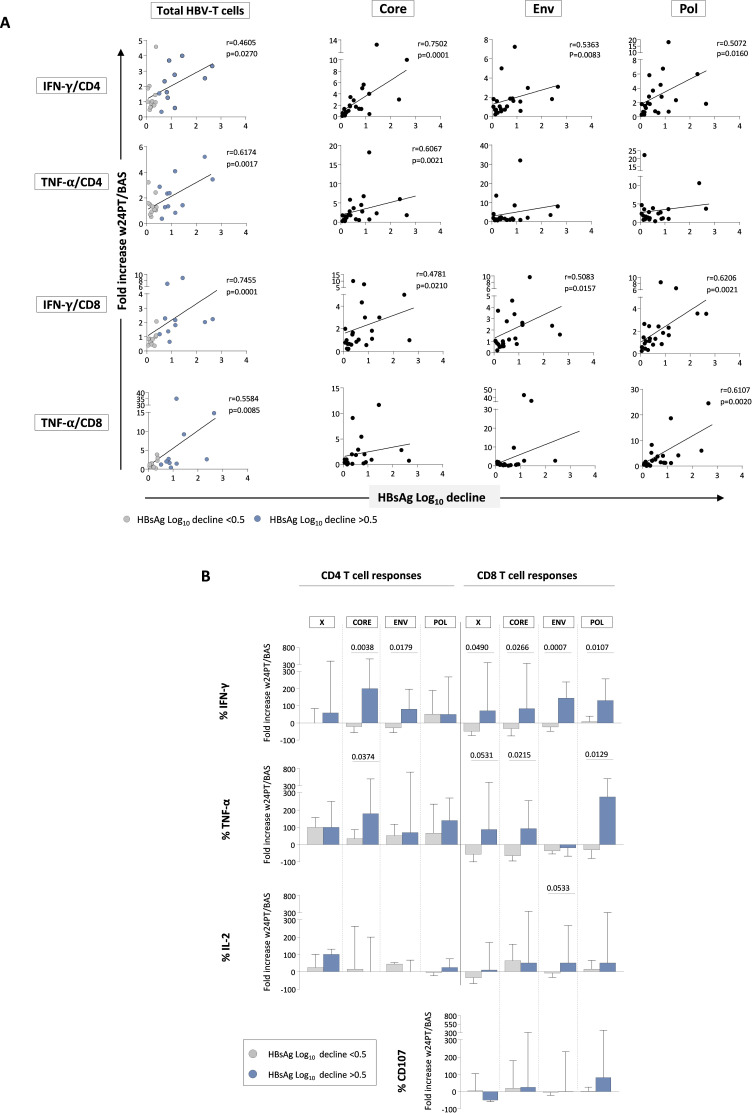
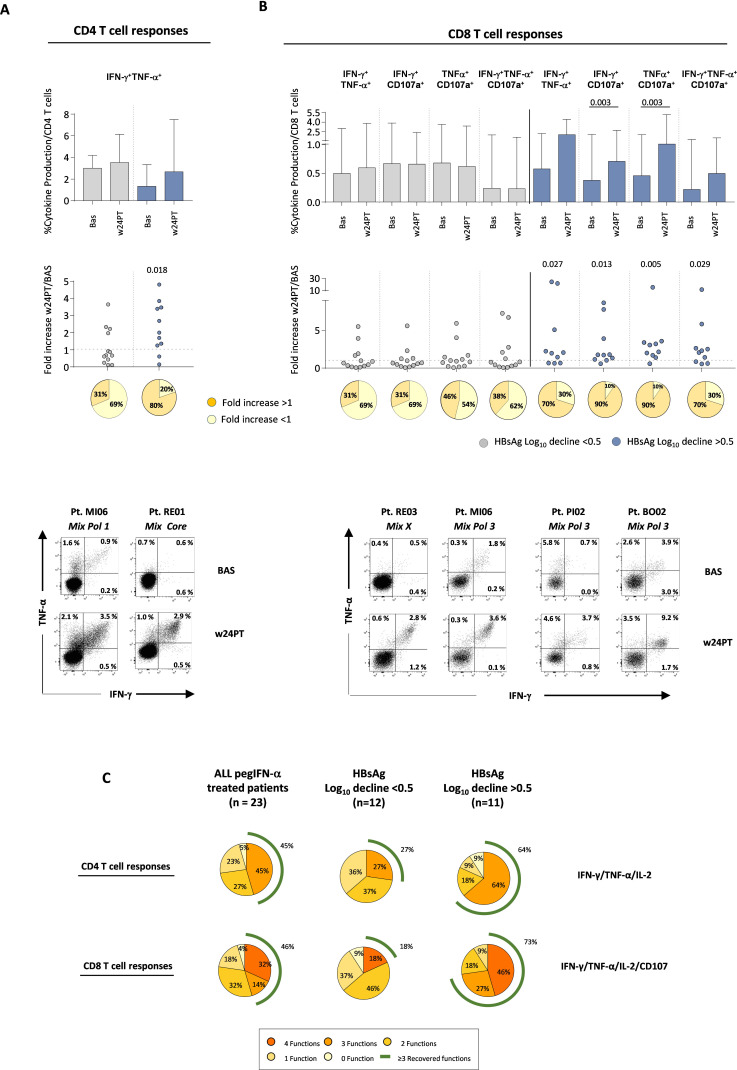
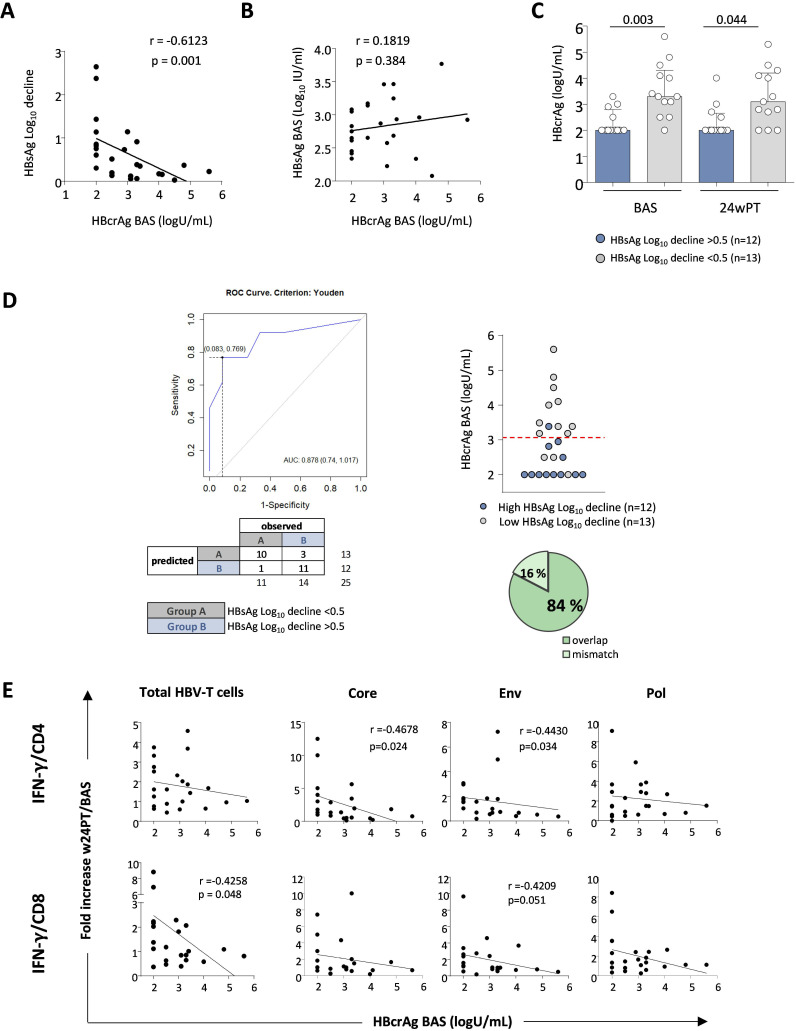
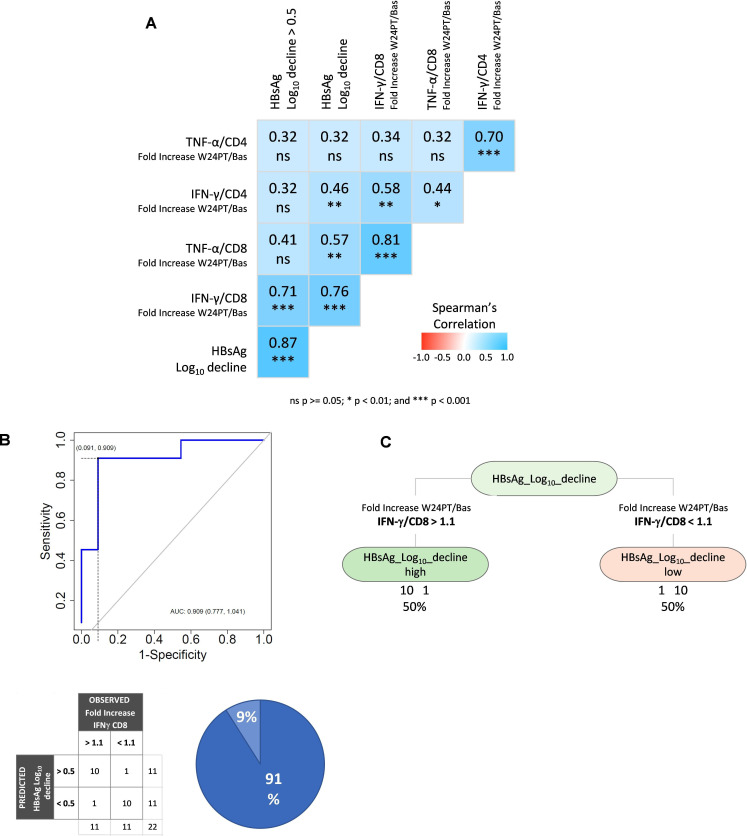
Results: Two cohorts of pegIFN-α treated patients were identified according to HBsAg decline greater or less than 0.5 log at week 24 post-treatment. PegIFN-α add-on did not significantly improve HBV-specific T cell responses during therapy but elicited a significant multispecific and polyfunctional T cell improvement at week 24 post-pegIFN-α treatment compared with baseline. This improvement was maximal in patients who had a higher drop in serum HBsAg levels and a lower basal HBcrAg values.

Conclusions: PegIFN-α treatment can induce greater functional T cell improvement and HBsAg decline in patients with lower baseline HBcrAg levels. Thus, HBcrAg may represent an easily and reliably applicable parameter to select patients who are more likely to achieve better response to pegIFN-α add-on to virally suppressed patients.

Keywords: Chronic HBV infection; HBcrAg; HBsAg; T cell functional reconstitution; immune modulatory treatments; pegylated IFN-a.


Conflict of interest statement

Competing interests: CF: Grant: Gilead, Abbvie. Consultant: Gilead, Abbvie, Vir Biotechnology Inc, Arrowhead, Transgene, BMS; MRB: speaker Bureau for AbbVie, Gilead, EISAI-MSD and advisor for AbbVie, Gilead, Janssen, AstraZeneca; PL: advisor and speaker bureau for Advisory Board/Speaker Bureau for Roche Pharma/diagnostics, Gilead Sciences, GSK, Abbvie, Janssen, Myr, Eiger, Antios, Aligos, Vir, Grifols, Altona, Roboscreen; SPF is employee of and stock-holder in Gilead Sciences, Inc. The remaining authors disclose no conflicts.

Figures

Figure 1
Figure 1. Study design and impact of pegIFN-α therapy on serum HBsAg values. (A) Representation of the study design. (B) Mean changes in log10 IU/mL serum HBsAg from baseline through different time points in experimental and control study arms. Bars represent mean and SE values. Statistics by the Mann-Whitney test. (C) HBsAg logarithmic decline at the indicated weeks relative to baseline values in each NUC/pegIFN-α (left) and NUC-only (right) treated patient (n=29 and n=24, respectively). Statistics by the Kruskal-Wallis with Dunn’s correction test. (D) HBsAg log reductions greater (blue dots) or lower (grey dots) than 0.5 obtained comparing baseline with w24PT in each patient; each dot indicates an individual patient (n=25). (E) Median HBsAg values at baseline and w24PT in the two groups of pegIFN-α-treated patients with HBsAg decline >0.5 or <0.5 log10 IU/mL. Each dot indicates an individual patient; statistics by the Kruskal-Wallis with Dunn’s correction test. HBcrAg, hepatitis B core‐related antigen; HBsAg, hepatitis B surface antigen; IFN, interferon; log10, logarithm base 10; NUC, nucleos(t)ide; pegIFN-α, pegylated IFN-alpha; PT, post-treatment; w, week.
Figure 2
Figure 2. Effect of pegIFN-α therapy on HBV-specific CD4 and CD8 T cell responses. Cytokine production and the ability to degranulate by CD4 and CD8 HBV-specific T cells were analysed after 10 days in vitro stimulation with HBV peptide pools in the different patient categories. (A) Percentage of IFN-γ (top), TNF-α (middle) and IL-2 cytokine production (bottom) by HBV-specific CD4 T cells at the indicated time points. Each couple of dots joined by a line indicates an individual patient, while the columns indicate mean (+SE) cytokine production at the indicated time point in each patient group. The bullet charts on the right show the ratio (fold increase) between the cytokine production detected in each patient at week 24PT relative to baseline. (B) Effect of pegIFN-α and NUC therapy on HBV-specific CD8 T cells, illustrated as in (A); in the bottom, CD107 degranulation capacity. Statistics by the Wilcoxon matched-paired test and by the Wilcoxon signed-rank test. Bas, baseline; HBsAg, hepatitis B surface antigen; IFN-γ, interferon-gamma; IL, interleukin; log10, logarithm base 10; NUC, nucleos(t)ide; pegIFN-α, pegylated IFN-alpha; PT, post-treatment; SE, standard error; TNF-α, tumour necrosis factor-alpha; w, week.
Figure 3
Figure 3. Improvement of HBV-specific T cell functions induced by pegIFN-α therapy is multispecific and correlates with antigen decline. (A) Correlation between HBsAg logarithmic decline (baseline vs week 24PT) and intensity of T cell responses against the whole HBV proteome (left charts) or against individual HBV antigens (HBcore, HBenv and HBpol; right charts) expressed as ratio between cytokine production by HBV-specific CD4 and CD8 T cells at w24PT and at baseline in each patient following pegIFN-α add-on. Statistics by the Spearman’s correlation test. (B) Bars represent the fold increase detected for each individual antigen at w24PT of the median cytokine production and degranulation capacity relative to baseline (patients with HBsAg log reductions <0.5 or >0.5 in grey and blue, respectively). Statistics by the Mann-Whitney U test. BAS, baseline; Env, envelope; HBsAg, hepatitis B surface antigen; IFN-γ, interferon-gamma; IL, interleukin; log10, logarithm base 10; pegIFN-α, pegylated IFN-alpha; Pol, polymerase; PT, post-treatment; TNF-α, tumour necrosis factor-alpha; w, week.
Figure 4
Figure 4. Polyfunctional HBV-specific T cell responses. (A) Columns show the median frequency at baseline and w24PT of HBV-specific CD4 T cells able to produce simultaneously the indicated cytokines in response to all peptide pools after in vitro stimulation (with interquartile interval) from patients receiving pegIFN-α with HBsAg log reductions lower or greater than 0.5 (grey and blue, respectively). The dotted chart shows the ratio between the cytokine production detected at w24PT relative to baseline for each patient belonging to the two different groups. Statistics by the Wilcoxon matched-paired test and by the Wilcoxon signed-rank test. Pie charts below show the percentage of patients able to improve cytokine production with a fold increase value higher than 1 (orange pies). (B) CD8 T cells able to produce simultaneously the indicated cytokines and to degranulate are illustrated as in (A). Representative dot plots of CD4 and CD8 T cell responses from treated patients are shown at the bottom of the panel. (C) Pie charts show the percentage of patients able to improve either none or multiple CD4 and CD8 HBV-specific T cell functions simultaneously. Left, middle and right pie charts refer to the whole patient population receiving pegIFN-α, and to patient subgroups with HBsAg log decline <0.5 or >0.5, respectively. BAS, baseline; HBsAg, hepatitis B surface antigen; IFN-γ, interferon-gamma; IL, interleukin; log10, logarithm base 10; pegIFN-α, pegylated IFN-alpha; PT, post-treatment; TNF-α, tumour necrosis factor-alpha; w, week.
Figure 5
Figure 5. Predictive value of baseline HBcrAg levels on HBsAg decline and HBV-specific T cell responses. (A) Correlation between baseline HBcrAg levels and HBsAg log decline. (B) Correlation between baseline HBcrAg levels and baseline HBsAg values. (C) The columns indicate the median HBcrAg value at baseline and w24PT, while each dot shows individual patient HBcrAg values. (D) ROC analysis on segregated data derived from HBsAg log reduction values. Dotplot, confusion matrix and prediction accuracy are illustrated. (E) Correlation analyses between baseline HBcrAg values and quantity of IFN-γ-producing T cells specific for the whole HBV proteome (left charts) or specific for HBcore, HBenv and HBpol antigens (right charts) expressed as ratio between cytokine production by HBV-specific CD4 and CD8 T cells at w24PT and baseline for each patient following pegIFN-α add-on. Statistics by Spearman’s correlation test and Mann-Whitney test. As explained in the Methods section, HBcrAg values below 2.5 are indicated as 2 in all panels. AUC, area under the curve; BAS, baseline; Env, envelope; HBcrAg, hepatitis B core‐related antigen; HBsAg, hepatitis B surface antigen; IFN-γ, interferon-gamma; log10, logarithm base 10; pegIFN-α, pegylated IFN-alpha; Pol, polymerase; PT, post-treatment; ROC, receiver operating characteristic; w, week.
Figure 6
Figure 6. IFN-γ production by CD8 T cells is the most relevant immune parameter associated with HBsAg decline. Multivariate analyses, including binary logistic regression and decision tree algorithms, were performed to identify the immune parameters associated with different HBsAg kinetics in pegIFN-α-treated patients. (A) Spearman’s correlation matrix of the main immunological variables (TNF-α/CD4, IFN-γ/CD4, TNF-α/CD8, IFN-γ/CD8, as fold increase between weeks 24PT and baseline) and HBsAg log decline; (B) logistic regression and ROC analysis; (C) decision tree analysis on fold increase of IFN-γ production by HBV-specific CD8 T cells segregated according to the HBsAg log reduction values. AUC, area under the curve; Bas, baseline; HBsAg, hepatitis B surface antigen; IFN-γ, interferon-gamma; log10, logarithm base 10; ns, not significant; pegIFN-α, pegylated IFN-alpha; PT, post-treatment; ROC, receiver operating characteristic; TNF-α, tumour necrosis factor-alpha; w, week.
Figure 7
Figure 7. Effect of pegIFN-α therapy on NK cell phenotype and function. (A) Expression of TRAIL, HLA-DR, Ki67, CD38, NKp46, NKG2D, NKp30 and NKG2A on NK cells before, during and after pegIFN-α treatment (n=22). Results are expressed as median percentage of each NK cell phenotypical marker on total NK cells. (B) Analysis of NK cell IFN-γ, TNF-α production and CD107a degranulation capacity before, during and after pegIFN-α treatment (n=26, top panels) in the whole patient population and according to the different patient subgroups with different HBsAg log reductions (bottom panels); each whisker plot indicates the median values of NK cell functional parameters in the indicated time points. Statistics by the Kruskal-Wallis with Dunn’s correction test. (C) Representative plots of IFN-γ and TNF-α production by NK cells from a treated patient. Bas, baseline; HBsAg, hepatitis B surface antigen; IFN-γ, interferon-gamma; log10, logarithm base 10; NK, natural killer; pegIFN-α, pegylated IFN-alpha; PT, post-treatment; TNF-α, tumour necrosis factor-alpha; w, week.

Similar articles

Cited by

References

    1. Lim SG, Baumert TF, Boni C, et al. The scientific basis of combination therapy for chronic hepatitis B functional cure. Nat Rev Gastroenterol Hepatol. 2023;20:238–53. doi: 10.1038/s41575-022-00724-5. - DOI - PubMed
    1. Ghany MG, Buti M, Lampertico P, et al. Guidance on treatment endpoints and study design for clinical trials aiming to achieve cure in chronic hepatitis B and D: report from the 2022 AASLD-EASL HBV-HDV treatment endpoints conference. Hepatology. 2023;78:1654–73. doi: 10.1097/HEP.0000000000000431. - DOI - PubMed
    1. Fisicaro P, Barili V, Rossi M, et al. Pathogenetic mechanisms of T cell dysfunction in chronic HBV infection and related therapeutic approaches. Front Immunol. 2020;11:849. doi: 10.3389/fimmu.2020.00849. - DOI - PMC - PubMed
    1. Le Bert N, Gill US, Hong M, et al. Effects of hepatitis B surface antigen on virus-specific and global T cells in patients with chronic hepatitis B virus infection. Gastroenterology. 2020;159:652–64. doi: 10.1053/j.gastro.2020.04.019. - DOI - PubMed
    1. Aliabadi E, Urbanek-Quaing M, Maasoumy B, et al. Impact of HBsAg and HBcrAg levels on phenotype and function of HBV-specific T cells in patients with chronic hepatitis B virus infection. Gut. 2022;71:2300–12. doi: 10.1136/gutjnl-2021-324646. - DOI - PMC - PubMed

Publication types

MeSH terms