. 2024 Nov 14;79(12):1124-1135.
doi: 10.1136/thorax-2023-221168.

CD206+ macrophages are relevant non-invasive imaging biomarkers and therapeutic targets in experimental lung fibrosis

Affiliations

CD206+ macrophages are relevant non-invasive imaging biomarkers and therapeutic targets in experimental lung fibrosis

Lenny Pommerolle et al. Thorax. .

Abstract

Background: Interstitial lung diseases (ILDs) include a large number of diseases associated with progressive pulmonary fibrosis (PPF), including idiopathic pulmonary fibrosis (IPF). Despite the rarity of each of the fibrotic ILDs individually, they cumulatively affect a considerable number of patients. PPF is characterised by an excessive collagen deposition leading to functional decline.

Objectives: Therapeutic options are limited to nintedanib and pirfenidone which are only able to reduce fibrosis progression. CD206-expressing M2 macrophages are involved in fibrosis progression, and whether they may be relevant therapeutic targets or biomarkers remains an open question.

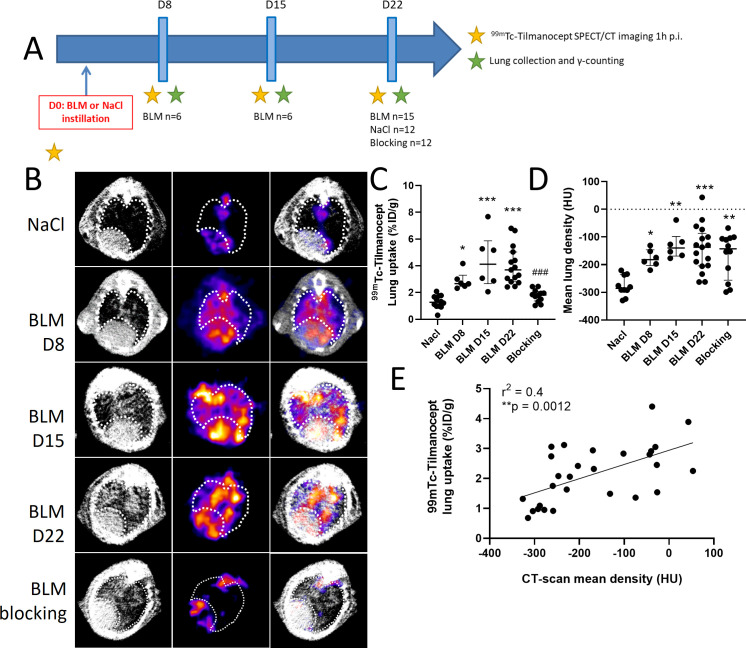
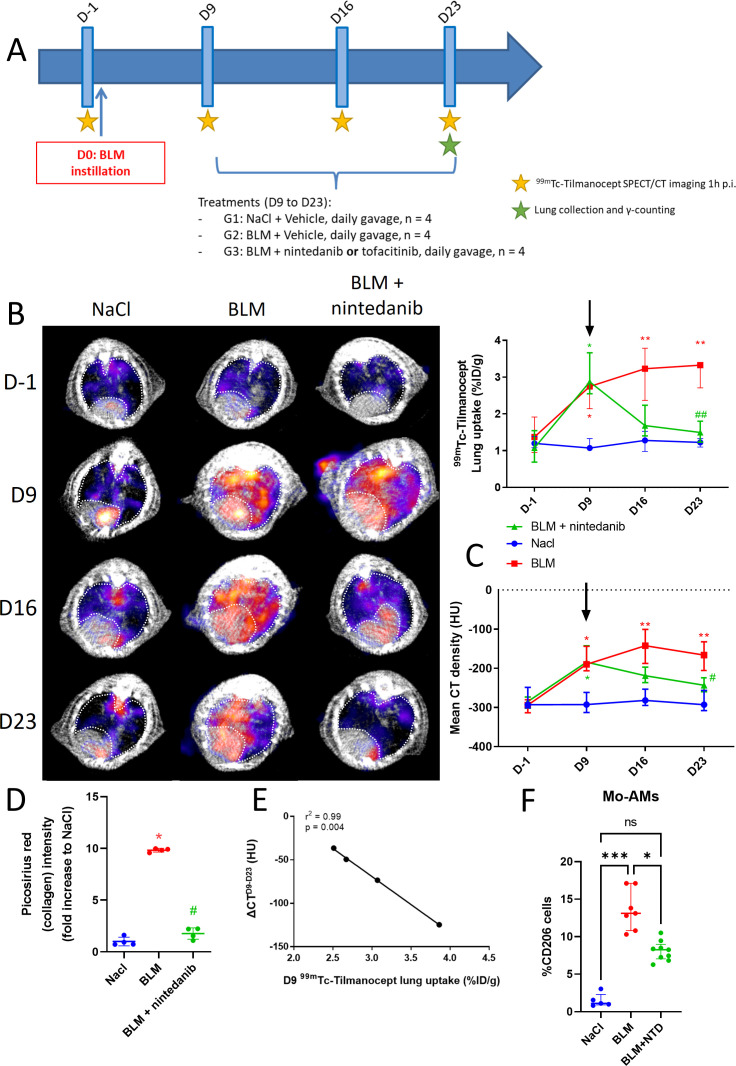
Results: In our study, CD206+ lung macrophages were monitored in bleomycin-induced lung fibrosis in mice by combining flow cytometry, scRNAseq and in vivo molecular imaging using a single photon emission computed tomography (SPECT) radiopharmaceutical, 99mTc-tilmanocept. The antifibrotic effect of the inhibition of M2 macrophage polarisation with a JAK inhibitor, tofacitinib, was assessed in vivo. We demonstrate that CD206-targeted in vivo SPECT imaging with 99mTc-tilmanocept was able to accurately detect and quantify the increase in CD206+ macrophages from early to advanced stages of experimental fibrosis and ex vivo in lung biopsies from patients with IPF. CD206-targeted imaging also specifically detected a decrease in CD206+ lung macrophages on nintedanib and tofacitinib treatment. Importantly, early in vivo imaging of CD206+ macrophages allowed the prediction of experimental lung fibrosis progression as well as nintedanib and tofacitinib efficacy.

Conclusions: These findings indicate that M2 macrophages may be relevant theranostic targets for personalised medicine for patients with PPF.

Keywords: Idiopathic pulmonary fibrosis; Imaging/CT MRI etc; Interstitial Fibrosis; Macrophage Biology.


Conflict of interest statement

Competing interests: None declared.

Figures

Figure 1
Figure 1. CD206 is a relevant target in lung fibrosis. (A) Representative immunohistochemistry (IHC) staining of CD206 (red) and CD68 (green) on lung sections from mice receiving NaCl or bleomycin (BLM, D21). Scale bar=200 µm. (B) 99mTc-tilmanocept autoradiography images and Picosirius red images on lung sections from mice receiving NaCl or BLM (D21). (C) CD206 expression were quantified using median fluorescence intensity (MFI) or expressed in percentage of cells expressing CD206 in TR-AMs and Mo-AMs cells. Results are presented as median±IQR, NaCl n=4, BLM D8 n=5, BLM D15 n=5, BLM D22 n=5. Star (*) is a representative of comparison of Mo-AMs with TR-AMs analysed by t-test Mann-Whitney. Dollar ($) is a representative of statistical comparison of each TR-AMs group with TR-AMs NaCl, hash (#) is a representative of statistical comparison of each Mo-AMs group with Mo-AMs NaCl. The difference between groups was compared using Kruskal-Wallis non-parametric analysis of variance (ANOVA), *($/#)p<0.05, **($$)p<0.01, ***($$$/###)p<0.001. (D) Frequency of each macrophage subpopulation relative to all other macrophages by scRNAseq, calculated for individual mice treated with phosphate-buffered saline (PBS, n=18) or BLM (n=6 for each time point). (E) CD206 gene (Mrc1) expression relative to the proportion of AM1, AM2 and AM3 cells at the basal level (PBS) or after 14 or 28 days post-BLM.
Figure 2
Figure 2. CD206 is a relevant target in human idiopathic pulmonary fibrosis (IPF). (A) Representative immunohistochemistry (IHC) staining and quantification of collagen (green), CD206 (red) and CD68 (yellow) on human lung biopsies from control and patients with IPF (scale bar=200 µm). White boxes in the top row are negative controls. Results are presented as median±IQR, n=8 for both groups. The difference between groups was compared using Mann-Whitney non-parametric t-test, **p<0.01, ***p<0.001. (B) Autoradiography images and quantification of 99mTc-tilmanocept on human lung biopsies from controls and patients with IPF. Results are presented as median±IQR, n=8 for both groups. Star (*) is a representative of comparison of each group with the NaCl group and hash (#) is a representative of statistical comparison of blocking group with the IPF group. The difference between groups was compared using Kruskal-Wallis non-parametric analysis of variance (ANOVA). ##p<0.01, ***p<0.001. (C) Analysis of Mrc1 gene expression of publicly available microarray data (accession number GSE110147) from lung samples from 22 patients with IPF undergoing lung transplantation and 11 normal lung tissues flanking lung cancer resections. Results are presented as median±IQR. The difference between groups was compared using Mann-Whitney non-parametric t-test. ***p<0.001. (D) Analysis of Mrc1 gene expression of publicly available microarray data (accession number GSE68239). Lung tissues were collected from patients with IPF undergoing lung transplantation. Non-transplanted donor lung tissue showing no evidence of interstitial lung disease served as healthy controls. From each of patients with IPF, samples were collected once from ‘healthy looking’ (non-fibrotic) regions and from fibrotic loci. Results are presented as median±IQR, n=5 for controls and n=5 for non-fibrotic and fibrotic IPF tissue. The difference between groups was compared using Kruskal-Wallis non-parametric ANOVA. *p<0.05. (E) Analysis of Mrc1 gene expression of publicly available microarray data (accession number GSE132607) from PBMC from patients with IPF who underwent pulmonary function tests over at least two time points. Patients experiencing a decrease in forced vital capacity (FVC) of 10% or greater or a decrease in diffusing capacity for carbon monoxide (DLCO) of 15% or greater over 12 months were considered as progressors. Results are presented as mean±SEM, n=32 for non-progressors and n=29 for progressors, *p<0.01, unpaired t-test.
Figure 3
Figure 3. 99mTc-tilmanocept is able to detect advanced bleomycin (BLM)-induced lung fibrosis. (A) Schematic representation of the design of the study of 99mTc-tilmanocept imaging in NaCl- and BLM-receiving mice at several stage of experimental fibrosis. (B) Representative lung single photon emission computed tomography/CT (SPECT/CT) images with 99mTc-tilmanocept of NaCl- and BLM-receiving mice at D8, D15 and D22 (the lung region is represented by the dotted circle). (C) Graph represents the 99mTc-tilmanocept lung uptake in %ID/g of NaCl- and BLM-receiving mice at D8, D15 and D22. Results are presented as median±IQR, NaCl n=12, BLM D8 n=6, BLM D15 n=6, BLM D22 n=15. Star (*) is a representative of comparison of each group with the NaCl group and hash (#) is a representative of statistical comparison of blocking group with the BLM D22 group. The difference between groups was compared using Kruskal-Wallis non-parametric analysis of variance (ANOVA), *p<0.05, ***(###)p<0.001. (D) Graph represents the mean lung density quantified on CT images of NaCl- and BLM-receiving mice at D8, D15 and D22. Results are presented as median±IQR, NaCl n=12, BLM D8 n=6, BLM D15 n=6, BLM D22 n=15. The difference between groups was compared using Kruskal-Wallis non-parametric ANOVA. *p<0.05, **p<0.01, ***p<0.001. (E) Correlation between mean lung densities (HU) measured on CT images and 99mTc-tilmanocept lung uptake (%ID/g) of the corresponding lungs measured on SPECT/CT.
Figure 4
Figure 4. In vivo imaging of CD206 is a useful tool to monitor nintedanib efficacy. (A) Schematic representation of the design of the longitudinal study of 99mTc-tilmanocept imaging with nintedanib or tofacitinib treatments. (B) Representative 99mTc-tilmanocept single photon emission computed tomography/CT (SPECT/CT) images of NaCl- and bleomycin (BLM)-receiving mice treated or not with nintedanib at D-1, D9, D16 and D23 (the lung region is represented by the dotted circle). Graph represents evolution of 99mTc-tilmanocept lung uptake (%ID/g) at all time points. Results are presented as median±IQR, n=4 for all groups. Star (*) is a representative of statistical comparison between time points for each groups and hash (#) is a representative of statistical comparison between the groups at each time points. The difference between groups was compared using Kruskal-Wallis non-parametric analysis of variance (ANOVA), *p<0.05, **(##)p<0.01. Black arrow represents the start of treatments. (C) Graph represents evolution of mean lung densities (mean CT density) of NaCl- and BLM-receiving mice treated or not with nintedanib at D-1, D9, D16 and D23. Results are presented as median±IQR, n=4 for all groups. Star (*) is a representative of statistical comparison between time points for each group and hash (#) is a representative of statistical comparison between the groups at each time point. The difference between groups was compared using Kruskal-Wallis non-parametric ANOVA, *(#)p<0.05, **p<0.01. Black arrow represents the start of treatments. (D) Graph represents the intensity of Picrosirius red staining on lung section from of NaCl- and BLM-receiving mice treated or not with nintedanib at D23. Results are presented as median±IQR, n=4 for all groups. Star (*) is a representative of comparison of each group with the NaCl group and hash (#) is a representative of statistical comparison of the BLM and BLM+nintedanib groups. The difference between groups was compared using Kruskal-Wallis non-parametric ANOVA, *(#)p<0.05. (E) Correlation of 99mTc-tilmanocept lung uptake at D9 and variation of CT quantification between D9 and D23 in BLM+nintedanib-treated mice. (F) CD206 expression at D23 was expressed in percentage of cells expressing CD206 Mo-AMs cells. Results are presented as median±IQR, NaCl n=5, BLM n=7, BLM+NTD n=9. The difference between groups was compared using Kruskal-Wallis non-parametric ANOVA, *p<0.05, ***p<0.001.
Figure 5
Figure 5. In vivo imaging of CD206 is a useful tool to monitor tofacitinib efficacy. (A) Representative 99mTc-tilmanocept single photon emission computed tomography/CT (SPECT/CT) images of NaCl- and bleomycin (BLM)-receiving mice treated or not with tofacitinib at D-1, D9, D16 and D23 (the lung region is represented by the dotted circle). Graph represents evolution of 99mTc-tilmanocept lung uptake (%ID/g) at all time points. Results are presented as median±IQR, n=4 for all groups. Star (*) is a representative of statistical comparison between time points for each group and hash (#) is a representative of statistical comparison between the groups at each time points. The difference between groups was compared using Kruskal-Wallis non-parametric analysis of variance (ANOVA), **p<0.01, ***(###)p<0.001. Black arrow represents the start of treatments. (B) Graph represents evolution of mean lung densities of NaCl- and BLM-receiving mice treated or not with tofacitinib at D-1, D9, D16 and D23. Results are presented as median±IQR, n=4 for all groups. Star (*) is a representative of statistical comparison between time points for each group and hash (#) is a representative of statistical comparison between the groups at each time point. The difference between groups was compared using Kruskal-Wallis non-parametric ANOVA, #p<0.05, **p<0.01, ***p<0.001. Black arrow represents the start of treatments. (C) Graph represents the intensity of Picrosirius red staining on lung section from NaCl- and BLM-receiving mice treated or not with tofacitinib at D23. Results are presented as median±IQR, n=4 for all groups. Star (*) is a representative of comparison of each group with the NaCl group and hash (#) is a representative of statistical comparison of BLM and BLM+tofacitinib groups. The difference between groups was compared using Kruskal-Wallis non-parametric ANOVA, *(#)p<0.05. (D) Correlation of 99mTc-tilmanocept lung uptake at D9 and variation of CT quantification between D9 and D23 in BLM-treated mice. (E) Correlation of 99mTc-tilmanocept lung uptake at D9 and variation of CT quantification between D9 and D23 in BLM+tofacitinib-treated mice.

References

    1. Wijsenbeek M, Cottin V. Spectrum of fibrotic lung diseases. N Engl J Med. 2020;383:958–68. doi: 10.1056/NEJMra2005230. - DOI - PubMed
    1. Martinez FJ, Collard HR, Pardo A, et al. Idiopathic pulmonary fibrosis. Nat Rev Dis Primers. 2017;3:17074. doi: 10.1038/nrdp.2017.74. - DOI - PubMed
    1. Nasser M, Larrieu S, Si-Mohamed S, et al. Progressive fibrosing interstitial lung disease: a clinical cohort (the PROGRESS study) Eur Respir J. 2021;57:2002718. doi: 10.1183/13993003.02718-2020. - DOI - PMC - PubMed
    1. Cheng P, Li S, Chen H. Macrophages in lung injury, repair, and fibrosis. Cells. 2021;10:436. doi: 10.3390/cells10020436. - DOI - PMC - PubMed
    1. Joshi N, Watanabe S, Verma R, et al. A spatially restricted fibrotic niche in pulmonary fibrosis is sustained by M-CSF/M-CSFR signalling in monocyte-derived alveolar macrophages. Eur Respir J. 2020;55:1900646. doi: 10.1183/13993003.00646-2019. - DOI - PMC - PubMed

Publication types

MeSH terms

LinkOut - more resources