. 2024 Jul 20;16(1):96.
doi: 10.1186/s13148-024-01710-1.

Epigenetic and transcriptional control of adipocyte function by centenarian-associated SIRT6 N308K/A313S mutant

Affiliations

Epigenetic and transcriptional control of adipocyte function by centenarian-associated SIRT6 N308K/A313S mutant

Jan Frohlich et al. Clin Epigenetics. .

Abstract

Background: Obesity is a major health burden. Preadipocytes proliferate and differentiate in mature adipocytes in the adipogenic process, which could be a potential therapeutic approach for obesity. Deficiency of SIRT6, a stress-responsive protein deacetylase and mono-ADP ribosyltransferase enzyme, blocks adipogenesis. Mutants of SIRT6 (N308K/A313S) were recently linked to the in the long lifespan Ashkenazi Jews. In this study, we aimed to clarify how these new centenarian-associated SIRT6 genetic variants affect adipogenesis at the transcriptional and epigenetic level.

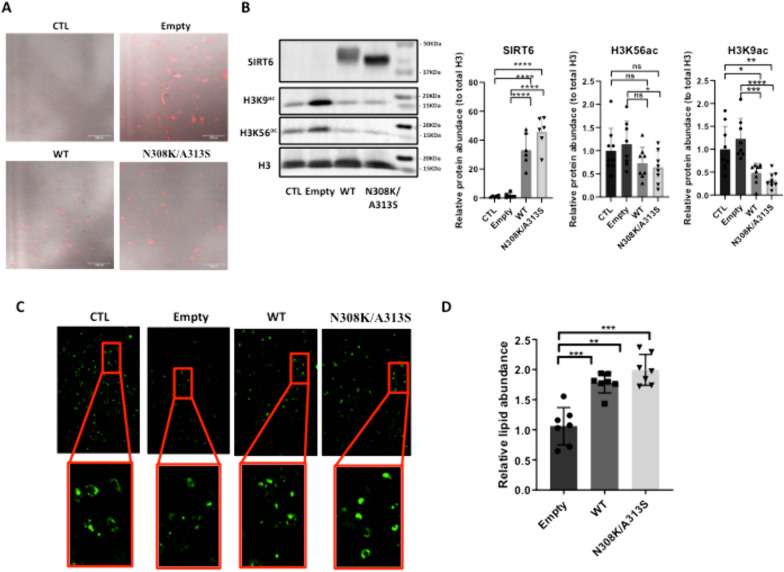
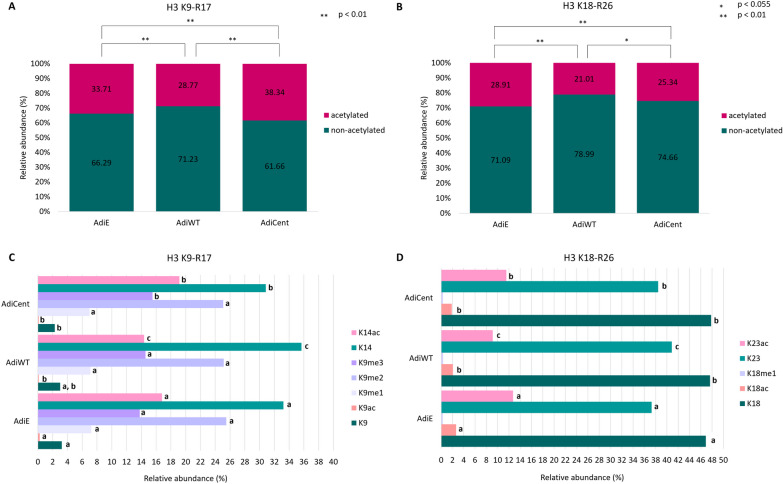
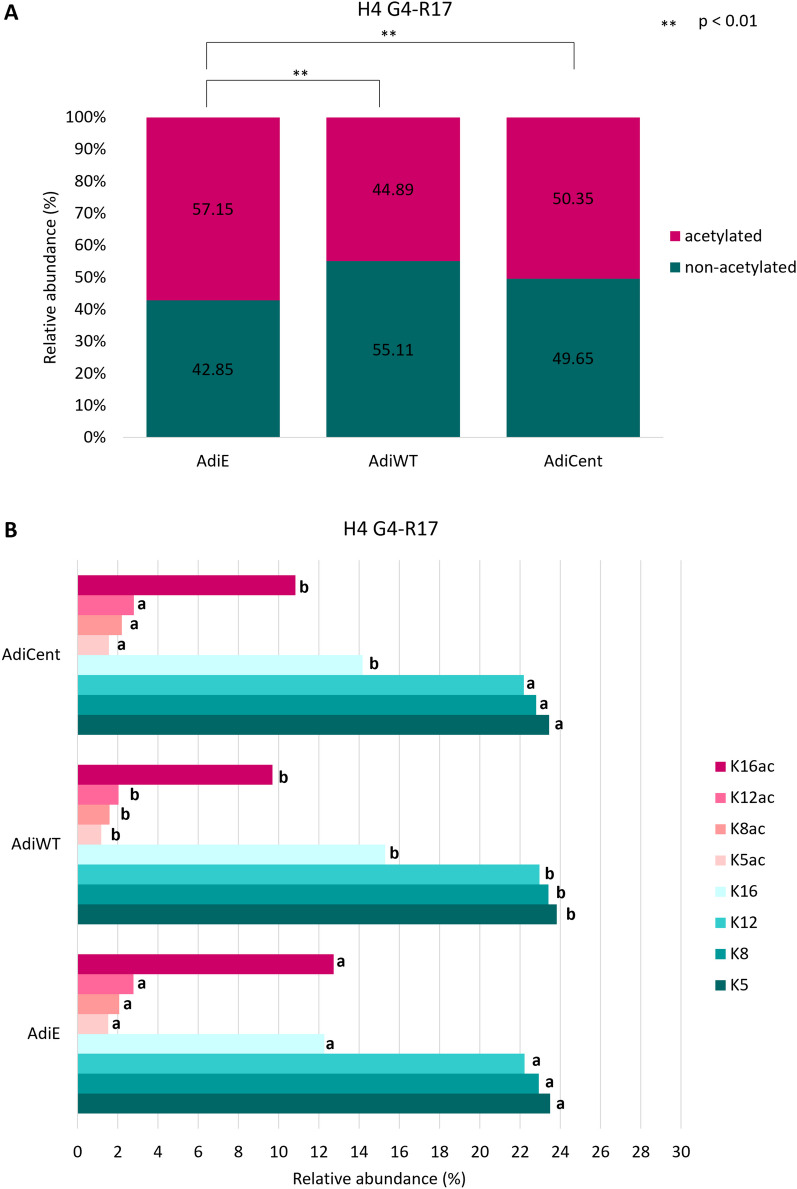
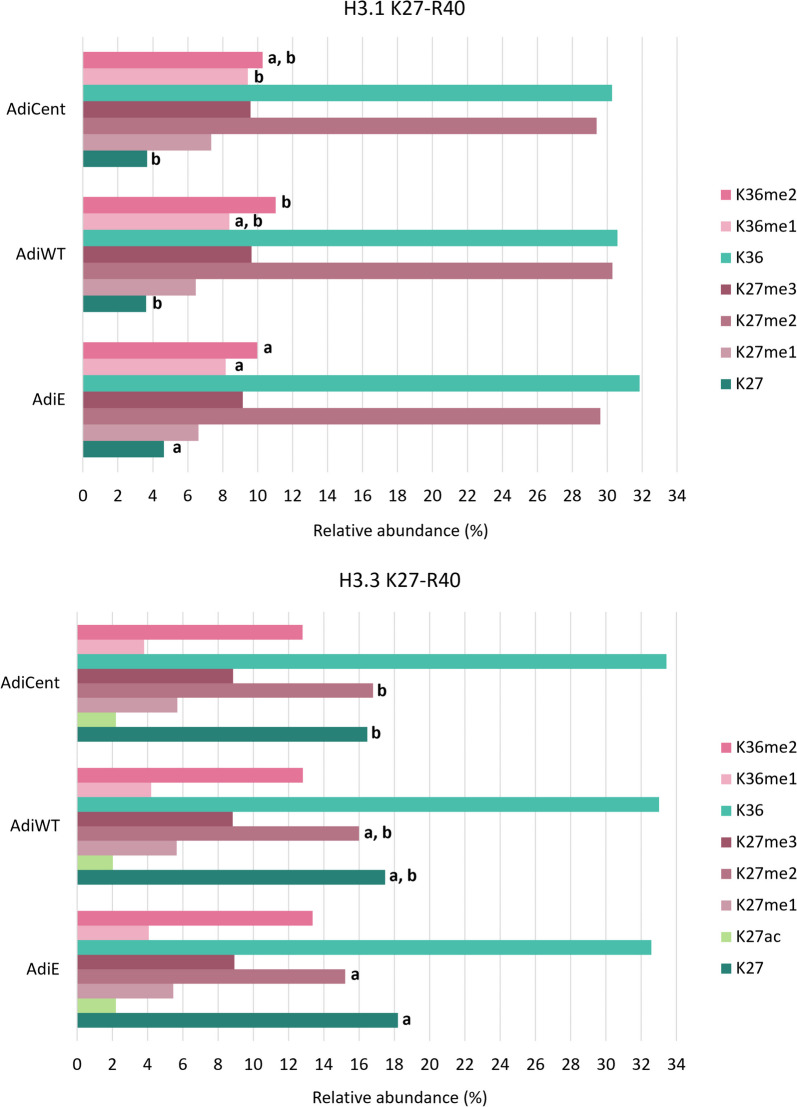
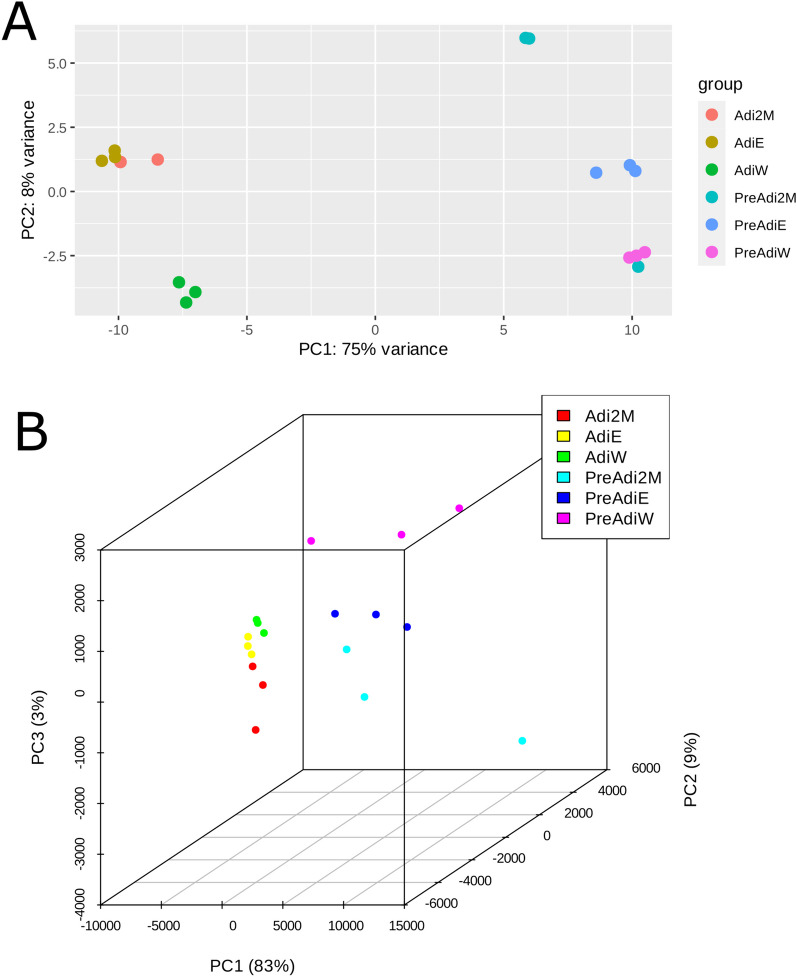
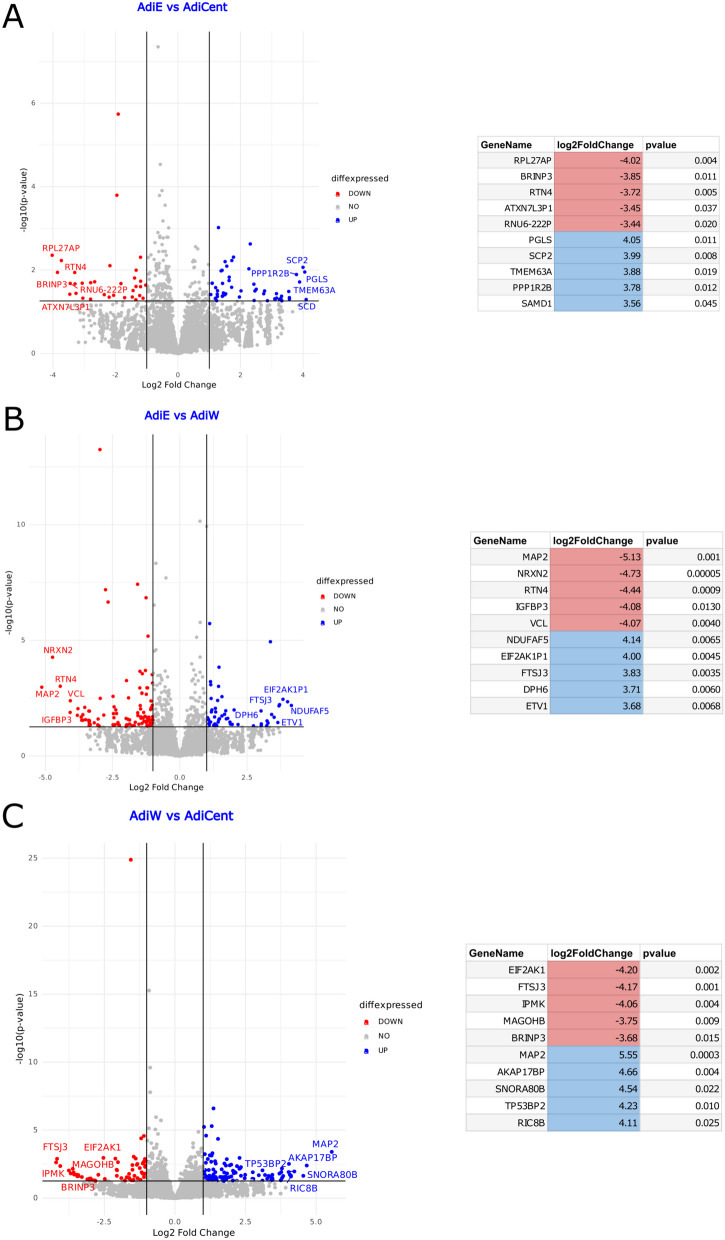
Methods: We analyzed the role of SIRT6 wild-type (WT) or SIRT6 centenarian-associated mutant (N308K/A313S) overexpression in adipogenesis, by creating stably transduced preadipocyte cell lines using lentivirus on the 3T3-L1 model. Histone post-translational modifications (PTM: acetylation, methylation) and transcriptomic changes were analyzed by mass spectrometry (LC-MS/MS) and RNA-Seq, respectively, in 3T3-L1 adipocytes. In addition, the adipogenic process and related signaling pathways were investigated by bioinformatics and biochemical approaches.

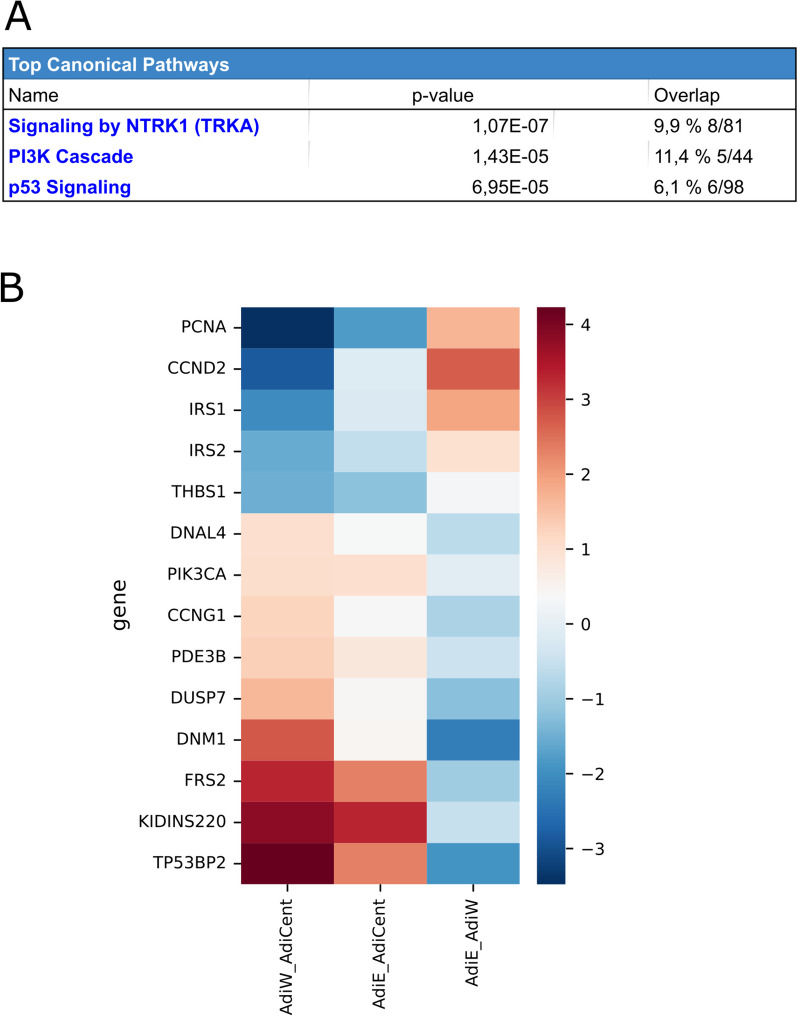
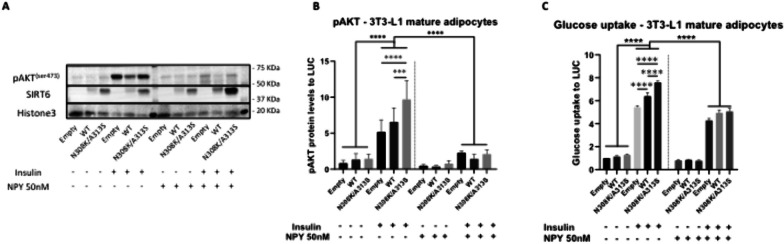
Results: Overexpression of centenarian-associated SIRT6 mutant increased adipogenic differentiation to a similar extent compared to the WT form. However, it triggered distinct histone PTM profiles in mature adipocytes, with significantly higher acetylation levels, and activated divergent transcriptional programs, including those dependent on signaling related to the sympathetic innervation and to PI3K pathway. 3T3-L1 mature adipocytes overexpressing SIRT6 N308K/A313S displayed increased insulin sensitivity in a neuropeptide Y (NPY)-dependent manner.

Conclusions: SIRT6 N308K/A313S overexpression in mature adipocytes ameliorated glucose sensitivity and impacted sympathetic innervation signaling. These findings highlight the importance of targeting SIRT6 enzymatic activities to regulate the co-morbidities associated with obesity.

Keywords: Adipogenesis; Epigenetics; Histones; Obesity; SIRT6.


Conflict of interest statement

The authors declare no competing interests.

Figures

Fig. 1
Fig. 1
LV-mediated SIRT6 mutant overexpression and its impact on adipogenesis 3T3-L1 cells. A Far-red fluorescence protein Katushka2S contained in the LV cassette, alone in the empty group, or together with one of SIRT6 versions (WT, N308K/A313S), demonstrating the successful infection. B Immunoblotting to assess SIRT6 protein expression and acetylation levels of SIRT6 target H3K9 and H3K56 sites, in the groups infected with LV-SIRT6 (WT or N308K/A318S) compared to either empty or control (CTL) cells (left panel); densitometric quantification as in (B) (right panel). C Intracellular lipid levels quantification of BODIPY measurement in 3T3‐L1 preadipocytes, infected with empty LV or LV to overexpress SIRT6 WT or N308K/A318S mutant and then undergoing adipogenic differentiation. D ImageJ-assisted quantification of relative lipid abundance as in (C). *p < 0.05; **p < 0.01; ***p < 0.001 (Mann–Whitney U test, compared with CTL samples)
Fig. 2
Fig. 2
The impact of SIRT6 OE on H3 acetylation profiles. Differences in global acetylation of A H3K9STGGKAPR17 (H3K9 − R17) and B H3K18QLATKAAR26 (H3K18 − R26) peptides in control AdiE, and SIRT6 OE-samples (AdiWT and AdiCent) with a detailed view C on the levels of identified histone marks. Numbers correspond to the median values (n = 3–4) of precursor peak areas in percentages. For each histone mark, different letters indicate significant differences between AdiE, AdiWT and AdiCent according to the Student t test at p < 0.055
Fig. 3
Fig. 3
The impact of SIRT6 OE on H4 acetylation profile. Differences in A global acetylation of H4G4KGGKGLGKGGAKR17 (H4G4 − R17) peptides in control AdiE, and SIRT6 OE-samples (AdiWT and AdiCent) with a detailed view B on the levels of identified histone marks. Numbers correspond to the median values (n = 3–4) of precursor peak areas in percentages. For each histone mark, different letters indicate significant differences between AdiE, AdiWT and AdiCent according to the Student t test at p < 0.055
Fig. 4
Fig. 4
The impact of SIRT6 OE on K27–R40 methylation profiles in H3.1 and H3.3 variants. Numbers correspond to the median values (n = 3–4) of precursor peak areas in percentages. For each histone mark, different letters indicate significant differences between AdiE, AdiWT and AdiCent according to the Student t test at p < 0.055
Fig. 5
Fig. 5
A 2D and B 3D visualization of the principal component analysis (PCA) performed on the variance-stabilized counts obtained with DESeq2. The PCA allows the visualization of the overall gene expression structure across samples, identifying any potential sources of variation or clustering in the data
Fig. 6
Fig. 6
Volcano Plot visualization of Differentially Expressed Genes (DEGs) between adipocytes. The x-axis represents the log2 fold change (log2FC), and the y-axis represents the -log10 of the p value. Genes with significant differential expression are highlighted in blue (up-regulated genes) and red (down-regulated) and are reported in the flanking table with the same color code. A AdiE vs. AdiCent. B AdiE vs. AdiWT. C AdiWT vs. AdiCent
Fig. 7
Fig. 7
Bioinformatic analysis of RNA-seq data. A Top 3 Canonical Pathways obtained with an Ingenuity Pathway Analysis (IPA) enrichment analysis for the comparison between AdiWT and AdiCent. B Heatmap visualization depicting the fold changes of the top 10 DEGs for the comparison between AdiWT and AdiCent. The color intensity represents the fold change in gene expression, with red indicating upregulation and blue indicating downregulation
Fig. 8
Fig. 8
LV-mediated SIRT6 mutant overexpression and its impact on insulin sensitivity in 3T3-L1 cells. A immunoblotting to assess pAKTSer473 and SIRT6 protein expression levels, in cells infected with LV-SIRT6 (WT or N308K/A318S) or empty control. B Densitometric quantification as in (B). (C) 3T3-L1 cells infected with LV-SIRT6 (WT or N308K/A318S) or empty control were treated with/without 50 nM NPY for 12 h and/or 100 nM insulin (INS) for 30 min to detect basal glucose uptake. ***p < 0.001, ****p < 0.0001 (Mann–Whitney U test)

References

    1. https://www.who.int/news-room/fact-sheets/detail/obesity-and-overweight, A.f. World Health Organization. Obesity and overweight. WHO Newsroom Fact Sheets. 2022.
    1. Bankoglu EE, Stopper H. Obesity-related genomic instability and altered xenobiotic metabolism: possible consequences for cancer risk and chemotherapy. Expert Rev Mol Med. 2022;24: e28. 10.1017/erm.2022.22 - DOI - PMC - PubMed
    1. Houtkooper RH, Pirinen E, Auwerx J. Sirtuins as regulators of metabolism and healthspan. Nat Rev Mol Cell Biol. 2012;13(4):225–38. 10.1038/nrm3293 - DOI - PMC - PubMed
    1. Tonkin J, et al. SIRT1 signaling as potential modulator of skeletal muscle diseases. Curr Opin Pharmacol. 2012;12(3):372–6. 10.1016/j.coph.2012.02.010 - DOI - PubMed
    1. Kanfi Y, et al. The sirtuin SIRT6 regulates lifespan in male mice. Nature. 2012;483(7388):218–21. 10.1038/nature10815 - DOI - PubMed