

Estimating the household secondary attack rate and serial interval of COVID-19 using social media
- PMID: 39033238
- PMCID: PMC11271293
- DOI: 10.1038/s41746-024-01160-2
Estimating the household secondary attack rate and serial interval of COVID-19 using social media
Abstract
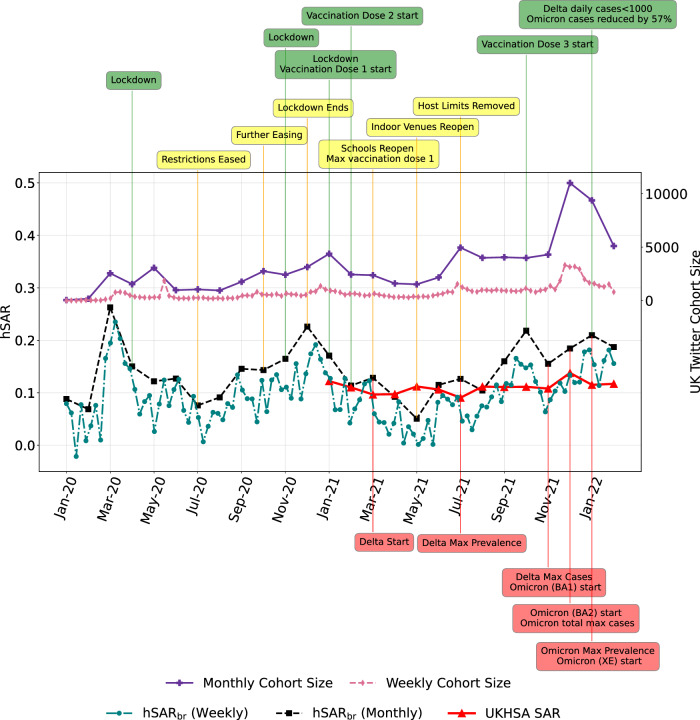
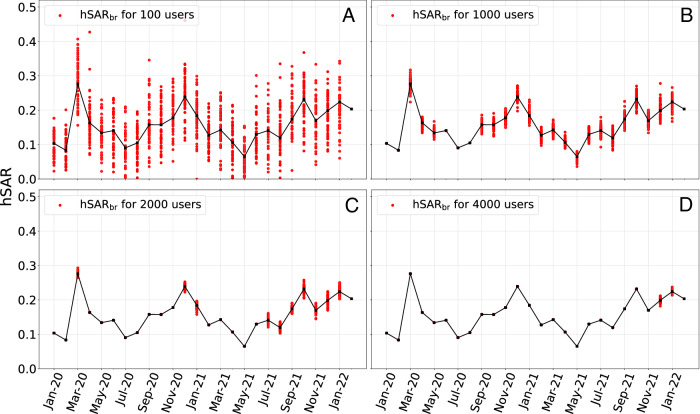
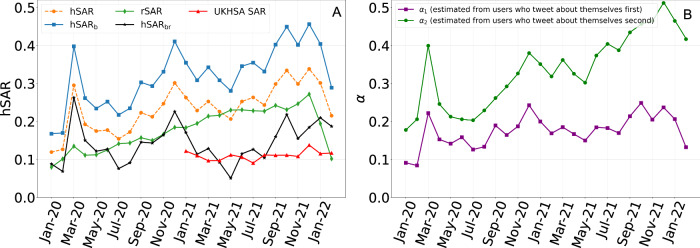
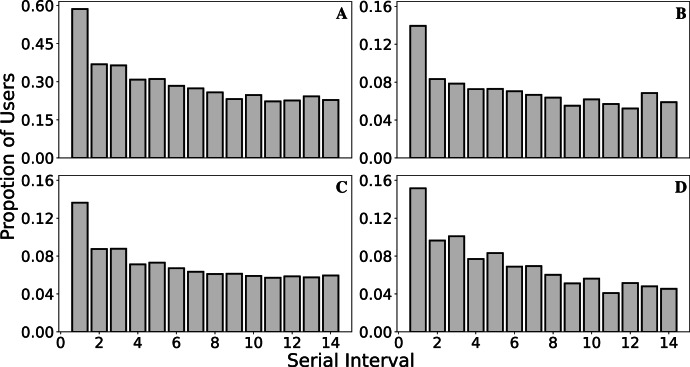
We propose a method to estimate the household secondary attack rate (hSAR) of COVID-19 in the United Kingdom based on activity on the social media platform X, formerly known as Twitter. Conventional methods of hSAR estimation are resource intensive, requiring regular contact tracing of COVID-19 cases. Our proposed framework provides a complementary method that does not rely on conventional contact tracing or laboratory involvement, including the collection, processing, and analysis of biological samples. We use a text classifier to identify reports of people tweeting about themselves and/or members of their household having COVID-19 infections. A probabilistic analysis is then performed to estimate the hSAR based on the number of self or household, and self and household tweets of COVID-19 infection. The analysis includes adjustments for a reluctance of Twitter users to tweet about household members, and the possibility that the secondary infection was not acquired within the household. Experimental results for the UK, both monthly and weekly, are reported for the period from January 2020 to February 2022. Our results agree with previously reported hSAR estimates, varying with the primary variants of concern, e.g. delta and omicron. The serial interval (SI) is based on the time between the two tweets that indicate a primary and secondary infection. Experimental results, though larger than the consensus, are qualitatively similar. The estimation of hSAR and SI using social media data constitutes a new tool that may help in characterizing, forecasting and managing outbreaks and pandemics in a faster, affordable, and more efficient manner.
© 2024. Crown.
Conflict of interest statement
The authors declare no competing interests.
Figures
Similar articles
-
Increased Secondary Attack Rates among the Household Contacts of Patients with the Omicron Variant of the Coronavirus Disease 2019 in Japan.Int J Environ Res Public Health. 2022 Jun 30;19(13):8068. doi: 10.3390/ijerph19138068. Int J Environ Res Public Health. 2022. PMID: 35805724 Free PMC article.
-
Secondary Attack Rate among Non-Spousal Household Contacts of Coronavirus Disease 2019 in Tsuchiura, Japan, August 2020-February 2021.Int J Environ Res Public Health. 2021 Aug 25;18(17):8921. doi: 10.3390/ijerph18178921. Int J Environ Res Public Health. 2021. PMID: 34501511 Free PMC article.
-
Mapping tweets to a known disease epidemiology; a case study of Lyme disease in the United Kingdom and Republic of Ireland.J Biomed Inform. 2019;100S:100060. doi: 10.1016/j.yjbinx.2019.100060. Epub 2019 Oct 18. J Biomed Inform. 2019. PMID: 34384577
-
[Analysis on the household secondary attack rates of the SARS-CoV-2 Delta variant and the associated factors].Zhonghua Yu Fang Yi Xue Za Zhi. 2023 Jan 6;57(1):8-14. doi: 10.3760/cma.j.cn112150-20220526-00535. Zhonghua Yu Fang Yi Xue Za Zhi. 2023. PMID: 36655251 Chinese.
-
Emotions and Topics Expressed on Twitter During the COVID-19 Pandemic in the United Kingdom: Comparative Geolocation and Text Mining Analysis.J Med Internet Res. 2022 Oct 5;24(10):e40323. doi: 10.2196/40323. J Med Internet Res. 2022. PMID: 36150046 Free PMC article.
References
-
- NHS England. Nhs flu and covid vaccine programmes brought forward due to risk of new covid variant (2023). https://www.england.nhs.uk/2023/08/nhs-flu-and-covid-vaccine-programmes-....
Grants and funding
LinkOut - more resources
Full Text Sources
