. 2024 Jul 21;15(1):6143.
doi: 10.1038/s41467-024-50502-x.

ER calcium depletion as a key driver for impaired ER-to-mitochondria calcium transfer and mitochondrial dysfunction in Wolfram syndrome

Affiliations

ER calcium depletion as a key driver for impaired ER-to-mitochondria calcium transfer and mitochondrial dysfunction in Wolfram syndrome

Mailis Liiv et al. Nat Commun. .

Abstract

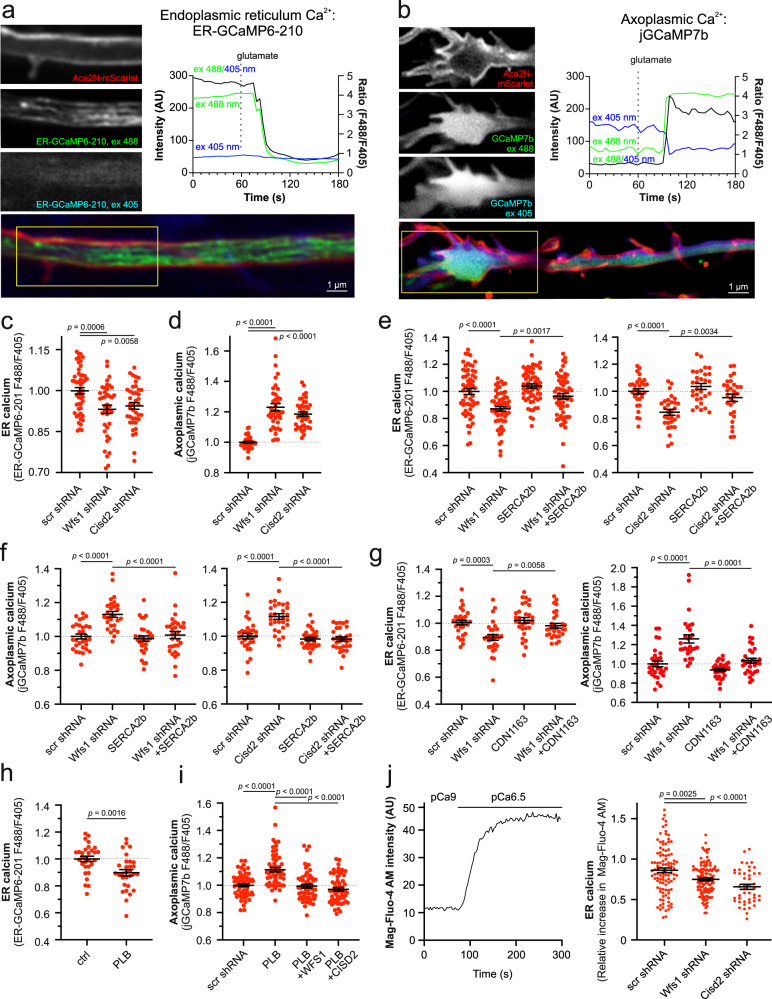
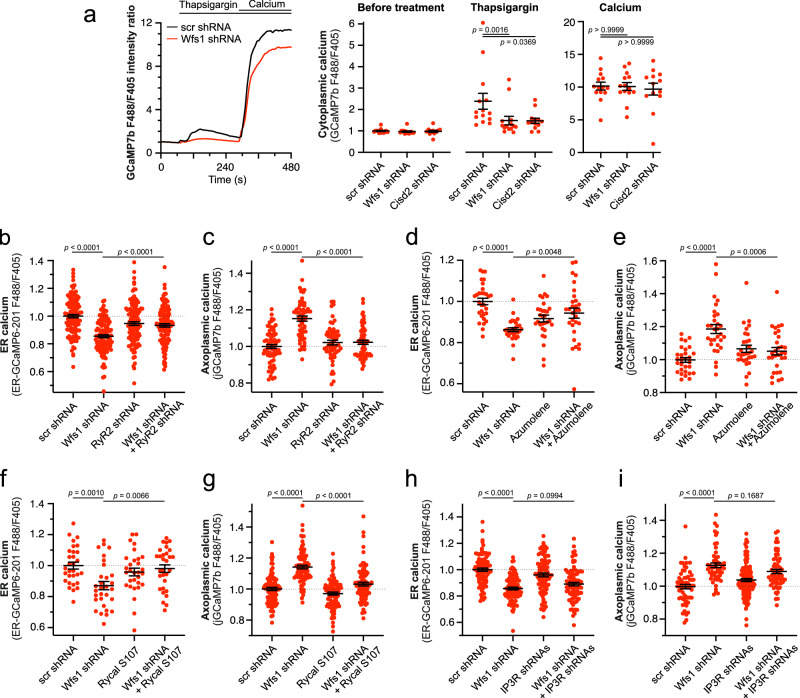
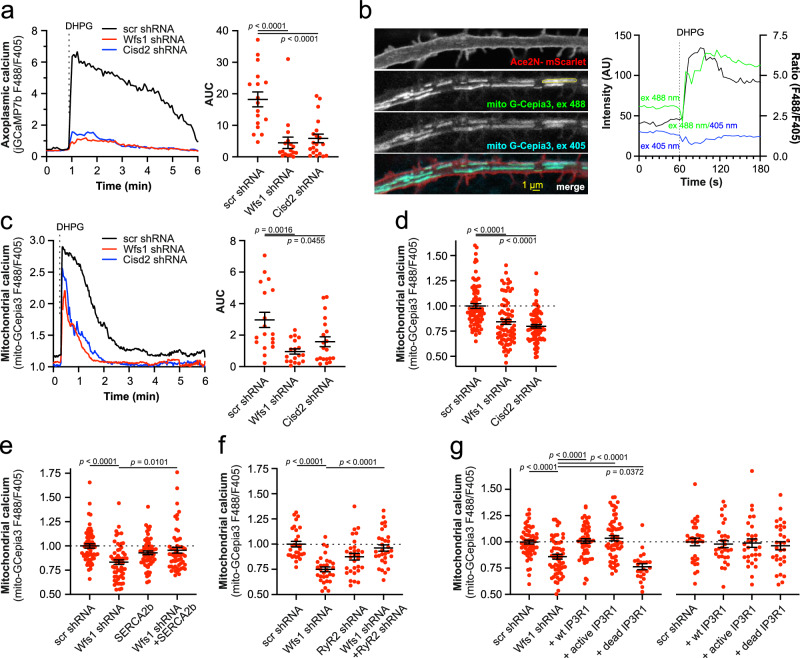
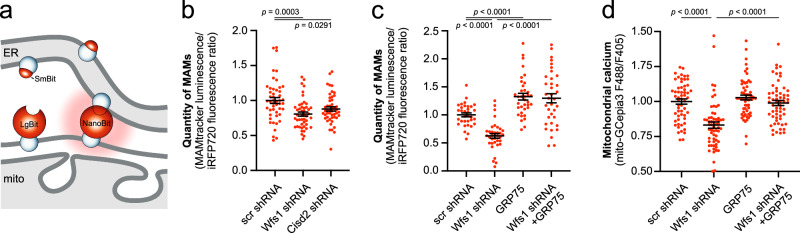
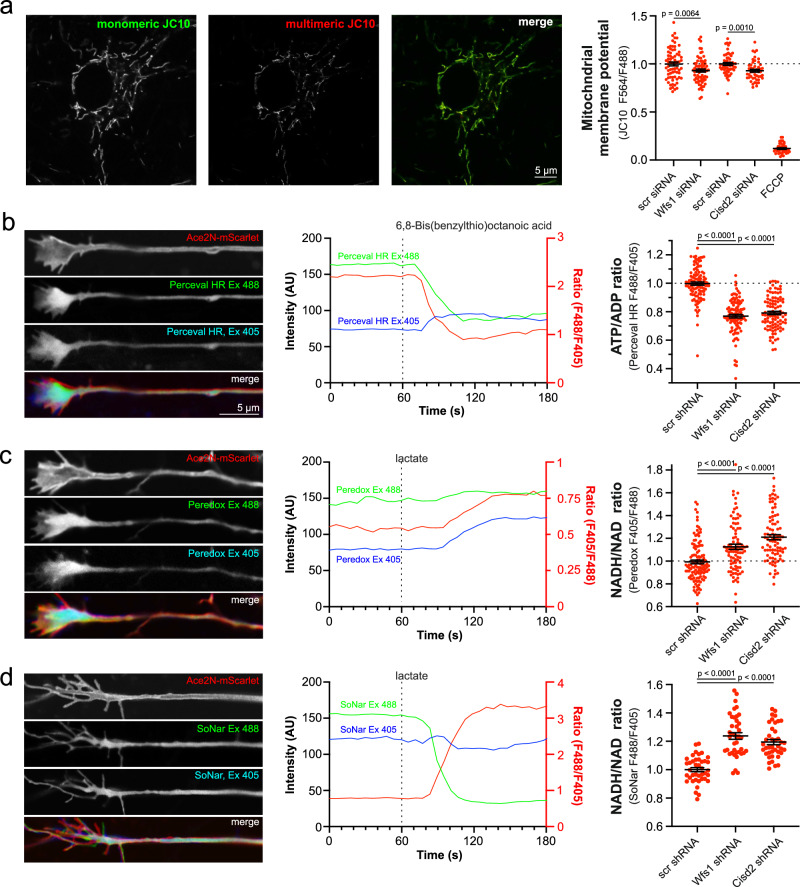
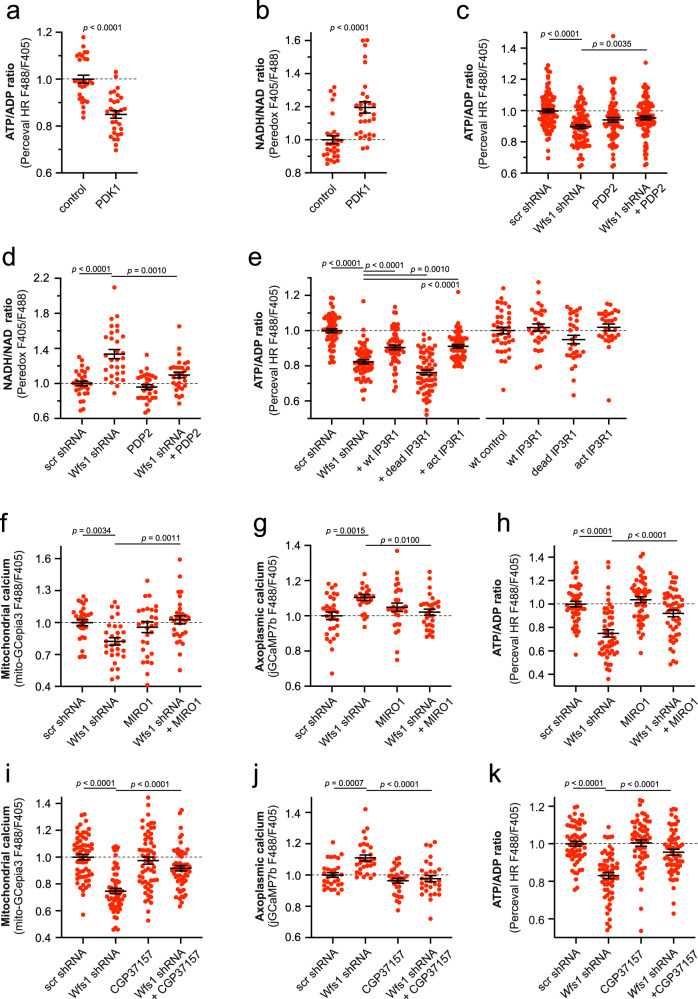
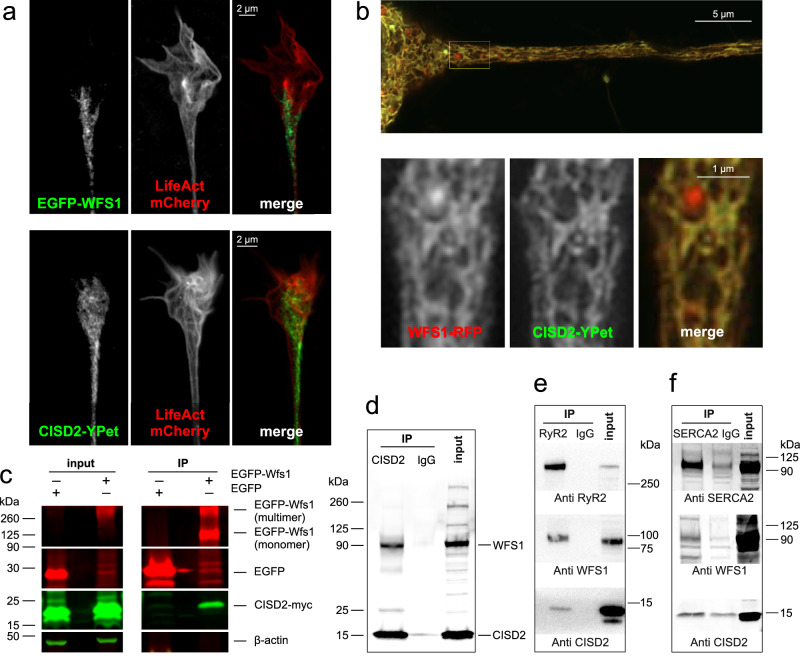
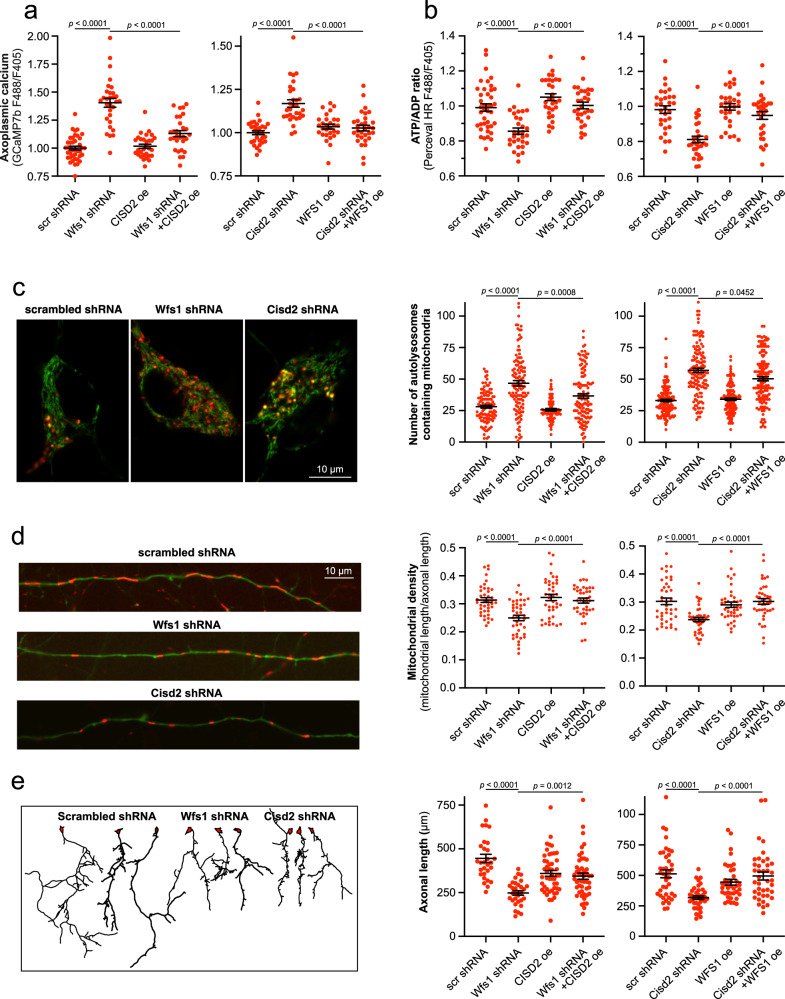
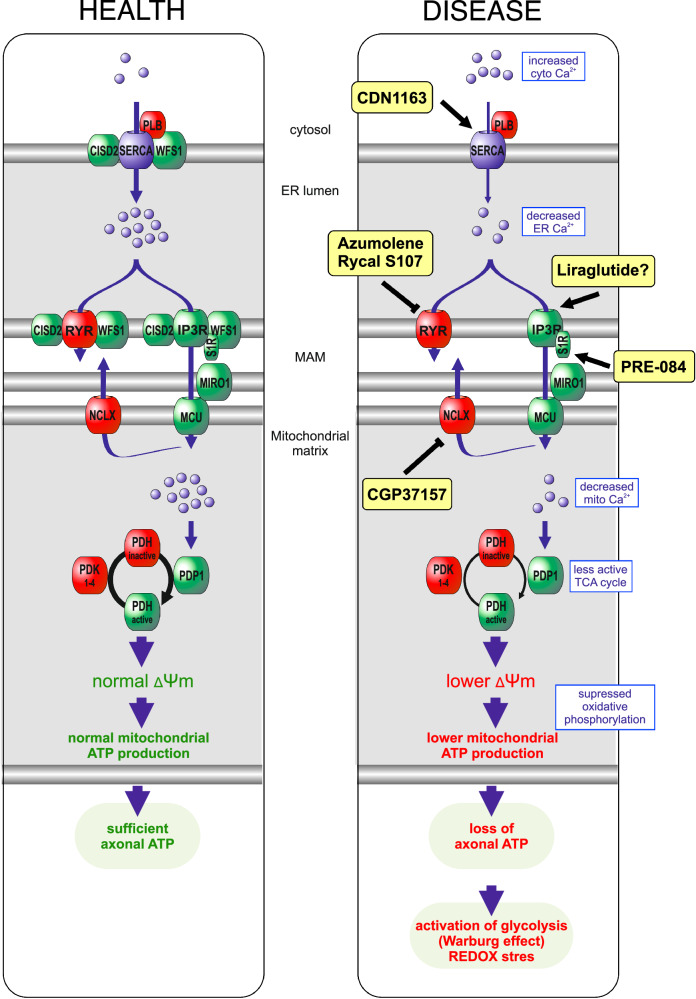
Wolfram syndrome is a rare genetic disease caused by mutations in the WFS1 or CISD2 gene. A primary defect in Wolfram syndrome involves poor ER Ca2+ handling, but how this disturbance leads to the disease is not known. The current study, performed in primary neurons, the most affected and disease-relevant cells, involving both Wolfram syndrome genes, explains how the disturbed ER Ca2+ handling compromises mitochondrial function and affects neuronal health. Loss of ER Ca2+ content and impaired ER-mitochondrial contact sites in the WFS1- or CISD2-deficient neurons is associated with lower IP3R-mediated Ca2+ transfer from ER to mitochondria and decreased mitochondrial Ca2+ uptake. In turn, reduced mitochondrial Ca2+ content inhibits mitochondrial ATP production leading to an increased NADH/NAD+ ratio. The resulting bioenergetic deficit and reductive stress compromise the health of the neurons. Our work also identifies pharmacological targets and compounds that restore Ca2+ homeostasis, enhance mitochondrial function and improve neuronal health.


Conflict of interest statement

The authors declare no competing interests.

Figures

Fig. 1
Fig. 1. Decreased ER but increased axoplasmic Ca2+ levels in the axons of WFS1- and CISD2-deficient neurons.
a Imaging of ER Ca2+ in axons. Neurons were transfected at DIV 2–3 with ER-GCamp6-210 and Ace2N-mScarlet to visualize the axonal morphology and imaged ratiometrically 6–7 days later. Note the decrease in resting ER Ca2+ levels after treatment with 100 µM glutamate and 10 µM glycine. b Axoplasmic Ca2+ imaging at axonal endings. Neurons were transfected at DIV 2–3 with jGCaMP7b and Ace2N-mScarlet, and imaged ratiometrically 6–7 days later. c Resting ER Ca2+ levels in axons were lower in WFS1- or CISD2-deficient neurons. n = 40, 50 or 50 neurons in scrambled-, Wfs1- or Cisd-shRNA expressing groups, respectively. One-way ANOVA and Šídák’s multiple comparisons test. d Resting levels of axoplasmic Ca2+ measured at axonal endings were higher in WFS1- or CISD2-deficient neurons. n = 38, 40 or 40 neurons, Brown-Forsythe ANOVA and Dunnett’s T3 multiple comparisons test. e Overexpression of SERCA2b restored the ER Ca2+ levels in WFS1-deficient (left panel) and CISD2-deficient (right panel) neurons. n = 60 (left), n = 30, 30, 30 or 29 (right) neurons, One-way ANOVA and Šídák’s multiple comparisons test. f Overexpression SERCA2b normalized the axoplasmic Ca2+ levels in WFS1-deficient (left panel) and CISD2-deficient (right panel) neurons. n = 30, 28, 30 or 30 (left), n = 30, 29, 30 or 30 (right) neurons, One-way ANOVA and Šídák’s multiple comparisons test. g SERCA activator CDN1163 (0.5 μM for 48 h) restored ER (left panel) and axoplasmic (right panel) Ca2+ levels in Wfs1-deficient neurons. n = 30 (left), n = 29, 28, 29 or 30 (right) neurons, One-way ANOVA and Šídák’s multiple comparisons test (left) or Brown-Forsythe ANOVA and Dunnett’s T3 multiple comparisons test (right). h Overexpression of phospholamban (PLB) suppresses ER Ca2+ levels in wt neurons. n = 30 neurons, two-tailed t test. i The elevated axoplasmic Ca2+ in phospholamban-expressing neurons was normalized by overexpressing WFS1 or CISD2. n = 60, 60, 59, or 59 neurons, One-way ANOVA and Šídák’s multiple comparisons test. j ER Ca2+ uptake is lower in outer-membrane permeabilised WFS1- and CISD2-deficient neurons. The left panel represents a sample curve. Data presented in the right panel are presented as relative Ca2+ uptake of the transfected cell to Ca2+ uptake in nontransfected neurons in the same field. n = 104, 119 or 46 neurons, Brown-Forsythe ANOVA and Dunnett’s T3 multiple comparisons test. Data are presented as mean ± SEM.
Fig. 2
Fig. 2. Leak through the RyR receptor is responsible for ER Ca2+ loss in WFS1-deficient neurons.
a Thapsigargin-induced Ca2+ release from the ER to cytoplasm is lower in WFS1- and CISD2-deficient neurons. The left panel depicts the typical Ca2+ transients obtained after treatment with 2 µM Thapsigargin in Ca2+-free media in the presence of 0.5 mM EGTA and the effect of subsequent reintroduction of external 10 mM Ca2+. The right panel shows the peak values of these transients before and after Thapsigargin or Ca2+ treatments. n = 14 (scrambled and Wfs1 shRNA) or 13 (Cisd2 shRNA) neurons, Brown-Forsythe ANOVA and Dunnett’s T3 multiple comparisons test. b, c RyR2 knock-down restored the ER and axoplasmic Ca2+ levels in the axons of the WFS1-deficient neurons. n = 120 (b), n = 70, 58, 58 or 59 (c) neurons, one-way ANOVA, and Šídák’s multiple comparisons test. d, e Treatment with 20 µM Azumolene (48 h) restored the basal ER and axoplasmic Ca2+ levels in the axons of WFS1-deficient neurons. n = 30, 29, 30 or 30 (d), n = 29, 30, 30 or 30 (e) neurons, One-way ANOVA and Šídák’s multiple comparisons test. f, g Treatment with 5 μM Rycal S107 (48 h) restored the basal ER and axoplasmic Ca2+ levels in WFS1-deficient neurons. n = 30 (f), n = 88, 87, 90 or 89 (g) neurons, one-way ANOVA and Šídák’s multiple comparisons test. h, i IP3R1 and IP3R3 knock-down did not restore the basal ER and axoplasmic Ca2+ levels in WFS1-deficient neurons. n = 90 (h), n = 60, 57, 118 or 60 (i) neurons, Brown-Forsythe ANOVA and Dunnett’s T3 multiple comparisons test or Kruskal–Wallis test & Dunn’s multiple comparisons test. Data are presented as mean ± SEM.
Fig. 3
Fig. 3. Impaired ER Ca2+ homeostasis is associated with suppressed mitochondrial Ca2+ uptake and decreased basal mitochondrial Ca2+ levels.
a DHPG-induced Ca2+ release from ER to axoplasm is lower in WFS1- and CISD2-deficient neurons. The left panel depicts averaged Ca2+ transients obtained after treatment with 100 μM DHPG and the right panel shows the area under the curve (AUC) of these transients. n = 17, 17 or 20 neurons, One-way ANOVA & Holm-Šídák’s multiple comparisons test. b Imaging of mitochondrial Ca2+ in axons. Neurons were transfected at DIV 2–3 with mitochondrially targeted GCepia3 and Ace2N-mScarlet to visualize the axonal shaft and imaged ratiometrically 5–6 days later. Note the increase in the resting mitochondrial Ca2+ levels after treatment with 100 μM DHPG. c DHPG-induced Ca2+ uptake to axonal mitochondria is lower in WFS1- and CISD2-deficient neurons. The left panel depicts averaged Ca2+ transients obtained after treatment with 100 μM DHPG and the right panel the area under the curve of these transients. n = 18, 18 or 20 neurons, Brown-Forsythe ANOVA and Dunnett’s T3 multiple comparisons test. d Basal mitochondrial Ca2+ levels are lower in the axons of WFS1- and CISD2-deficient neurons. n = 80, 76 or 80 neurons, Kruskal–Wallis test & Dunn’s multiple comparisons test. e Overexpression of SERCA2b restores mitochondrial Ca2+ levels in the axons of WFS1-deficient neurons. n = 60, 59, 60 or 57 neurons, Kruskal–Wallis test & Dunn’s multiple comparisons test. f Knock-down of RyR2 restores mitochondrial Ca2+ levels in the axons of WFS1-deficient neurons. n = 30 neurons, One-way ANOVA and Šídák’s multiple comparisons test. g Overexpression of wt IP3R1 but not pore-dead mutant D2550A restores mitochondrial Ca2+ levels in the axons of WFS1-deficient neurons. n = 58, 60, 57, 60 or 23 (left panel), n = 30 (right panel) neurons, Brown-Forsythe ANOVA and Dunnett’s T3 multiple comparisons test. Data are presented as mean ± SEM.
Fig. 4
Fig. 4. Reduced quantity of MAMs in WFS1- and CISD2-deficient neurons.
a, b Quantity of MAMs is lower in WFS1- or CISD2-deficient neurons. Neurons were transfected at DIV 2–3 with MAMTracker-LUC, iRFP720, and scrambled, Wfs1- or Cisd2 shRNA. On the fifth day post-transfection, culture media were replaced with Nano-Glo® Live Cell Reagent, and luminescence and fluorescence were recorded. Luminescence for the complemented NanoBiT was normalized to cytosolic iRFP720 fluorescence to exclude differences in cell count. n = 48, 48 or 47 wells of neurons, Ordinary one-way ANOVA followed by Dunnett’s multiple comparisons test. c Overexpression of GRP75 restored the MAMs in WFS1- or CISD2-deficient neurons. ****P < 0.0001, n = 33, 36, 36 or 36 wells of neurons, Brown-Forsythe ANOVA test followed by Dunnett’s T3 multiple comparisons test. d Overexpression of GRP75 restored the mitochondrial Ca2+ levels in the axons of WFS1-deficient neurons. ****P < 0.001, n = 57, 60, 60 or 59 wells of neurons, Kruskal–Wallis test & Dunn’s multiple comparisons test. Data are presented as mean ± SEM.
Fig. 5
Fig. 5. Decreased mitochondrial membrane potential, ATP production and increased NADH/NAD+ ratio in the axons of WFS1- and CISD2-deficient neurons.
a Mitochondrial membrane potential is lower in WFS1- and CISD2-deficient neurons. Neurons were transfected at DIV 2 siRNA against Wfs1 and Cisd2 and stained and visualized 48–72 h later. n = 70, 70, 56, 48 or 40 fields of neurons, two-tailed unpaired t-test. Note that Wfs1- and Cisd2 siRNAs were tested in separate experiments. b Axoplasmic ATP levels are lower in WFS1- and CISD2-deficient neurons. Neurons were transfected at DIV 2–3 with Perceval HR and the ATP/ADP ratio was visualized at axonal endings at DIV 8–9. Note the decrease in ATP/ADP ratio after inhibition of mitochondrial pyruvate dehydrogenase by 50 μM 6,8-Bis(benzylthio)octanoic acid. n = 109, 100 or 98 neurons, Kruskal–Wallis test & Dunn’s multiple comparisons test. c, d NADH/NAD+ ratio is increased in the axoplasm of WFS1- and CISD2-deficient neurons. Neurons were transfected at DIV 2–3 with Peredox (C) or SoNar (D) and the NADH/NAD+ ratio was visualized at axonal endings at DIV 8–9. Note the decrease in NADH/NAD+ ratio after treatment with 10 mM lactate. n = 119, 89 or 88 neurons, Kruskal–Wallis test & Dunn’s multiple comparisons test (c) or n = 40 neurons, Brown-Forsythe ANOVA and Dunnett’s T3 multiple comparisons test (d). Data are presented as mean ± SEM.
Fig. 6
Fig. 6. Low mitochondrial Ca2+ is related to poor ATP production.
a, b Suppression of pyruvate dehydrogenase by overexpressing the pyruvate dehydrogenase kinase 1 decreases axoplasmic ATP levels and increases axoplasmic NADH levels. n = 30 neurons, two-tailed unpaired t test (a) or two-tailed Mann–Whitney test (b). c Overexpression of PDP2 partially restores the ATP levels at the axonal endings of WFS1-deficient neurons. n = 90, 90, 80 or 89 neurons, One-way ANOVA and Šídák’s multiple comparisons test. d Overexpression of PDP2 normalizes the NADH/NAD+ ratio at the axonal endings of WFS1-deficient neurons. n = 30 neurons, Brown-Forsythe ANOVA and Dunnett’s T3 multiple comparisons test. e IP3R1 overexpression restored the ATP levels in the axoplasm of WFS1-deficient neurons. n = 60, 60, 60, 60 or 59 (left panel), n = 40, 30, 30, 30, 30 (right panel) neurons, one-way ANOVA and Šídák’s multiple comparisons test. fh Overexpressed MIRO1 normalized the mitochondrial (f) and axoplasmic Ca2+ (g) and increased the axonal ATP content (h) in WFS1-deficient neurons. n = 30 (f), n = 30, 27, 29, 30 (g), n = 50, 50, 50, 49 (h), One-way ANOVA and Šídák’s multiple comparisons test. ik Treatment with CGP37157 (10 μm for 48 h) normalized the mitochondrial (i) and axoplasmic Ca2+ (j) and increased the axoplasmic ATP content (k) in WFS1-deficient neurons. n = 60, 60, 60, 58 (f), n = 30, 29, 30, 30 (g), n = 60 (h), Brown-Forsythe ANOVA and Dunnett’s T3 multiple comparisons test (i) or One-way ANOVA and Šídák’s multiple comparisons test (j, k). Data are presented as mean ± SEM.
Fig. 7
Fig. 7. WFS1 colocalizes and interacts with CISD2.
a Airyscan2 images demonstrating strong expression of EGFP-WFS1 and CISD2-YPet in the axonal terminals. b Airyscan2 image demonstrating colocalization of CISD2-YPet and WFS1-RFP in the axonal ER. Note that WFS1-RFP tends to form aggregates that do not colocalize with CISD2. c Overexpressed CISD2 co-immunoprecipitates with overexpressed WFS1. EGFP-WFS1 was immunoprecipitated from the HEK 293 cell lysate using GFP-Trap, and co-immunoprecipitated CISD2-myc was detected using anti-myc antibodies. d Endogenous WFS1 co-immunoprecipitates with endogenous CISD2. CISD2 was immunoprecipitated from HEK293 cell lysate using mouse anti-CISD2 and detected using rabbit anti-WFS1. e WFS1 and CISD2 co-immunoprecipitate with RyR2. RyR2 was immunoprecipitated from lysates of 6-month-old whole mouse brains, followed by assessment of WFS1 and CISD2 presence in the immunocomplex. f WFS1 and CISD2 co-immunoprecipitate with SERCA2. SERCA2 was immunoprecipitated from PC6 cell lysate with mouse anti-SERCA2 antibodies and probed with rabbit anti-WFS1, anti-CISD2, and anti-SERCA antibodies.
Fig. 8
Fig. 8. WFS1 and CISD2 compensate for each other.
a Overexpression of CISD2 in WFS1-deficient neurons (left panel) and WFS1 in CISD2-deficient neurons (right panel) suppress the basal axoplasmic Ca2+ back to normal. n = 40, 30, 30, or 29 (left panel), n = 31, 30, 29, 31, (right panel) neurons, One-way ANOVA & Šídák’s multiple comparisons test. b Overexpression of CISD2 in WFS1-deficient neurons (left panel) and WFS1 in CISD2-deficient neurons (right panel) restore normal ATP levels. n = 40, 30, 30, or 30 (left panel), n = 30, 31, 30, 30 (right panel) neurons, One-way ANOVA & Šídák’s multiple comparisons test. c Increased mitophagy in WFS1- and CISD2-deficient neurons (left panel) is partially suppressed when overexpressing CISD2 (middle panel) or WFS1 (right panel). Primary cortical neurons were transfected with mitochondrially targeted Keima (which changes its excitation spectrum under acidic conditions: green, mitochondria at neutral pH and red, mitochondria under acidic pH) and plasmids of interest. n = 110, 119, 70, or 120 (left panel), n = 140 neurons, Kruskal–Wallis test & Dunn’s multiple comparisons test. d Mitochondrial loss in WFS1- and CISD2-deficient neurons (left panel) is reversed when overexpressing CISD2 (middle panel) or WFS1 (right panel). Neurons were transfected with with EGFP, mitochondrial DsRed2 and plasmids of interest. n = 40 neurons, One-way ANOVA & Šídák’s multiple comparisons test or Brown-Forsythe ANOVA & Dunnett’s T3 multiple comparisons test. e Suppressed axonal growth in WFS1- and CISD2-deficient neurons (left panel) is reversed when overexpressing CISD2 (middle panel) or WFS1 (right panel). Neurons were transfected with pAAV-hSyn-DsRedExpress and plasmids of interest at DIV1 and visualized at DIV3. n = 29, 30, 49, or 49 (left panel), n = 40, 38, 39, 40 (right panel) neurons, Kruskal–Wallis test & Dunn’s multiple comparisons test. Data are presented as mean ± SEM.
Fig. 9
Fig. 9. The main strategies to restore ER-mitochondria Ca2+ signaling in WS neurons and to ensure the normal function of numerous Ca2+-dependent mitochondrial processes.
Loss of ER Ca2+ content and ER-mitochondrial contact sites in WFS1- or CISD2-deficient neurons results in diminished IP3R-mediated Ca2+ transfer from ER to mitochondria. Reduced mitochondrial Ca2+ levels suppress the TCA cycle and mitochondrial ATP production, leading to the bioenergetic deficit and redox stress, particularly at axonal terminals. Potential interventions include: (1) enhancing ER Ca2+ uptake with SERCA activators such as CDN1163, (2) suppressing ER Ca2+ release or leakage via ryanodine receptors with Rycal S107 or azumolene, (3) activating IP3R-mediated Ca2+ flux with sigma-1 receptor (S1R) agonists like PRE-084, (4) inhibiting Ca2+ extrusion from the mitochondrial matrix by targeting the Na+/Ca2+ exchanger with CGP37157 and (5) potentially improving Ca2+ homeostasis with the GLP-1 agonist liraglutide, although its mechanisms in this context remain unclear.

References

    1. Rigoli, L. & Di Bella, C. Wolfram syndrome 1 and Wolfram syndrome 2. Curr. Opin. Pediatr.24, 512–517 (2012). 10.1097/MOP.0b013e328354ccdf - DOI - PubMed
    1. Loncke, J., Vervliet, T., Parys, J. B., Kaasik, A. & Bultynck, G. Uniting the divergent Wolfram syndrome–linked proteins WFS1 and CISD2 as modulators of Ca2+ signaling. Sci. Signal.14, eabc6165 (2021). 10.1126/scisignal.abc6165 - DOI - PubMed
    1. Barrett, T. et al. In GeneReviews(®) (eds. M. P. Adam, D. B. Everman, & G. M. Mirzaa et al.) (University of Washington, Seattle;1993-2022, 1993).
    1. Barrett, T. G., Bundey, S. E. & Macleod, A. F. Neurodegeneration and diabetes: UK nationwide study of Wolfram (DIDMOAD) syndrome. Lancet346, 1458–1463 (1995). 10.1016/S0140-6736(95)92473-6 - DOI - PubMed
    1. Delvecchio, M., Iacoviello, M., Pantaleo, A. & Resta, N. Clinical spectrum associated with wolfram syndrome type 1 and type 2: a review on genotype–phenotype correlations. Int. J. Environ. Res. Public Health18, 4796 (2021). 10.3390/ijerph18094796 - DOI - PMC - PubMed

LinkOut - more resources