. 2024 Jul 22;16(1):91.
doi: 10.1186/s13073-024-01328-1.

PARP4 interacts with hnRNPM to regulate splicing during lung cancer progression

Affiliations

PARP4 interacts with hnRNPM to regulate splicing during lung cancer progression

Yi Fei Lee et al. Genome Med. .

Abstract

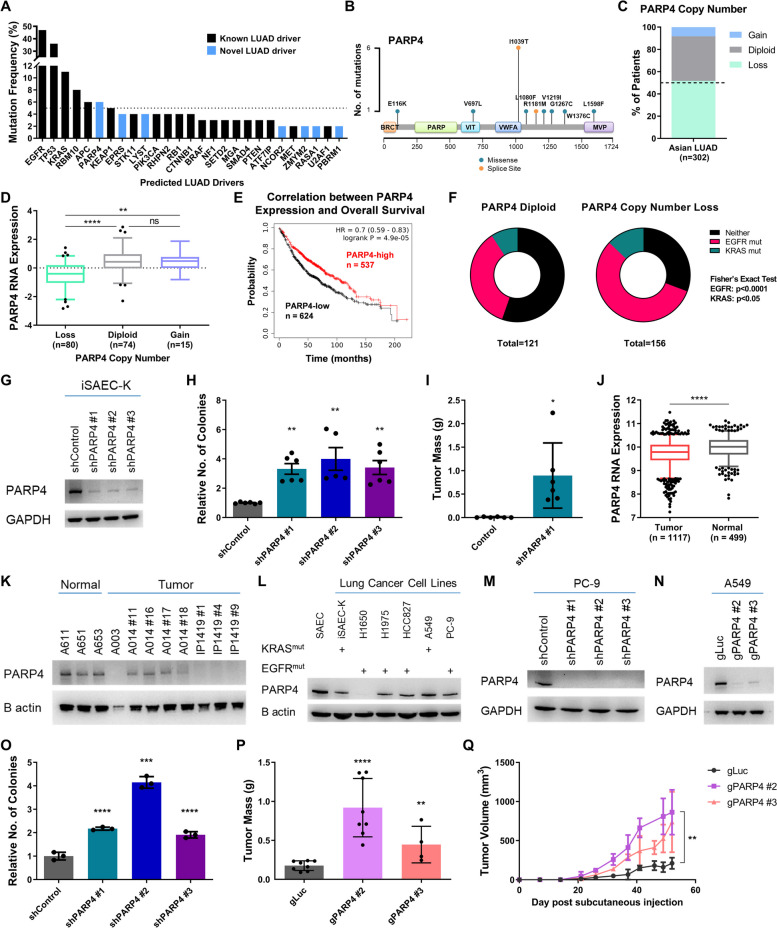
Background: The identification of cancer driver genes from sequencing data has been crucial in deepening our understanding of tumor biology and expanding targeted therapy options. However, apart from the most commonly altered genes, the mechanisms underlying the contribution of other mutations to cancer acquisition remain understudied. Leveraging on our whole-exome sequencing of the largest Asian lung adenocarcinoma (LUAD) cohort (n = 302), we now functionally assess the mechanistic role of a novel driver, PARP4.

Methods: In vitro and in vivo tumorigenicity assays were used to study the functional effects of PARP4 loss and mutation in multiple lung cancer cell lines. Interactomics analysis by quantitative mass spectrometry was conducted to identify PARP4's interaction partners. Transcriptomic data from cell lines and patient tumors were used to investigate splicing alterations.

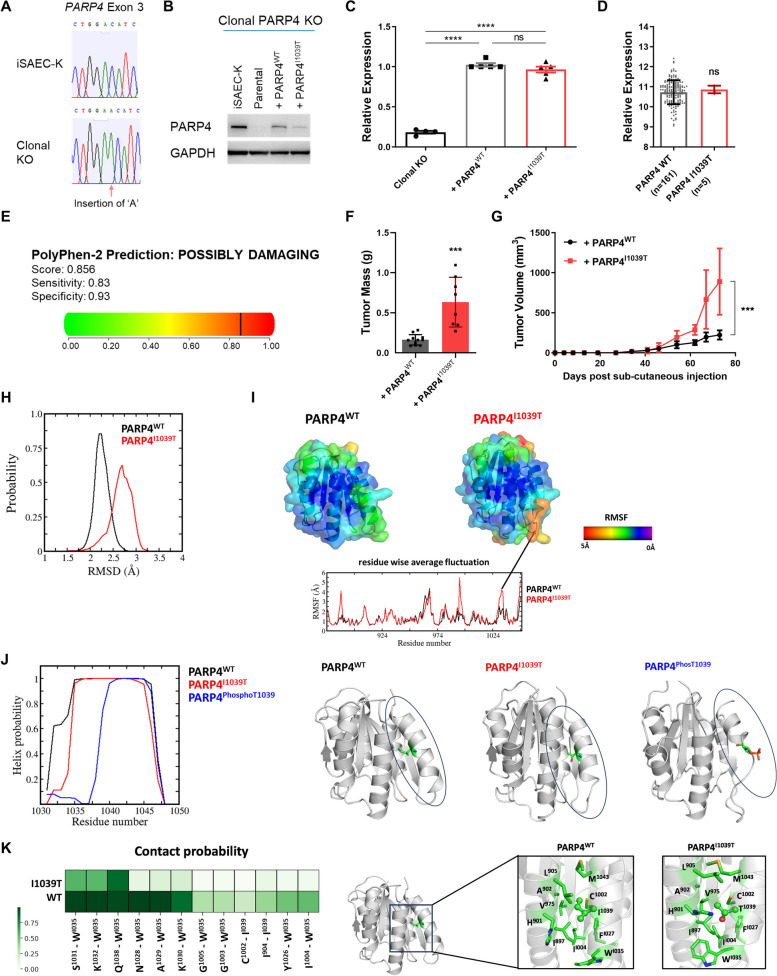
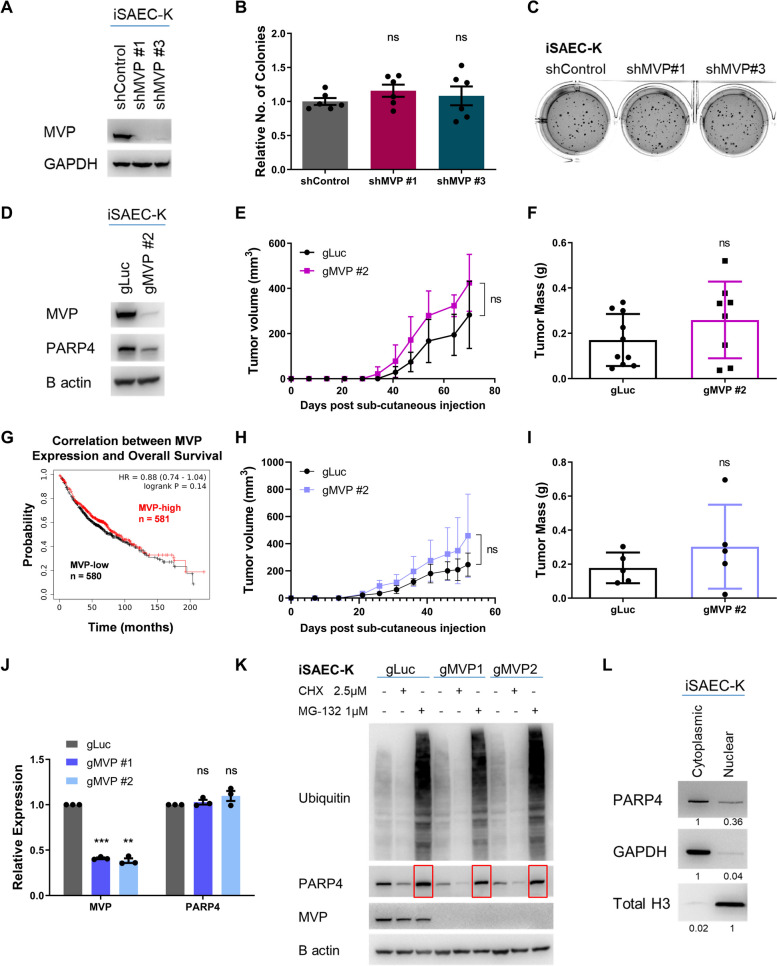
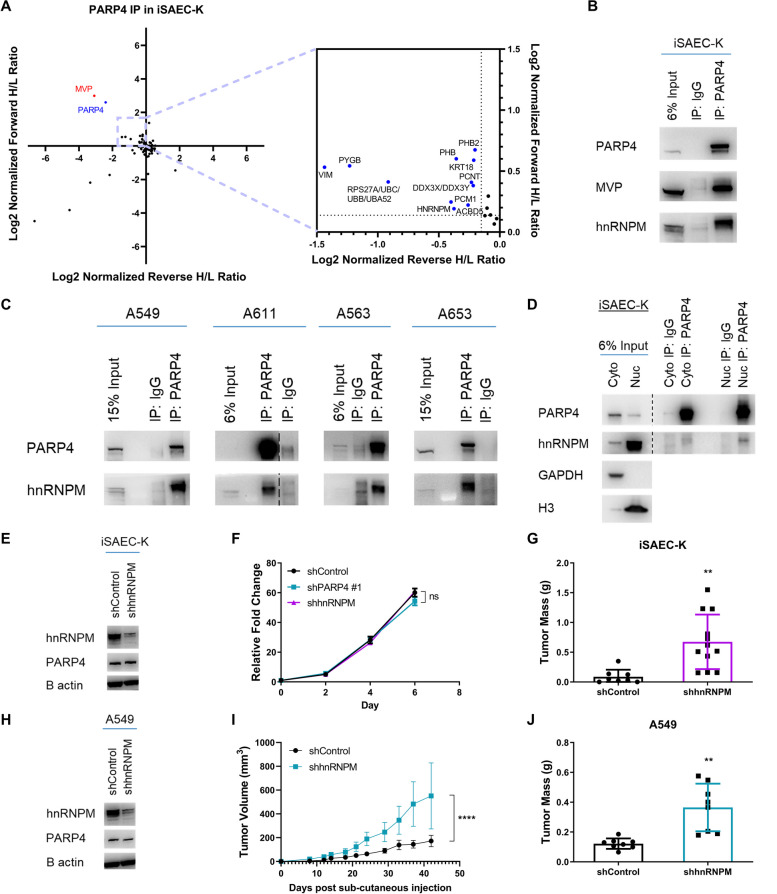
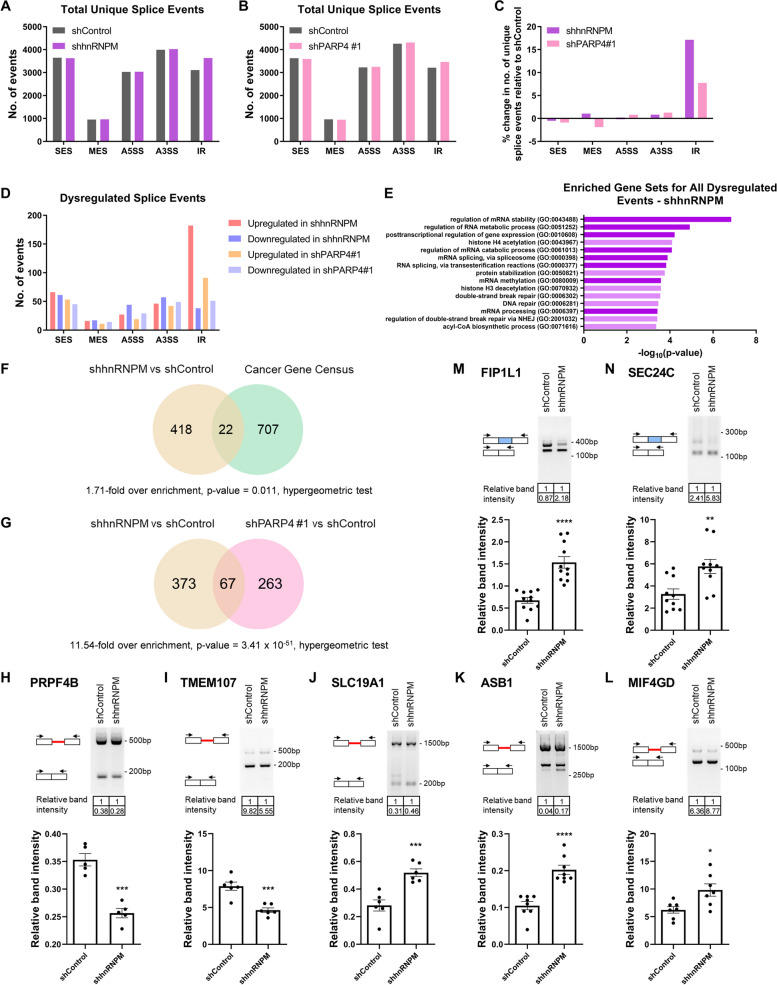
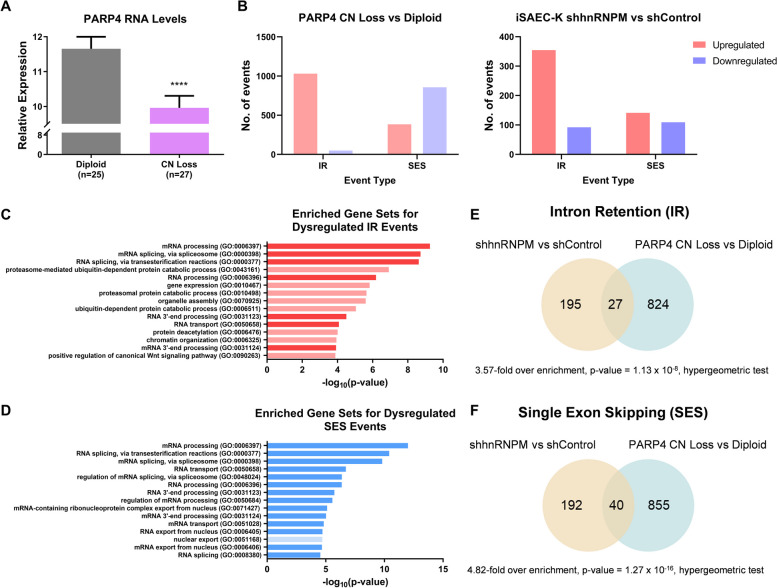
Results: PARP4 depletion or mutation (I1039T) promotes the tumorigenicity of KRAS- or EGFR-driven lung cancer cells. Disruption of the vault complex, with which PARP4 is commonly associated, did not alter tumorigenicity, indicating that PARP4's tumor suppressive activity is mediated independently. The splicing regulator hnRNPM is a potentially novel PARP4 interaction partner, the loss of which likewise promotes tumor formation. hnRNPM loss results in splicing perturbations, with a propensity for dysregulated intronic splicing that was similarly observed in PARP4 knockdown cells and in LUAD cohort patients with PARP4 copy number loss.

Conclusions: PARP4 is a novel modulator of lung adenocarcinoma, where its tumor suppressive activity is mediated not through the vault complex-unlike conventionally thought, but in association with its novel interaction partner hnRNPM, thus suggesting a role for splicing dysregulation in LUAD tumorigenesis.

Keywords: Functional genomics; Mechanisms of disease; Non-small-cell lung cancer.


Conflict of interest statement

The authors declare that they have no competing interests.

Figures

Fig. 1
Fig. 1
PARP4 is associated with tumor suppressive activity in LUAD. A Mutational frequency of driver genes identified from the Asian LUAD cohort [9]. B Distribution of non-silent PARP4 mutations from the Asian LUAD cohort. C Distribution of PARP4 copy number status within the Asian LUAD cohort. D PARP4 RNA expression z scores grouped by PARP4 copy number status in Asian LUAD patients. Boxes represent quartiles while whiskers extend to the 5th and 95th percentiles. E Kaplan–Meier plot generated using LUAD microarray data (n = 1161, Affymetrix ID 202239_at for PARP4) from the KM Plotter database, where data was aggregated from multiple cohorts across 12 GEO datasets [26, 27]. F Frequency of PARP4 diploid or copy number loss patients with a concurrent mutation in EGFR, KRAS or neither within the Asian LUAD cohort. G Immunoblot indicating reduction in expression of PARP4 upon shRNA knockdown in iSAEC-K cells. H Relative quantitation of soft agar colonies formed by iSAEC-K cells. Data represent the mean ± s.e.m., n ≥ 5. I Mass of tumors formed by iSAEC-K cells after 8 weeks. Data represent the mean ± s.d., n = 6. J PARP4 transcript levels in LUAD tumor (n = 1117) and normal tissues (n = 499). Boxes represent quartiles while whiskers extend to the 5th and 95th percentiles. Data were retrieved from the GENT2 database [28, 29]. K Immunoblot analysis of PARP4 expression in patient-derived lung cells. L Immunoblot analysis of PARP4 levels in a lung cell line panel, with KRAS and EGFR mutation status indicated [30]. M Immunoblot validation of PARP4 shRNA knockdown in PC-9 cells. N Immunoblot analysis of PARP4 expression following PARP4 pooled CRISPR knockout in A549 cells. O Relative quantitation of soft agar colonies formed by PC-9 cells. Data represent the mean ± s.e.m., n = 3. P Mass of tumors formed by A549 cells after 8 weeks. Data represent the mean ± s.d., n ≥ 4. Q Growth curve of tumors formed from A549 cells. Data represent the mean ± s.d., n ≥ 4
Fig. 2
Fig. 2
Recurrent I1039T mutation in PARP4 contributes to tumorigenicity. A Sanger sequencing chromatogram depicting frameshift mutation within PARP4 exon 3 in the PARP4 clonal KO iSAEC-K line. B Immunoblot analysis indicating lower PARP4 expression in clonal PARP4 KO cells overexpressing PARP4WT compared to iSAEC-K cells, and even lower PARP4 expression in clonal PARP4 KO cells overexpressing mutant PARP4I1039T. C RT-qPCR analysis of PARP4 transcript levels. Data represent the mean ± s.e.m., n ≥ 4. D Relative PARP4 expression in PARP4WT and PARP4I1039T patients from the Asian LUAD cohort. Data represent the mean ± s.d., n ≥ 5. E Results from PolyPhen-2 analysis of the I1039T mutation [31]. F Mass of tumors formed by PARP4 clonal KO cells expressing PARP4WT or PARP4I1039T after 8 weeks. Data represent the mean ± s.d., n ≥ 8. G Growth curve of tumors in F. H Distribution of root mean square deviation of conformations sampled during molecular dynamics (MD) simulations of PARP4-VWFAWT (black) and PARP4-VWFAI1039T (red) against the initial PARP4-VWFAWT model. I Residue-wise average root mean square fluctuation of all conformations sampled during the MD simulations of PARP4-VWFAWT and PARP4-VWFAI1039T mapped on to the corresponding structures. J Distribution of helical probability of residues from the alpha helix of PARP4-VWFA (left); MD snapshot of PARP4-VWFA with the I1039, T1039 and phosphorylated T1039 (PhosT1039) residues highlighted in stick representation (right). K Contact analysis highlighting the interactions between the residues from the alpha helix with surrounding residues in the PARP4-VWFA domain. A darker shade of green represents a higher contact probability (left); MD snapshot showing the orientation of residues surrounding residue 1039 in PARP4-VWFAWT and PARP4-VWFAI1039T. I1039 and T1039 are shown in ball-and-stick representation while remaining residues are shown in stick representation (right)
Fig. 3
Fig. 3
PARP4’s tumor suppressive activity is independent of the vault complex. A Immunoblot validation of MVP knockdown in iSAEC-K cells. B Relative quantitation of soft agar colonies. Data represent the mean ± s.e.m., n = 6. C Representative images of soft agar colonies stained by crystal violet. D Immunoblot validation of MVP depletion via pooled CRISPR knockout in iSAEC-K cells. E Growth curve of tumors formed from iSAEC-K cells. Data represent the mean ± s.d., n ≥ 8. F Mass of iSAEC-K tumors harvested after 9 weeks. Data represent the mean ± s.d., n ≥ 8. G Kaplan–Meier plot generated using LUAD microarray data (n = 1161, Affymetrix ID 202180_s_at for MVP) from the KM Plotter database, where data was aggregated from multiple cohorts across 12 GEO datasets [26, 27]. H Growth curve of tumors formed from A549 cells. Data represent the mean ± s.d., n = 5. I Mass of A549 tumors harvested after 7 weeks. Data represent the mean ± s.d., n = 5. J RT-qPCR analysis of MVP and PARP4 transcript levels in iSAEC-K gMVP #1 and gMVP #2 cells relative to gLuc. Data represent the mean ± s.e.m., n = 3. K Immunoblot analysis of PARP4 protein levels in control and MVP-depleted iSAEC-K cells at steady state, upon cycloheximide (CHX) inhibition of protein synthesis, or MG-132 inhibition of proteasomal degradation. Cells were treated with the indicated concentrations of CHX and MG-132 for 24 h. Red boxes indicate increased PARP4 protein following MG-132 treatment. L Immunoblot comparing PARP4 protein levels between the cytoplasmic and nuclear fraction of iSAEC-K cells. Equal amounts of total protein were used. GAPDH and total histone H3 were respectively used as cytoplasmic- and nuclear-specific markers. Band intensity was quantified relative to the cytoplasmic or nuclear fraction and indicated
Fig. 4
Fig. 4
hnRNPM is a potentially novel PARP4 binding partner with tumor suppressive activity in LUAD. A Log2 normalized forward and reverse SILAC Heavy/Light (H/L) ratios of proteins detected in the PARP4 SILAC co-IP mass spectrometry experiment. Candidate proteins with forward H/L ratio > 1.1 and reverse H/L ratio < 0.9 are found in the top left quadrant. The bait protein PARP4 is labeled in blue while PARP4’s known interaction partner MVP is labeled in red (left); enlarged plot area for better resolution of candidate proteins (right). B Immunoblot analysis following immunoprecipitation of PARP4 in iSAEC-K cells. C Immunoblot analysis following immunoprecipitation of PARP4 in the lung cell lines A549, A611, A563 and A653. D Immunoblot analysis following immunoprecipitation of PARP4 from the cytoplasmic (cyto) and nuclear (nuc) fractions of iSAEC-K cells. GAPDH was used as a cytoplasmic marker while total histone H3 was used as a nuclear marker. E Immunoblot analysis of hnRNPM and PARP4 levels in iSAEC-K shControl and shhnRNPM cells. F Proliferative capacity of iSAEC-K shControl, shPARP4 #1 and shhnRNPM cells as measured by the CellTiter-Glo assay. Data represent the mean ± s.e.m., n = 3. G Mass of tumors formed from iSAEC-K shControl or shhnRNPM cells after 10 weeks. Data represent the mean ± s.d., n ≥ 8. H Immunoblot analysis of hnRNPM and PARP4 levels in A549 shControl and shhnRNPM cells. I Growth curve of tumors formed from A549 shControl or shhnRNPM cells. Data represent the mean ± s.d., n = 8. J Mass of tumors in I
Fig. 5
Fig. 5
hnRNPM and PARP4 regulate splicing in the LUAD context. A, B Number of unique splice events with ≥ 5 supporting sequencing reads detected across the five event categories in A) iSAEC-K shControl and shhnRNPM cells and B) iSAEC-K shControl and shPARP4#1 cells. C Percentage change in number of unique splice events detected across the five event categories in iSAEC-K shhnRNPM (purple) or shPARP4#1 (pink) relative to shControl cells. D Number of significantly upregulated or downregulated splice events (|ΔPSI|> 10, p value < 0.05) upon hnRNPM or PARP4 loss across the five event categories. E Top 15 enriched GO Biological Process 2021 gene sets among genes with significantly dysregulated splicing upon hnRNPM knockdown (|ΔPSI|> 10, p value < 0.05). Gene sets related to RNA metabolism and splicing are highlighted with a darker shade. F Overlap between genes with splicing regulated by hnRNPM and cancer-related genes defined by COSMIC [58], with 1.71-fold over enrichment and p value = 0.011, as determined by hypergeometric test. G Overlap between genes with splicing regulated by hnRNPM and genes with splicing regulated by PARP4, with 11.54-fold over enrichment and p value = 3.41 × 10–51, as determined by hypergeometric test. H-N Representative gel electrophoresis images of targeted PCR validation of upregulated (H, I) and downregulated (J, K, L) IR events, as well as (M, N) upregulated SES events in iSAEC-K shControl and shhnRNPM samples. Band intensity was quantified, with that of the lower band normalized to that of the upper band, and indicated below the respective lanes. To the left of the respective bands, a schematic diagram indicates the splicing outcome. The red line represents the retained intron, the blue bar represents the alternatively skipped exon, while black arrows represent the PCR primers. The bar graph at the bottom summarizes the results from experimental replicates. Data represent the mean ± s.e.m., n ≥ 5
Fig. 6
Fig. 6
Dysregulation of splicing observed in Asian LUAD cohort cases with PARP4 copy number loss. A PARP4 RNA expression in PARP4 diploid versus PARP4 copy number loss cases stratified by PARP4 expression levels. Data represent the mean ± s.d. B Number of significantly upregulated and downregulated IR and SES events (|ΔPSI|> 5 and p value < 0.05) detected by rMATS analysis of stratified PARP4 copy number loss versus diploid patients [11] (left) or PSI-Sigma analysis of iSAEC-K shhnRNPM versus shControl cells [78] (right). C, D Top 15 enriched GO Biological Process 2021 gene sets among genes with significantly dysregulated C) IR or D) SES events in the PARP4 copy number loss versus PARP4 diploid splicing analysis (|ΔPSI|> 5, p value < 0.05). Gene sets related to RNA metabolism and splicing are highlighted with a darker shade. E, F Overlap in genes with significantly dysregulated (|ΔPSI|> 5, p value < 0.05) E) IR or F) SES identified from the iSAEC-K shhnRNPM versus shControl analysis and the PARP4 copy number loss versus diploid analysis, with E) 3.57-fold over enrichment and p value = 1.13 × 10–8, or F) 4.82-fold over enrichment and p value = 1.27 × 10–16, as determined by hypergeometric test

References

    1. Siegel RL, Miller KD, Jemal A. Cancer statistics, 2018. CA Cancer J Clin. 2018;68:7–30. 10.3322/caac.21442 - DOI - PubMed
    1. Herbst RS, Heymach JV, Lippman SM. Lung cancer. N Engl J Med. 2008;359:1367–80. 10.1056/NEJMra0802714 - DOI - PMC - PubMed
    1. Cainap C, Balacescu O, Cainap SS, Pop L-A. Next generation sequencing technology in lung cancer diagnosis. Biology. 2021;10:864. 10.3390/biology10090864 - DOI - PMC - PubMed
    1. Tan AC, Tan DSW. Targeted therapies for lung cancer patients with oncogenic driver molecular alterations. J Clin Oncol Off J Am Soc Clin Oncol. 2022;40:611–25.10.1200/JCO.21.01626 - DOI - PubMed
    1. Kohno T, Nakaoku T, Tsuta K, Tsuchihara K, Matsumoto S, Yoh K, et al. Beyond ALK-RET, ROS1 and other oncogene fusions in lung cancer. Transl Lung Cancer Res. 2015;4:156–64. - PMC - PubMed

Substances