Clinical Trial
. 2024 Jul 22;11(1):48.
doi: 10.1186/s40779-024-00550-7.

TGF-β1 mediates hypoxia-preconditioned olfactory mucosa mesenchymal stem cells improved neural functional recovery in Parkinson's disease models and patients

Affiliations
Clinical Trial

TGF-β1 mediates hypoxia-preconditioned olfactory mucosa mesenchymal stem cells improved neural functional recovery in Parkinson's disease models and patients

Yi Zhuo et al. Mil Med Res. .

Abstract

Background: Parkinson's disease (PD) is a neurodegenerative disorder characterized by the degeneration of dopaminergic neurons in the substantia nigra (SN). Activation of the neuroinflammatory response has a pivotal role in PD. Mesenchymal stem cells (MSCs) have emerged as a promising therapeutic approach for various nerve injuries, but there are limited reports on their use in PD and the underlying mechanisms remain unclear.

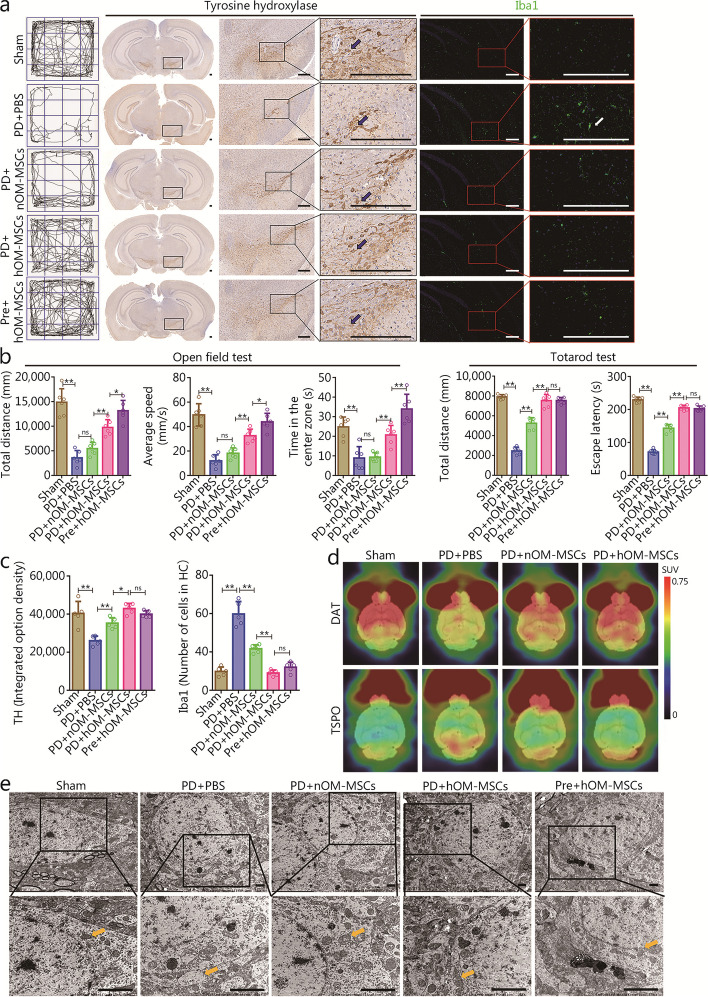
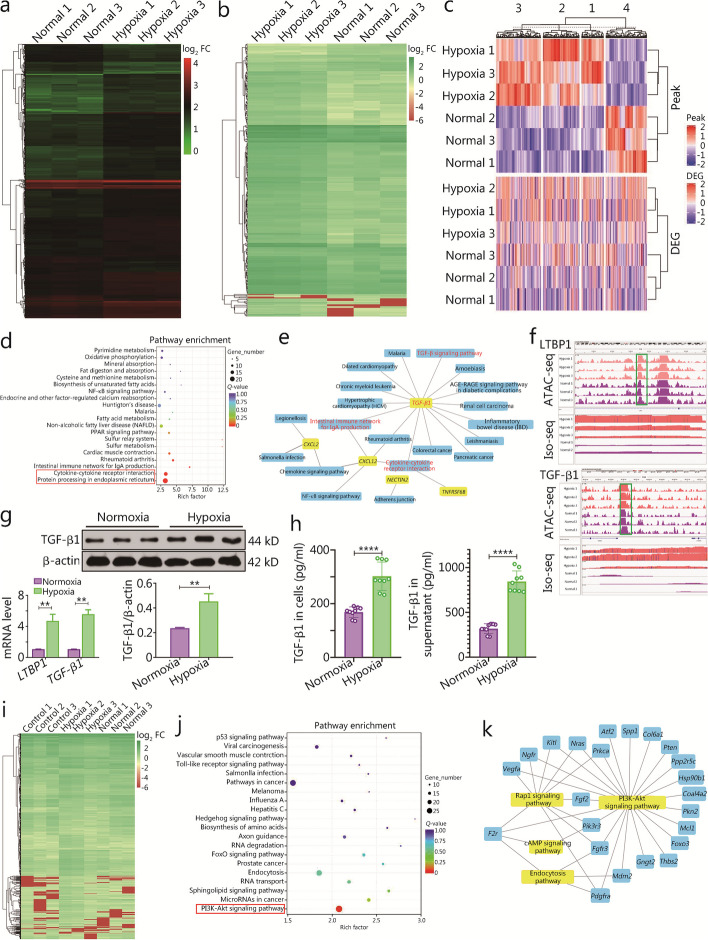
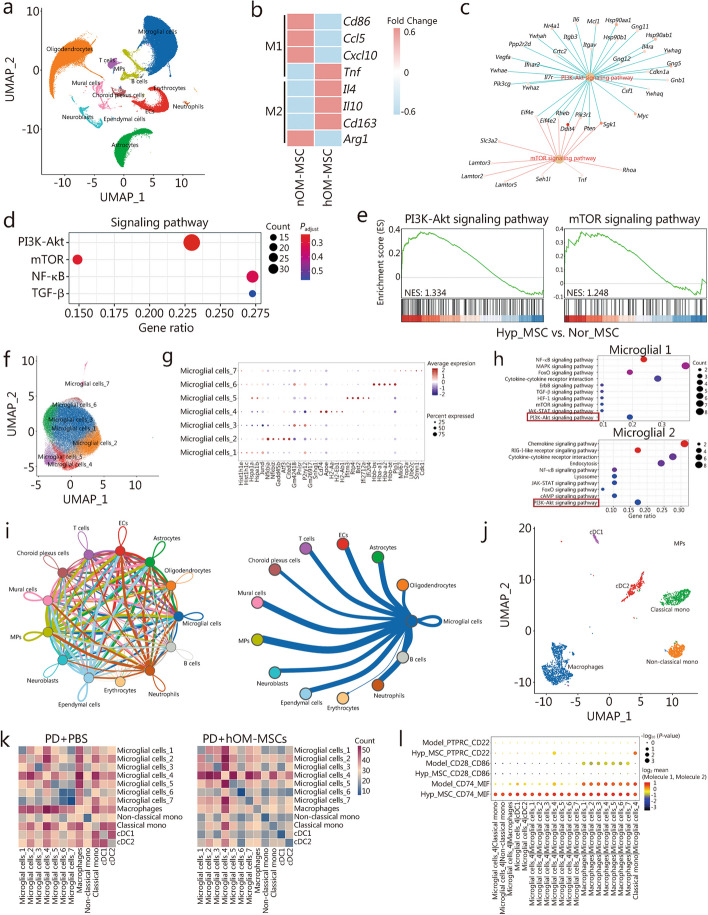
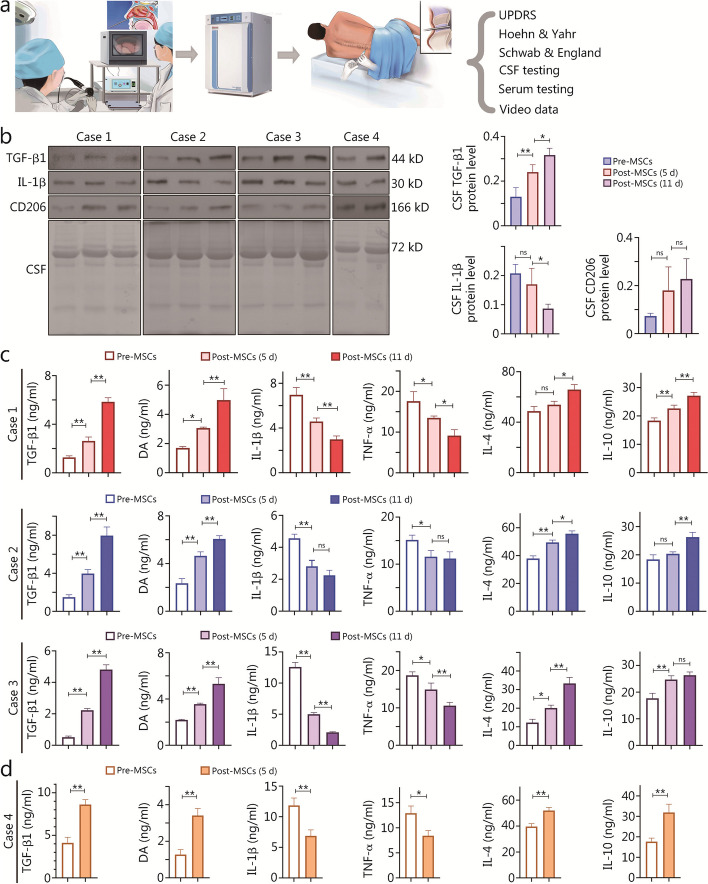
Methods: We investigated the effects of clinical-grade hypoxia-preconditioned olfactory mucosa (hOM)-MSCs on neural functional recovery in both PD models and patients, as well as the preventive effects on mouse models of PD. To assess improvement in neuroinflammatory response and neural functional recovery induced by hOM-MSCs exposure, we employed single-cell RNA sequencing (scRNA-seq), assay for transposase accessible chromatin with high-throughput sequencing (ATAC-seq) combined with full-length transcriptome isoform-sequencing (ISO-seq), and functional assay. Furthermore, we present the findings from an initial cohort of patients enrolled in a phase I first-in-human clinical trial evaluating the safety and efficacy of intraspinal transplantation of hOM-MSC transplantation into severe PD patients.

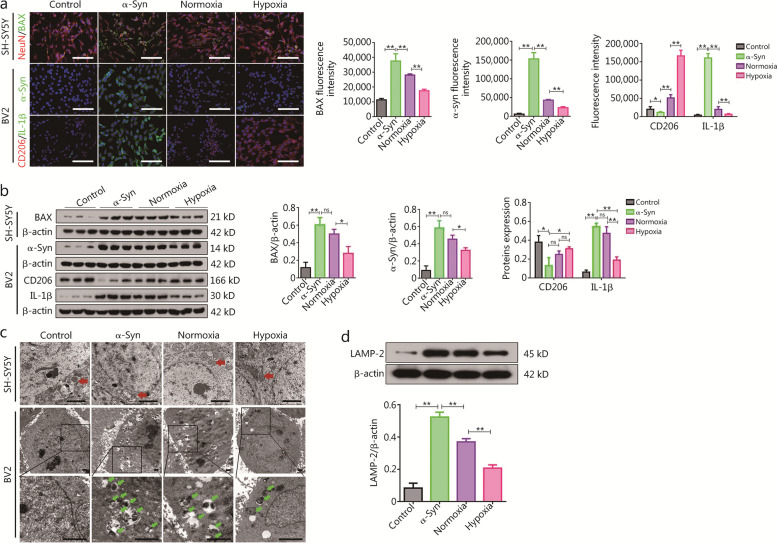
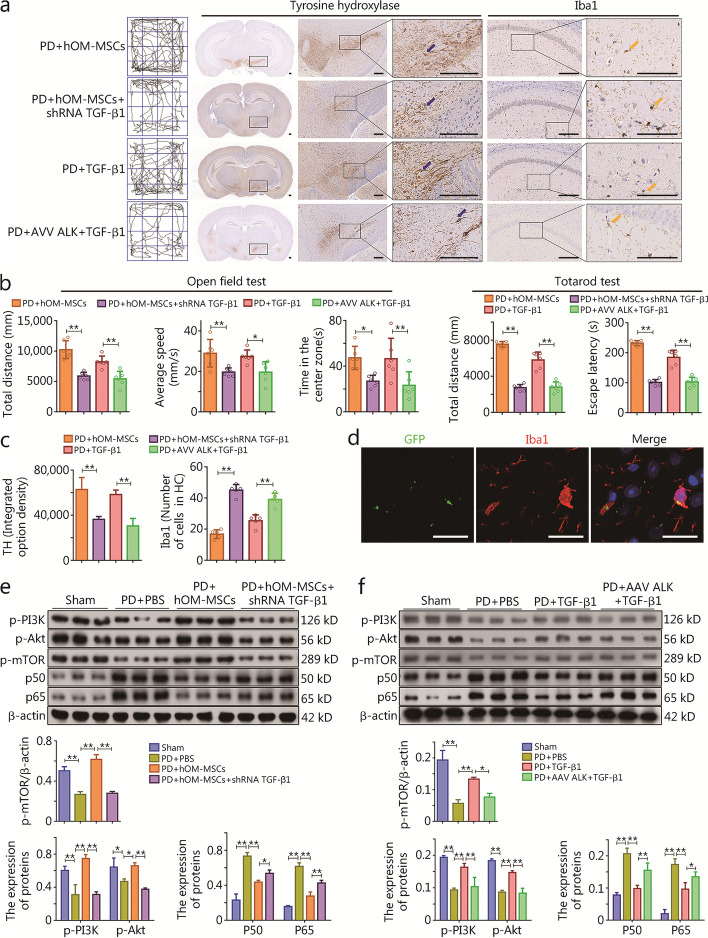
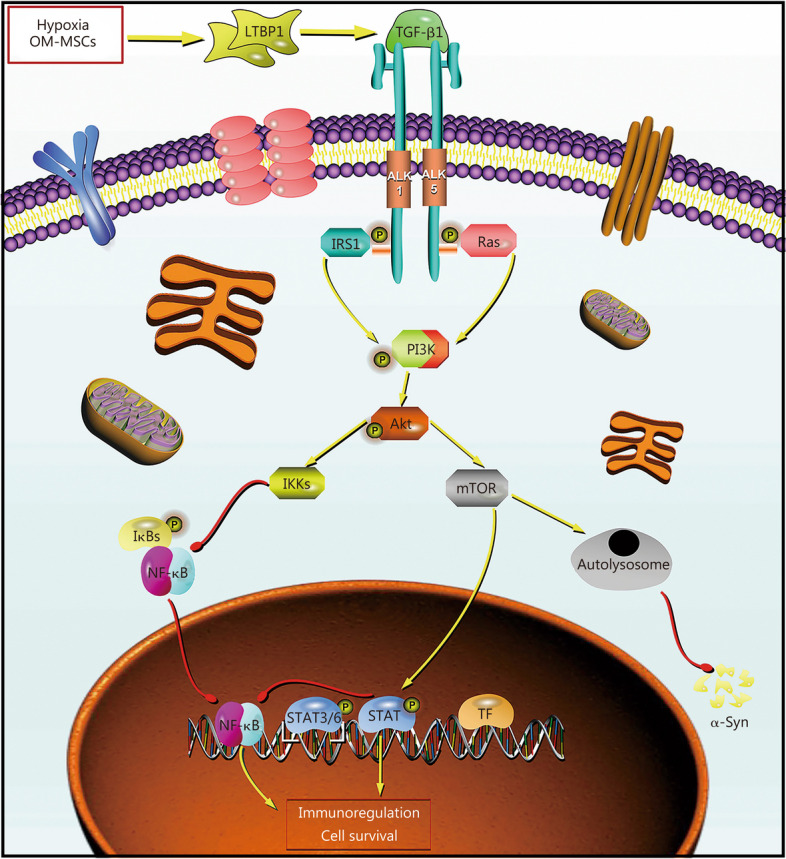
Results: A functional assay identified that transforming growth factor-β1 (TGF-β1), secreted from hOM-MSCs, played a critical role in modulating mitochondrial function recovery in dopaminergic neurons. This effect was achieved through improving microglia immune regulation and autophagy homeostasis in the SN, which are closely associated with neuroinflammatory responses. Mechanistically, exposure to hOM-MSCs led to an improvement in neuroinflammation and neural function recovery partially mediated by TGF-β1 via activation of the anaplastic lymphoma kinase/phosphatidylinositol-3-kinase/protein kinase B (ALK/PI3K/Akt) signaling pathway in microglia located in the SN of PD patients. Furthermore, intraspinal transplantation of hOM-MSCs improved the recovery of neurologic function and regulated the neuroinflammatory response without any adverse reactions observed in patients with PD.

Conclusions: These findings provide compelling evidence for the involvement of TGF-β1 in mediating the beneficial effects of hOM-MSCs on neural functional recovery in PD. Treatment and prevention of hOM-MSCs could be a promising and effective neuroprotective strategy for PD. Additionally, TGF-β1 may be used alone or combined with hOM-MSCs therapy for treating PD.

Keywords: Autophagy; Hypoxia-preconditioned; Immune regulation; Microglia; Olfactory mucosa mesenchymal stem cells (OM-MSCs); PI3K/Akt signaling pathway; Parkinson’s disease (PD); Transforming growth factor-β1 (TGF-β1).


Conflict of interest statement

The authors declare that they have no competing interests.

Figures

Fig. 1
Fig. 1
The hOM-MSCs enhanced mitochondrial function in neurons and the immunomodulation of microglia in the PD cell model. a Exemplary immunofluorescence micrograph showing nuclei (DAPI, blue), NeuN, and BAX expression in SH-SY5Y cells, and nuclei (DAPI, blue), α-Syn, CD206, and IL-1β expression in BV2 cells (scale bars = 40 μm). b Western blotting measuring BAX protein expression in SH-SY5Y cells, and α-Syn (α-synuclein), IL-1β, and CD206 protein expression in BV2 cells. c TEM showing the mitochondria morphology and ultrastructure (red arrow) in SH-SY5Y cells, and the formation of autophagosomes (green arrow) in BV2 cells (scale bars = 2 μm). d Western blotting measuring LAMP-2 protein expression in BV2 cells. Data are represented as mean ± SEM. *P < 0.05, **P < 0.01, ns non-significant. NeuN neuron-specific nuclear protein, DAPI 4’,6-diamidino-2-phenylindole, IL-1β interleukin-1β, LAMP-2 lysosome-associated membrane protein-2, hOM-MSCs hypoxia-olfactory mucosa mesenchymal stem cells, PD Parkinson’s disease, CD recombinant cluster of differentiation
Fig. 2
Fig. 2
The hOM-MSCs facilitated the recovery of nerve function and the immunomodulation of microglia in the PD mouse model. a The neurologic function score of the open field test shows the activity trace of PD mice (left). The slide scanning technique shows TH+ cells (black arrow) immunohistochemical micrograph (medium), and shows Iba1+ cells (white arrow) immunofluorescence micrograph in the SN of PD mice (right) (scale bars = 200 μm). b The neurologic function score of the open field test shows the histogram of total distance, average speed, and central time, and the Tatarod test shows the histogram of total distance and escape latency (n = 6). c The histogram showing TH+ cell expression and the number of Iba1+ cells in (a). d CFT-PET brain imaging showing the distribution of DAT in brain tissue, and [18F]F-DPA brain imaging showing the distribution of activated microglia mitochondrial outer membrane TSPO in brain tissue. e TEM showing the mitochondria morphology and ultrastructure (yellow arrow) of neurons in the SN of PD mice (scale bars = 2 μm). Data are represented as mean ± SEM. *P < 0.05, **P < 0.01, ns non-significant. TH tyrosine hydroxylase, hOM-MSCs hypoxia-olfactory mucosa mesenchymal stem cells, SN substantia nigra, SUV standard uptake value, PD Parkinson’s disease, CFT 2-β-carbomethoxy-3β-(4-fluorophenyl)-(N-11C-methyl) tropan, PET positron emission tomography, DAT dopamine transporter, [18F]F-DPA N,N-diethyl-2-(2-(4-([18F]fluoro)phenyl)-5,7-dimethylpyrazolo[1,5-a]pyrimidin-3-yl)acetamide, TSPO transporter protein, TEM transmission electron microscope, PBS phosphate buffer saline
Fig. 3
Fig. 3
ATAC-seq combined with ISO-seq to elucidate the underlying mechanisms of hOM-MSCs in PD cell model. a Enrichment heatmap of ATAC-seq differential peak before and after hypoxic pretreatment of OM-MSCs. Each row is a differential peak, and each column is a sample. b Differential gene enrichment heatmap before and after hypoxic pretreatment of OM-MSCs. The horizontal coordinate represents the sample name and sample clustering results, and the vertical coordinate represents the differential genes and gene clustering results. c The intersection differential genes of ATAC-seq and ISO-seq are jointly displayed by clustering heatmap to visually display the dual changes of chromatin accessibility and expression level of genes. d Annotation results of DEGs were classified according to KEGG pathway types before and after hypoxic pretreatment of OM-MSCs. e The network relationships of the top 20 signaling pathways enriched by KEGG and their corresponding genes were mapped. f IGV visualized LTBP1 and TGF-β1 in the results of combined analysis of ATAC-seq and ISO-seq before and after hypoxic pretreatment of OM-MSCs. g RT-qPCR and Western blotting measuring the expression of LTBP1 and TGF-β1 mRNA and protein in OM-MSCs before and after hypoxia pretreatment. h ELISA showing a histogram of the concentration of TGF-β1 in OM-MSCs cells and supernatant both before and after hypoxia pretreatment. i Hierarchical cluster analysis was performed on the DEGs screened from microglia of the PD cell model, and the genes with the same or similar expression patterns were drawn into clustering heat maps. j Annotation results of DEGs were classified according to KEGG pathway types in microglia of the PD cell model after hOM-MSCs intervention. k The network relationships of the top 4 signaling pathways enriched by KEGG and their corresponding genes were mapped in the microglia of the PD cell model after hOM-MSCs intervention. **P < 0.01, ****P < 0.0001. OM-MSCs olfactory mucosa mesenchymal stem cells, hOM-MSCs hypoxia-olfactory mucosa mesenchymal stem cells, KEGG Kyoto Encyclopedia of Genes and Genomes, TGF-β1 transforming growth factor-β1, LTBP1 latent transforming growth factor beta binding protein 1, DEGs differentially expressed genes, IGV integrative genomics viewer, ATAC-seq assay for transposase-accessible chromatin with high-throughput sequencing, ISO-seq isoform-sequencing, PD Parkinson’s disease, FC fold change, NF-κB nuclear factor kappa-B, PPAR peroxisome proliferator-activated receptor, FoxO forkhead box O
Fig. 4
Fig. 4
scRNA-seq to elucidate the underlying mechanisms of hOM-MSCs in PD mice model. a UMAP of integrated transcriptomes in all groups samples of SN showing cell-type assignment, including microglia cells, oligodendrocytes, astrocytes, ECs, MPs, neuroblasts, mural cells, choroid plexus cells, T cells, B cells, ependymal cells, erythrocytes, and neutrophils. b Heatmap showing microglial M1 markers and M2 markers between nOM-MSCs treatment and hOM-MSCs treatment in the SN of PD mice. c GSEA showing the two significantly enriched pathways and the corresponding genes in the enrichment bubble map. d Gene network analysis revealed significant enrichment and interaction of PI3K-Akt/mTOR signaling pathway in microglia. e Line plots of enrichment score showed upregulation of PI3K-Akt/mTOR signaling pathway in microglia. f UMAP of integrated transcriptomes in all groups of microglia showing cell-type assignment, and ultimately segregated the microglia into seven distinct subgroups. g Dotplot showing the genes expressed in > 10% of microglia in a cluster as DEGs. h KEGG pathway dotplot showing the enrichment and up-regulation signaling pathway in microglial cells_2 and _4 in the SN of PD mice after hOM-MSCs treatment. i The cell types net graph shows the interactions between various cell populations and pinpointed the interaction between microglia and MPs as the most significant. j UMAP of integrated transcriptomes in all groups of MPs showing cell-type assignment, including macrophages, non-classic and classic mononuclear cells, cDC1, and cDC2. k Heatmap showing the cell–cell interaction analysis based on known receptor-ligand interactions between all subtypes of microglia and MPs in the SN of PD mice after hOM-MSCs treatment. l Dot graph showing the cell–cell interaction differences among the three pairs of receptor-ligands were the most significant. PI3K phosphoinositide 3-kinase, Akt protein kinase B, MPs mononuclear phagocytes, ECs endothelial cells, TGF-β transforming growth factor-β, mTOR mammalian target of rapamycin, hOM-MSCs hypoxia-olfactory mucosa mesenchymal stem cells, nOM-MSCs normoxia-olfactory mucosa mesenchymal stem cells, PD Parkinson’s disease, UMAP uniform manifold approximation and projection, SN substantia nigra, GSEA Gene Set Enrichment Analysis, KEGG Kyoto Encyclopedia of Genes and Genomes, NES normalized enrichment score, MAPK mitogen-activated protein kinase, FoxO forkhead box O, ErbB receptor tyrosine kinases, HIF-1 hypoxia inducible factor-1, JAK janus tyrosine kinase, STAT signal transducer and activator of transcription, mono mononuclear
Fig. 5
Fig. 5
TGF-β1 mediates hOM-MSC to enhance neuroprotective function by activating the PI3K-Akt signaling pathway in microglia in vitro. a Western blotting measuring TGF-β1 protein expression in hOM-MSCs, and ALK protein expression in BV2 cells. b Exemplary immunofluorescence micrograph showing nuclei (DAPI), NeuN, and BAX expression in SH-SY5Y cells (Scale bars = 40 μm). c Western blotting measuring BAX protein expression in SH-SY5Y cells, and α-Syn, IL-1β, CD206, and LC3B protein expression in BV2 cells. d The histogram showing the BAX fluorescence expression in (b), and BAX, α-Syn, IL-1β, CD206, and LC3B protein expression in (c). e, f Western blotting measuring p-PI3K, p-Akt, p-mTOR, p50, p65, and LC3B protein expression in BV2 cells. Data are represented as mean ± SEM. *P < 0.05, **P < 0.01, ns non-significant. hOM-MSCs hypoxia-olfactory mucosa mesenchymal stem cells, TGF-β1 transforming growth factor-β1, ALK anaplastic lymphoma kinase, NeuN neuron-specific nuclear protein, DAPI 4’,6-diamidino-2-phenylindole, α-Syn α-synuclein, IL-1β interleukin-1β, PI3K phosphoinositide 3-kinase, Akt protein kinase B, mTOR mammalian target of rapamycin
Fig. 6
Fig. 6
TGF-β1 mediates hOM-MSC to facilitate the recovery of nerve function by activating the PI3K-Akt signaling pathway in microglia in vivo. a The neurologic function score of open field test showing the activity trace of PD mice (left). The slide scanning technique shows TH+ cells immunohistochemical micrograph (medium) and shows Iba1+ cells immunohistochemical micrograph in the SN of PD mice (right) (scale bars = 200 μm). b The neurologic function score of the open field test shows the histogram of total distance, average speed, and central time (n = 6), and the Tatarod test shows the histogram of total distance and escape latency (n = 6). c The histogram showing TH+ cell expression and the number of Iba1+ cells in (a). d Exemplary immunofluorescence micrograph showing nuclei (DAPI), AAV ALK-GFP, and Iba1 co-localization expression in microglia of SN in PD mice (scale bars = 20 μm). e, f Western blotting measuring p-PI3K, p-Akt, p-mTOR, p50, and p65 protein expression in SN of PD mice. Data are represented as mean ± SEM. *P < 0.05, **P < 0.01. TH tyrosine hydroxylase, GFP green fluorescent protein, PI3K Phosphoinositide 3-kinase, Akt protein kinase B, mTOR mammalian target of rapamycin, hOM-MSCs hypoxia-olfactory mucosa mesenchymal stem cells, PD Parkinson’s disease, TGF-β1 transforming growth factor-β1, ALK anaplastic lymphoma kinase, AAV adeno-associated virus
Fig. 7
Fig. 7
Graphical mechanism showing the secretion of TGF-β1 by hOM-MSCs further activates the PI3K-Akt signaling pathway through interaction with microglial cell membrane ALK receptors, thereby regulating the immune response and maintaining autophagy homeostasis. OM-MSCs olfactory mucosa mesenchymal stem cells, LTBP1 latent transforming growth factor beta binding protein 1, TGF-β1 transforming growth factor-β1, ALK anaplastic lymphoma kinase, IRS1 insulin receptor substrate 1, Ras rat sarcoma, PI3K Phosphoinositide 3-kinase, Akt Protein protein kinase B, mTOR mammalian target of rapamycin, IKKs The IκB kinase, IκBs inhibitory κB, NF-κB nuclear factor kappa-B, STAT signal transducer and activator of transcription, TF transcription factor
Fig. 8
Fig. 8
Phase I hOM-MSC implantation clinical trial for PD patients. a The strategy for hOM-MSCs transplants in PD patients. The process is divided into the collection of patient nasal mucosa, cultivation of olfactory mucosa mesenchymal stem cells, lumbar puncture transplantation of cells, and evaluation of patients and collected specimens. b Western blotting measuring TGF-β1, IL-1β, and CD206 protein expression in CSF of PD patients. c ELISA showing histogram of TGF-β1, DA, IL-1β, TNF-α, IL-4, and IL-10 protein concentration in CSF of case 1/2/3 before hOM-MSCs transplantation as well as 5 and 11 d after transplantation. d ELISA showing a histogram of TGF-β1, DA, IL-1β, TNF-α, IL-4, and IL-10 protein concentration in CSF of case 4 before hOM-MSCs transplantation and 5 d after transplantation. Data are represented as mean ± SEM. *P < 0.05, **P < 0.01, ns non-significant. UPDRS unified Parkinson’s disease rating scale, CSF cerebrospinal fluid, TGF-β1 transforming growth factor-β1, IL-1β interleukin-1β, DA dopamine, TNF-α tumor necrosis factor-α, IL-4 interleukin-4, IL-10 interleukin-10, Pre-MSCs previous treatment olfactory mucosa mesenchymal stem cells, Post-MSCs post-treatment olfactory mucosa mesenchymal stem cells

References

    1. Sommer A, Marxreiter F, Krach F, Fadler T, Grosch J, Maroni M, et al. Th17 lymphocytes induce neuronal cell death in a human iPSC-based model of Parkinson’s disease. Cell Stem Cell. 2018;23(1):123–31. 10.1016/j.stem.2018.06.015 - DOI - PubMed
    1. Weintraub D, Aarsland D, Chaudhuri KR, Dobkin RD, Leentjens AF, Rodriguez-Violante M, et al. The neuropsychiatry of Parkinson’s disease: advances and challenges. Lancet Neurol. 2022;21(1):89–102. 10.1016/S1474-4422(21)00330-6 - DOI - PMC - PubMed
    1. Olanow CW, Factor SA, Espay AJ, Hauser RA, Shill HA, Isaacson S, et al. Apomorphine sublingual film for off episodes in Parkinson’s disease: a randomised, double-blind, placebo-controlled phase 3 study. Lancet Neurol. 2020;19(2):135–44. 10.1016/S1474-4422(19)30396-5 - DOI - PubMed
    1. Shahnawaz M, Mukherjee A, Pritzkow S, Mendez N, Rabadia P, Liu X, et al. Discriminating α-synuclein strains in Parkinson’s disease and multiple system atrophy. Nature. 2020;578(7794):273–7. 10.1038/s41586-020-1984-7 - DOI - PMC - PubMed
    1. Gallea JI, Ambroggio EE, Vilcaes AA, James NG, Jameson DM, Celej MS. Amyloid oligomerization of the Parkinson’s disease related protein α-synuclein impacts on its curvature-membrane sensitivity. J Neurochem. 2018;147(4):541–56. 10.1111/jnc.14573 - DOI - PubMed

Publication types

Substances

LinkOut - more resources