. 2024 Jul 21;21(1):178.
doi: 10.1186/s12974-024-03171-y.

PEDF-34 attenuates neurological deficit and suppresses astrocyte-dependent neuroinflammation by modulating astrocyte polarization via 67LR/JNK/STAT1 signaling pathway after subarachnoid hemorrhage in rats

Affiliations

PEDF-34 attenuates neurological deficit and suppresses astrocyte-dependent neuroinflammation by modulating astrocyte polarization via 67LR/JNK/STAT1 signaling pathway after subarachnoid hemorrhage in rats

Lei Wu et al. J Neuroinflammation. .

Abstract

Background: Reactive astrocytes participate in various pathophysiology after subarachnoid hemorrhage (SAH), including neuroinflammation, glymphatic-lymphatic system dysfunction, brain edema, BBB disruption, and cell death. Astrocytes transform into two new reactive phenotypes with changed morphology, altered gene expression, and secretion profiles, termed detrimental A1 and beneficial A2. This study investigates the effect of 67LR activation by PEDF-34, a PEDF peptide, on neuroinflammation and astrocyte polarization after the experimental SAH.

Methods: A total of 318 male adult Sprague-Dawley rats were used in experiments in vivo, of which 272 rats were subjected to the endovascular perforation model of SAH and 46 rats underwent sham surgery. 67LR agonist (PEDF-34) was administrated intranasally 1 h after SAH. 67LR-specific inhibitor (NSC-47924) and STAT1 transcriptional activator (2-NP) were injected intracerebroventricularly 48 h before SAH. Short- and long-term neurological tests, brain water content, immunostaining, Nissl staining, western blot, and ELISA assay were performed. In experiments in vitro, primary astrocyte culture with hemoglobin (Hb) stimulation was used to mimic SAH. The expression of the PEDF-34/67LR signaling pathway and neuro-inflammatory cytokines were assessed using Western blot, ELISA, and immunohistochemistry assays both in vivo and in vitro.

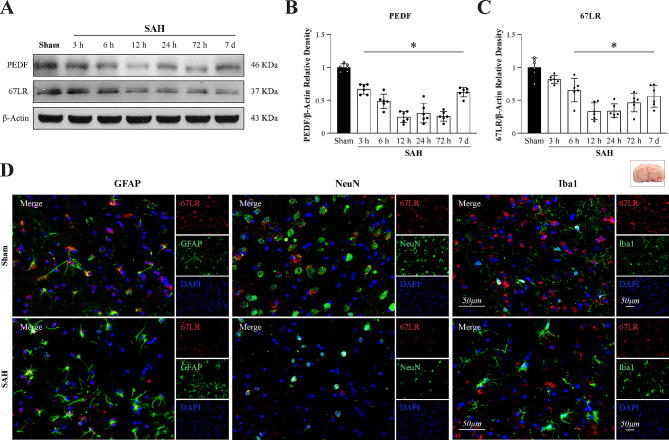
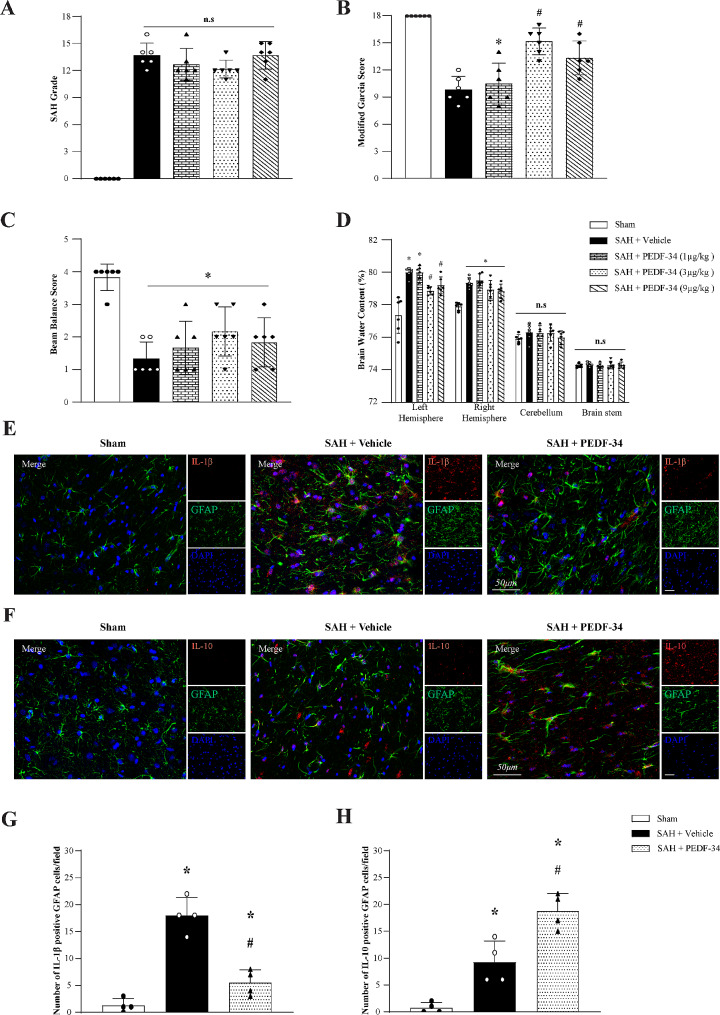
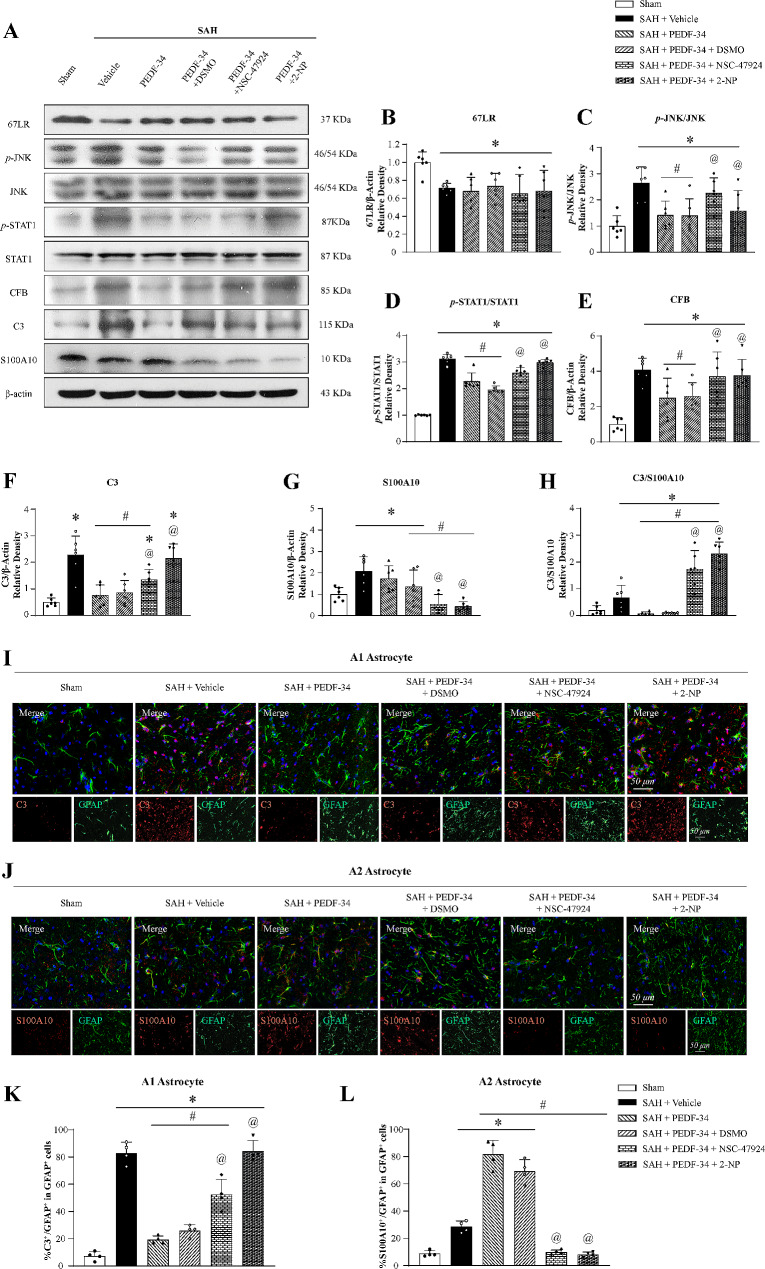
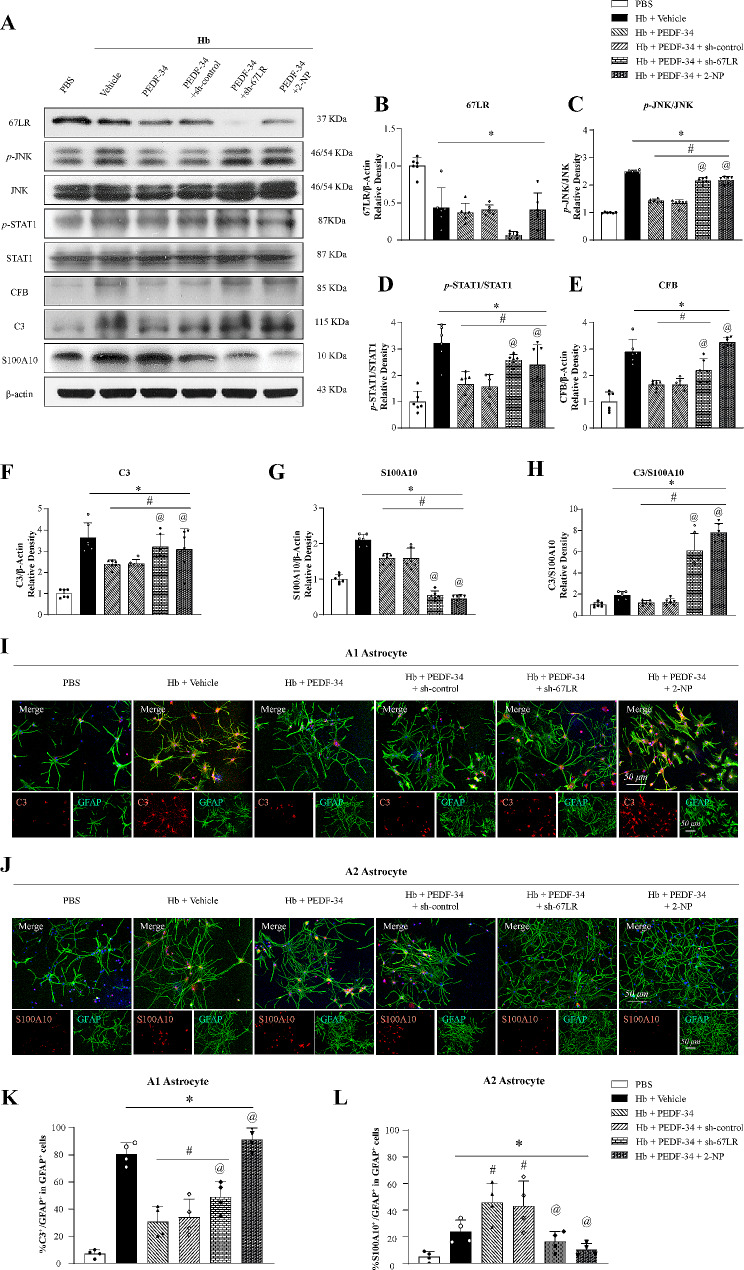
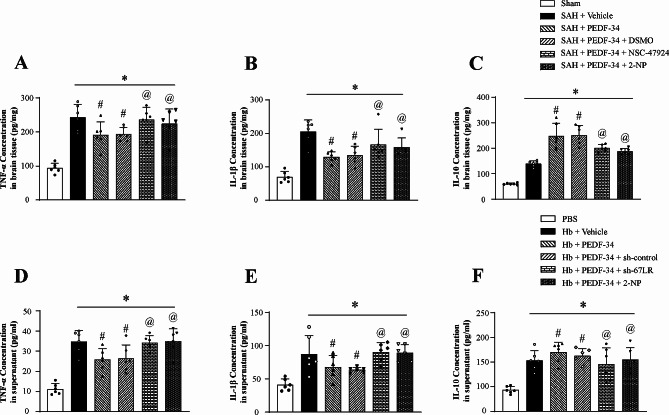
Results: Endogenous PEDF and 67LR expressions were significantly reduced at 6 h after SAH. 67LR was expressed in astrocytes and neurons. Intranasal administration of PEDF-34 significantly reduced brain water content, pro-inflammatory cytokines, and short-term and long-term neurological deficits after SAH. The ratio of p-JNK/JNK and p-STAT1/STAT1 and the expression of CFB and C3 (A1 astrocytes marker), significantly decreased after PEDF-34 treatment, along with fewer expression of TNF-α and IL-1β at 24 h after SAH. However, 2-NP (STAT1 transcriptional activator) and NSC-47924 (67LR inhibitor) reversed the protective effects of PEDF-34 in vivo and in vitro by promoting A1 astrocyte polarization with increased inflammatory cytokines.

Conclusion: PEDF-34 activated 67LR, attenuating neuroinflammation and inhibiting astrocyte A1 polarization partly via the JNK/STAT1 pathway, suggesting that PEDF-34 might be a potential treatment for SAH patients.

Keywords: Astrocyte polarization; Neuroinflammation; Non-integrin 67-kDa laminin receptor; Pigment epithelial-derived factor; Subarachnoid hemorrhage.


Conflict of interest statement

The authors declare no competing interests.

Figures

Fig. 1
Fig. 1
Time course of endogenous PEDF and 67LR expressions and cellular location of 67LR in the brain after SAH. (a-c) Representative western blot images and quantitative analyses of endogenous PEDF, 67LR expression at 3 h, 6 h, 12 h, 24 h, 72 h, and 7 d after SAH. *p < 0.05 vs. Sham, n = 6 /group. (d) Representative microphotographs of immunofluorescence staining showing the colocalization of 67LR (red) with astrocyte (GFAP, green, left), neuron (NeuN, green, middle), or microglia (Iba1, green, right) in sham and SAH rats at 24 h after SAH. A small red box in the brain block indicated where the microphotographs were taken. Scale bar = 50 μm. n = 4/group
Fig. 2
Fig. 2
The effects of PEDF-34 on short-term outcomes at 24 h after SAH. (a) SAH grading scores. (b-c) Modified Garcia and beam balance test. *p < 0.05 vs. Sham; #p < 0.05 vs. SAH + Vehicle. (d) Quantitative analysis of brain water content in the left/right hemisphere, cerebellum, and brain stem. n = 6 /group. *p < 0.05 vs. Sham; #p < 0.05 vs. SAH + Vehicle. (e) Representative microphotographs of IL-1β (red) and GFAP (green) immunofluorescence staining in the ipsilateral basal cortex. Nuclei were stained with DAPI (blue). Scale bar = 50 μm. (f) Representative immunofluorescence images of IL-10 (red) and GFAP (green) expression in the ipsilateral basal cortex of different groups. Scale bar = 50 μm. (g) Quantitative analysis of IL-1β-positive astrocytes. (h) Quantitative analysis of IL-10-positive astrocytes. n = 4 /group. *p < 0.05 vs. Sham; #p < 0.05 vs. SAH + Vehicle
Fig. 3
Fig. 3
PEDF-34 reduced neuronal loss in the hippocampus and improved long-term neurological function after SAH. (a, b) The falling latency of rotarod test at 1 week, 2 weeks and 3 weeks after SAH. (c) Swimming distance of Morris water maze test on days 23 to 27 after SAH. (d) Quantification of swimming velocities. (e-f) Representative thermal images of the probe trials and probe quadrant duration. n = 10/group, *p < 0.05 vs. Sham; #p < 0.05 vs. SAH + Vehicle. (g-h) Representative microphotographs of Nissl staining in CA1, CA3, and DG hippocampal regions. Scale bar = 100 μm. Small red squares indicated the area for high magnification and quantification. (i) Quantitative analysis of surviving neuron number in different hippocampal regions. n = 10/group. *p < 0.05 vs. Sham; #p < 0.05 vs. SAH + Vehicle
Fig. 4
Fig. 4
PEDF-34 promotes A2 astrocyte polarization via 67LR/JNK/STAT1 signaling pathway after SAH. (a) Representative western blotting bands. (b-h) quantitively analysis of 67LR, p-JNK/JNK, p-STAT1/STAT1, CFB, C3, S100A10 expression. n = 6/ group. *p < 0.05 vs. Sham; #p < 0.05 vs. SAH + Vehicle, @p < 0.05 vs. SAH + PEDF-34 or SAH + PEDF-34 + DMSO. (i) Representative microphotographs of C3 (A1 Astrocyte marker, red) and GFAP (green) by immunofluorescent staining. Scale bar = 50 μm. (k) Quantification of C3-positive A1 astrocytes. n = 4/group. *p < 0.05 vs. Sham; #p < 0.05 vs. SAH + Vehicle, @p < 0.05 vs. SAH + PEDF-34 or SAH + PEDF-34 + DMSO. (j) Representative microphotographs of S100A10 (A2 Astrocyte marker, red) and GFAP (green) immunofluorescence staining. Scale bar = 50 μm. (l) Quantification of S100A10-positive A2 astrocytes. n = 4/group. *p < 0.05 vs. Sham; #p < 0.05 vs. SAH + Vehicle, @p < 0.05 vs. SAH + PEDF-34 or SAH + PEDF-34 + DMSO
Fig. 5
Fig. 5
PEDF-34 modulated astrocyte polarization by 67LR/JNK/STAT1 signaling pathway in vitro. (a) Representative western blotting and (b-h) quantitively analysis of 67LR, p-JNK/JNK, p-STAT1/STAT1, CFB, C3 and S100A10 expressions. n = 6/group. *p < 0.05 vs. PBS; #p < 0.05 vs. Hb + Vehicle, @p < 0.05 vs. Hb + PEDF-34 or Hb + PEDF-34 + sh-control. (i) Representative microphotograph images of colocalization of C3 (A1 marker, red) and GFAP (green) immunofluorescence staining. Scale bar = 50 μm. (k) Quantification of C3-positive A1 astrocyte. n = 4/group. *p < 0.05 vs. PBS; #p < 0.05 vs. Hb + Vehicle, @p < 0.05 vs. Hb + PEDF-34 or Hb + PEDF-34 + sh-control. PEDF-34 effect on A2 astrocytes at 24 h after Hb stimulation. (j) Representative microphotographs of S100A10 (A2 marker, red) and GFAP (green) immunofluorescence staining. Scale bar = 50 μm. (l) Quantification of S100A10 positive A2 astrocytes. n = 4 replicates/group. *p < 0.05 vs. PBS; #p < 0.05 vs. Hb + Vehicle, @p < 0.05 vs. Hb + PEDF-34 or Hb + PEDF-34 + sh-control
Fig. 6
Fig. 6
PEDF-34 attenuated astrocytic pro-inflammatory cytokines in vivo and in vitro. (a-c) ELISA analysis of TNF-α, IL-1β, and IL-10 level. n = 6/group. *p < 0.05 vs. Sham; #p < 0.05 vs. SAH + Vehicle, @p < 0.05 vs. SAH + PEDF-34 or SAH + PEDF-34 + DMSO. (d-f) ELISA analysis of TNF-α, IL-1β, and IL-10 levels in astrocyte culture medium. n = 4/group. *p < 0.05 vs. PBS; #p < 0.05 vs. Hb + Vehicle, @p < 0.05 vs. Hb + PEDF-34 or Hb + PEDF-34 + sh-control

Similar articles

Cited by

References

    1. Lawton MT, Vates GE. Subarachnoid hemorrhage. N Engl J Med. 2017;377:257–66. 10.1056/NEJMcp1605827 - DOI - PubMed
    1. Kamp MA, Steiger HJ, van Lieshout JH. Experimental Aneurysmal Subarachnoid Hemorrhage: Tiding Over. Transl Stroke Res. 2020;11:1–3. 10.1007/s12975-019-00726-7 - DOI - PubMed
    1. Plastira I, Bernhart E, Joshi L, Koyani CN, Strohmaier H, Reicher H, Malle E, Sattler W. MAPK signaling determines lysophosphatidic acid (LPA)-induced inflammation in microglia. J Neuroinflammation. 2020;17:127. 10.1186/s12974-020-01809-1 - DOI - PMC - PubMed
    1. Cahill J, Calvert JW, Zhang JH. Mechanisms of early brain injury after subarachnoid hemorrhage. J Cereb Blood Flow Metab. 2006;26:1341–53. 10.1038/sj.jcbfm.9600283 - DOI - PubMed
    1. Tombran-Tink J, Barnstable CJ. PEDF: a multifaceted neurotrophic factor. Nat Rev Neurosci. 2003;4:628–36. 10.1038/nrn1176 - DOI - PubMed

LinkOut - more resources