. 2024 Jul;28(14):e18533.
doi: 10.1111/jcmm.18533.

SOD1 inhibition enhances sorafenib efficacy in HBV-related hepatocellular carcinoma by modulating PI3K/Akt/mTOR pathway and ROS-mediated cell death

Affiliations

SOD1 inhibition enhances sorafenib efficacy in HBV-related hepatocellular carcinoma by modulating PI3K/Akt/mTOR pathway and ROS-mediated cell death

Jooyoung Lee et al. J Cell Mol Med. 2024 Jul.

Abstract

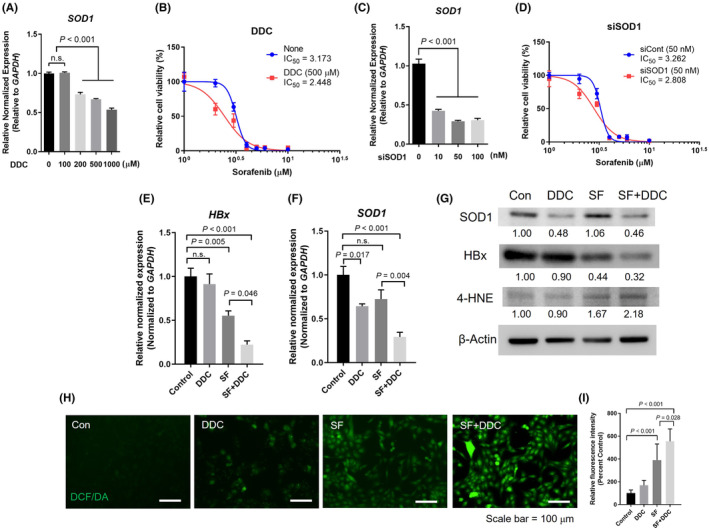
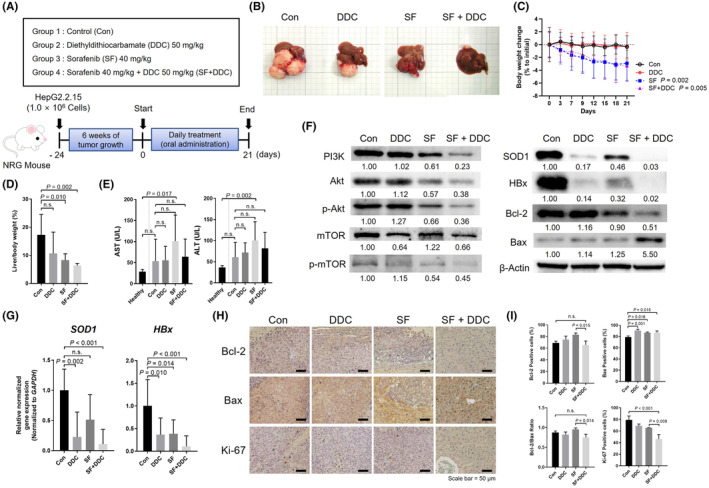
Hepatitis B Virus (HBV) infection significantly elevates the risk of hepatocellular carcinoma (HCC), with the HBV X protein (HBx) playing a crucial role in cancer progression. Sorafenib, the primary therapy for advanced HCC, shows limited effectiveness in HBV-infected patients due to HBx-related resistance. Numerous studies have explored combination therapies to overcome this resistance. Sodium diethyldithiocarbamate (DDC), known for its anticancer effects and its inhibition of superoxide dismutase 1 (SOD1), is hypothesized to counteract sorafenib (SF) resistance in HBV-positive HCCs. Our research demonstrates that combining DDC with SF significantly reduces HBx and SOD1 expressions in HBV-positive HCC cells and human tissues. This combination therapy disrupts the PI3K/Akt/mTOR signalling pathway and promotes apoptosis by increasing reactive oxygen species (ROS) levels. These cellular changes lead to reduced tumour viability and enhanced sensitivity to SF, as evidenced by the synergistic suppression of tumour growth in xenograft models. Additionally, DDC-mediated suppression of SOD1 further enhances SF sensitivity in HBV-positive HCC cells and xenografted animals, thereby inhibiting cancer progression more effectively. These findings suggest that the DDC-SF combination could serve as a promising strategy for overcoming SF resistance in HBV-related HCC, potentially optimizing therapy outcomes.

Keywords: Sorafenib resistance; disulfiram; hepatitis B virus; hepatocellular carcinoma; superoxide dismutase.


Conflict of interest statement

The authors have no conflicts of interest to declare.

Figures

FIGURE 1
FIGURE 1
Basal expression of HBx and SOD1 in HCC cell lines and human tissue samples. (A) Immunoblots and relative quantitative analysis of human tissue proteins from HCC patients, categorized into HBV‐negative and HBV‐positive groups. The levels of HBx and SOD1 proteins were analysed. (B) Correlation between HBx and SOD1 protein expression in human HCC tissues (p < 0.001). (C) Basal expression levels of HBx and SOD1 proteins in HBV‐negative (HepG2, Huh‐7, SK‐Hep1) and HBV‐positive (HepG2.2.15, Hep3B, SNU‐449) HCC cells. (D) Correlation between the expression of HBx and SOD1 proteins (p < 0.001). (E, F) Relative gene expression of HBx (E) and SOD1 (F) in HBV‐negative and HBV‐positive cell lines Significance was determined using one‐way ANOVA with Bonferroni's multiple comparisons test, with p < 0.05 considered significant. *p < 0.05; **p < 0.01; and ***p < 0.001.
FIGURE 2
FIGURE 2
Sorafenib sensitivity and PI3K/Akt/mTOR activation in HCC cell lines. (A) WST‐8 cell viability assay and IC50 calculations in HBV‐negative (HepG2, Huh‐7, SK‐Hep1) and HBV‐positive (HepG2.2.15, Hep3B, SNU‐449) HCC cell lines after 24‐hour treatment with varying concentrations of sorafenib (0–20 μM). (B) Immunoblots and relative quantitative analysis of PI3K/Akt/mTOR pathway activation and the Bcl‐2/Bax ratio in HBV‐negative and HBV‐positive HCC cell lines, normalized to β‐Actin. (C) Average IC50 values for HBV‐negative and HBV‐positive cells. (D) Average p‐Akt/Akt ratio, (E) p‐mTOR/mTOR ratio, and (F) Bcl‐2/Bax ratio. Significance was determined using Student's t‐test, with p < 0.05 considered significant. *p < 0.05; **p < 0.01; and ***p < 0.001.
FIGURE 3
FIGURE 3
Correlation between IC50 of sorafenib and the activity of PI3K/Akt/mTOR pathway, apoptosis‐related markers, and protein expression of HBx and SOD1. (A–F) The correlation between IC50 (μM) of sorafenib and the protein levels of PI3K (A), pAkt/Akt (B), p‐mTOR/mTOR (C), Bcl‐2/Bax (D), HBx (E), and SOD1 (F) in both non‐HBV HCC cell lines (HepG2, SK‐HEP1, Huh‐7) and HBV‐related HCC cell lines (HepG2.2.15, HEP3B, and SNU‐449). A P‐value of less than 0.05 was considered statistically significant.
FIGURE 4
FIGURE 4
Examination of DDC's effects on HepG2.2.15 cells in the presence or absence of sorafenib Treatment. (A, B) SOD1 expression in HepG2.2.15 cells after 24 h treatment with DDC at various concentrations (A) and the corresponding assessment of relative cell viability (B). (C, D) SOD1 expression in HepG2.2.15 cells after 24 h treatment of siSOD1 (C) and the corresponding evaluation of relative cell viability (D). Significance was determined using one‐way ANOVA with Bonferroni's multiple comparisons test, with p < 0.05 considered statistically significant. (E, F) Gene expression levels of HBx (E) and SOD1 (F) in HepG2.2.15 cells that were treated with DDC, either alone or in combination with sorafenib. (G) Western blot analysis of SOD1, HBx, and 4‐HNE in HepG2.2.15 cells that underwent the same treatments, with the relative protein densities presented. (H, I) Cellular ROS staining using the H2DCFDA assay in cells treated with DDC, with or without sorafenib. It includes both the staining results (H) and a quantification of the relative fluorescence intensity (I). The Significance was determined using one‐way ANOVA with multiple comparisons test, with p < 0.05 considered statistically significant.
FIGURE 5
FIGURE 5
Examination of cell death in HepG2.2.15 cells subjected to DDC treatment with or without sorafenib. (A) Western blot analysis of apoptosis‐related proteins (PARP1, cleaved PARP1, cleaved caspase3) and an autophagy‐related protein (LC3B) in HepG2.2.15 cells that were treated with DDC, either alone or in combination with sorafenib. (B) Fluorescence imaging analysis for apoptosis using Annexin V‐FITC/PI staining in HepG2.2.15 cells that underwent the same treatments. (C, D) A quantification of the Annexin V‐FITC positive area (%) (C), and the ratio of PI‐positive cells to DAPI‐positive cells (D). (E) Evaluation of the PI3K/Akt/mTOR pathway and Bcl‐2/Bax levels in cells treated with DDC, SF, or SF + DDC at various time points (up to 6 h). The significance of the results was determined using one‐way ANOVA with Bonferroni's multiple comparisons test, with a p‐value of less than 0.05 considered statistically significant.
FIGURE 6
FIGURE 6
Temporal alterations in PI3K/Akt/mTOR pathway and Bcl‐2/Bax levels in DDC, SF, and SF + DDC groups. (A–D) The time‐dependent changes in the levels of PI3K (A), pAkt/Akt (B), p‐mTOR/mTOR (C), and Bcl‐2/Bax (D) in HepG2.2.15 cells. The cells were treated with DDC, sorafenib (SF), or the combination (SF + DDC) at different time points (2 h, 4 h, and 6 h). A P value less than 0.05 was considered statistically significant.
FIGURE 7
FIGURE 7
Analysis of tumour xenograft mice subjected to DDC treatment with or without sorafenib. (A) Schematic diagram of the experimental design. (B) Representative images of mice from each group: HCC control, Sorafenib only, DDC only, and combined Sorafenib + DDC (SF + DDC). (C) Graph showing the percentage of body weight change relative to the initial weight for each group. (D) Liver‐to‐body weight ratio (%) for each group. (E) Levels of AST and ALT enzymes in each group, indicating liver function. (F) Western blot images displaying the relative protein densities of PI3K, Akt, mTOR, Bcl‐2, Bax, SOD1, and HBx in liver tumours from each group. (G) Gene expression levels of SOD1 and HBx in tumours from each group. (H) Representative immunohistochemistry (IHC) images showing Bcl‐2, Bax, and Ki‐67 staining in liver sections of xenografted mice. (I) Quantification of positive staining areas for Bcl‐2, Bax, Ki‐67, and the Bcl‐2/Bax ratio in the liver sections. Statistical analysis was performed using one‐way ANOVA with Bonferroni's multiple comparisons test. A p‐value of less than 0.05 was considered statistically significant.

References

    1. Villanueva A. Hepatocellular Carcinoma. N Engl J Med. 2019;380(15):1450‐1462. doi:10.1056/NEJMra1713263 - DOI - PubMed
    1. Yang JD, Hainaut P, Gores GJ, Amadou A, Plymoth A, Roberts LR. A global view of hepatocellular carcinoma: trends, risk, prevention and management. Nat Rev Gastroenterol Hepatol. 2019;16(10):589‐604. doi:10.1038/s41575-019-0186-y - DOI - PMC - PubMed
    1. Rehermann B, Thimme R. Insights from antiviral therapy into immune responses to hepatitis B and C virus infection. Gastroenterology. 2019;156(2):369‐383. doi:10.1053/j.gastro.2018.08.061 - DOI - PMC - PubMed
    1. Kim SW, Yoon JS, Lee M, Cho Y. Toward a complete cure for chronic hepatitis B: novel therapeutic targets for hepatitis B virus. Clin Mol Hepatol. 2022;28(1):17‐30. doi:10.3350/cmh.2021.0093 - DOI - PMC - PubMed
    1. Naggie S, Lok AS. New therapeutics for hepatitis B: the road to cure. Annu Rev Med. 2021;72:93‐105. 10.1146/annurev-med-080119-103356 - DOI - PubMed

MeSH terms

LinkOut - more resources