. 2024 Jul 5:15:1411872.
doi: 10.3389/fimmu.2024.1411872. eCollection 2024.

Cellular and microenvironmental cues that promote macrophage fusion and foreign body response

Affiliations

Cellular and microenvironmental cues that promote macrophage fusion and foreign body response

Chloe L Stewart et al. Front Immunol. .

Abstract

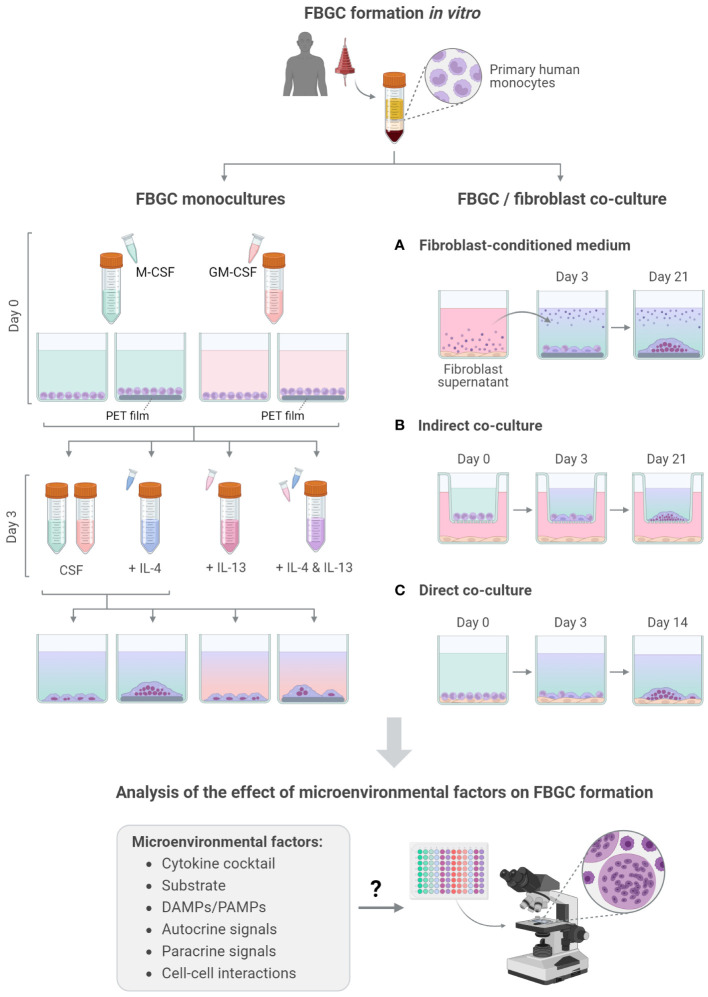
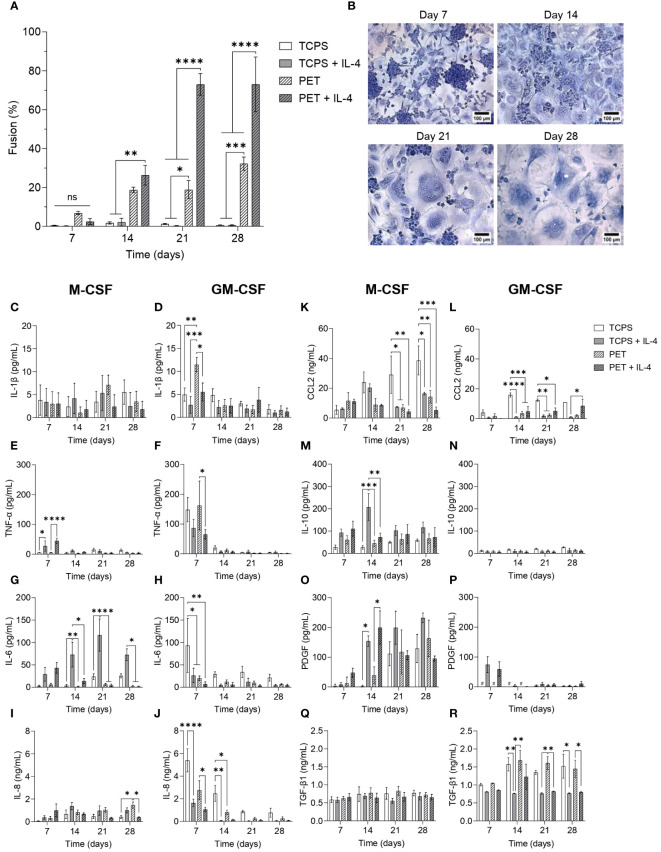
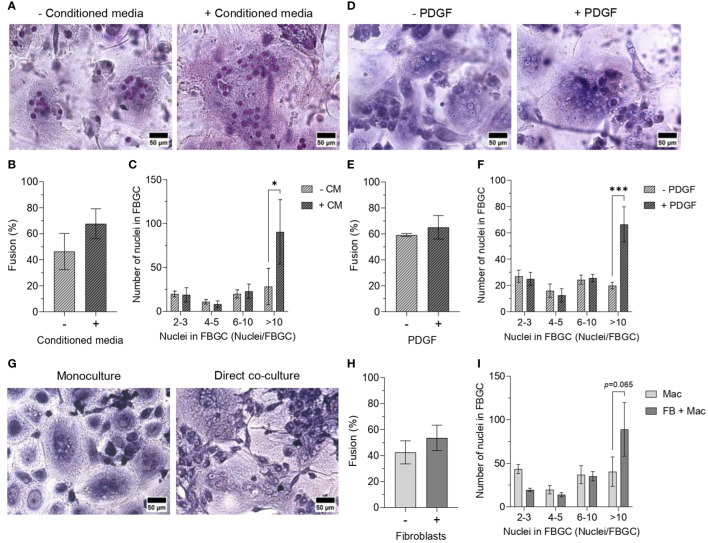
During the foreign body response (FBR), macrophages fuse to form foreign body giant cells (FBGCs). Modulation of FBGC formation can prevent biomaterial degradation and loss of therapeutic efficacy. However, the microenvironmental cues that dictate FBGC formation are poorly understood with conflicting reports. Here, we identified molecular and cellular factors involved in driving FBGC formation in vitro. Macrophages demonstrated distinct fusion competencies dependent on monocyte differentiation. The transition from a proinflammatory to a reparative microenvironment, characterised by specific cytokine and growth factor programmes, accompanied FBGC formation. Toll-like receptor signalling licensed the formation of FBGCs containing more than 10 nuclei but was not essential for cell-cell fusion to occur. Moreover, the fibroblast-macrophage crosstalk influenced FBGC development, with the fibroblast secretome inducing macrophages to secrete more PDGF, which enhanced large FBGC formation. These findings advance our understanding as to how a specific and timely combination of cellular and microenvironmental factors is required for an effective FBR, with monocyte differentiation and fibroblasts being key players.

Keywords: Toll-like receptor signalling; fibroblast; foreign body giant cell; foreign body response; macrophage; macrophage fusion.


Conflict of interest statement

The authors declare that the research was conducted in the absence of any commercial or financial relationships that could be construed as a potential conflict of interest. The author(s) declared that they were an editorial board member of Frontiers, at the time of submission. This had no impact on the peer review process and the final decision.

Figures

Figure 1
Figure 1
Overview of FBGC formation and analysis. Schematic of the experimental workflow used to induce the fusion of primary human monocyte-derived macrophages into FBGCs in vitro and investigate the effect of molecular (A, B) and cellular (C) factors on FBGC formation. Created with BioRender.com.
Figure 2
Figure 2
Effect of M-CSF and GM-CSF on FBGC formation. Percentage of macrophage fusion in response to (A) M-CSF (25–100 ng/mL) and (B) GM-CSF (2.5–10 ng/mL) with stacked bars showing the percentage of nuclei within FBGC containing a total of 2 to 3, 4 to 5, 6 to 10 and/or >10 nuclei/cell. Macrophages were cultured in the absence or presence of IL-4 (10 ng/mL), IL-13 (10 ng/mL) or both IL-4 and IL-13 (5 ng/mL each) for 28 days. Data are means ± SEM of three donors. (C) Macrophages and FBGCs were stained with May-Grünwald and Giemsa. Images are representative of three independent experiments, each with a different donor. Scale bar, 50 μm. Red arrows indicate dendritic cell morphologies.
Figure 3
Figure 3
Effect of cytokine combination and substrate surface on FBGC formation. (A) Percentage of macrophage fusion in response to culturing macrophages on PET following differentiation with M-CSF (50 ng/mL) or GM-CSF (5 ng/mL) and polarisation with IL-4 (10 ng/mL). Stacked bars show the percentage of nuclei within FBGC containing a total of 2 to 3, 4 to 5, 6 to 10 and/or >10 nuclei/cell. Data is the mean ± SEM of four (GM-CSF) and five (M-CSF) biological donors. Statistical significance was determined by two-way ANOVA with the Tukey multiple comparison test (*p<0.05, ***p<0.005, ****p<0.001). (B) Average circularity of FBGCs formed in different culture conditions. Data is the mean ± SEM of three (GM-CSF) and four (M-CSF) biological donors. Statistical significance was determined by two-way ANOVA with the Tukey multiple comparison test (* p<0.05). Representative images of (C) M-CSF- and (D) GM-CSF-differentiated macrophages and FBGCs cultured for 28 days on TCPS or PET without or with IL-4. Cells stained with May-Grünwald and Giemsa prior to imaging. Scale bar, 50 μm. (E) Representative images of toluidine blue-stained monocytes adhered to TCPS and PET substrates one hour after seeding in regular culture media, media without serum, and media with EDTA. Scale bar, 50 μm. (F) Absorbance of toluidine blue at 590 nm following monocyte lysis to represent the proportion of monocytes adhered to TCPS and PET substrates after one hour when cultured in regular media, media without serum, and media with EDTA. Data is the mean ± SEM of three biological donors. No statistical significance (ns) was determined by two-way ANOVA with the Šídák multiple comparison test.
Figure 4
Figure 4
Temporal changes in secretome during FBGC formation (A) Macrophage fusion percentage at weekly intervals when macrophages were cultured on TCPS or PET and differentiated with M-CSF (50 ng/mL), with or without IL-4 (10 ng/mL). Data is the mean ± SEM of four biological donors. (B) Representative images of fusing macrophages and FBGCs stained with May-Grünwald and Giemsa at weekly intervals when macrophages were cultured on PET with media containing M-CSF and IL-4. Scale bar, 100 μm. (C–R) The amount of cytokines and growth factors secreted by M-CSF- and GM-CSF-differentiated macrophages and FBGCs cultured in fusogenic and non-fusogenic conditions was determined by ELISA at weekly intervals. Data is the mean ± SEM of three (J–L) to four (C–I, M–R) biological donors. Statistical significance was determined at each time point by two-way ANOVA with the Šídák multiple comparison test (*p<0.05, **p<0.01, ***p<0.005, ****p<0.001). ns, not significant.
Figure 5
Figure 5
Effect of Toll-like receptor activation and signalling on FBGC formation. (A) The amount of tenascin-C (TN-C) secreted by macrophages and FBGCs cultured in fusogenic and non-fusogenic conditions was quantified by ELISA. Macrophages were cultured in M-CSF (50 ng/mL) or GM-CSF (5 ng/mL) with or without IL-4 (10 ng/mL). Data is the mean ± SEM of three biological donors, except for the TN-C control condition denoted with (#) which represents one biological donor. No statistical significance was determined by two-way ANOVA with the Tukey multiple comparison test. Representative images of May-Grünwald/Giemsa-stained M-MDMs and FBGCs cultured in fusogenic conditions in the presence and absence of (B) TLR4 inhibitor TAK-242 and (C) TLR activator HKSA. Scale bar, 50 μm. (D) Percentage of macrophage fusion on TCPS and PET in response to TLR4 inhibition. FBGC size in response to TLR4 inhibition according to number of nuclei per FBGC when macrophages cultured on (E) TCPS or (F) PET. Data is the mean ± SEM of five biological donors. (G) Percentage of macrophage fusion on TCPS and PET in response to TLR activation by HKSA. FBGC size following TLR activation by HKSA according to the number of nuclei/FBGC when macrophages were cultured on (H) TCPS or (I) PET. (B–I) Macrophages and FBGCs were cultured in M-CSF (50 ng/mL) and IL-4 (10 ng/mL). Data is the mean ± SEM of three (PET) and four (TCPS) biological donors. Statistical significance was determined by two-way ANOVA with the Šídák multiple comparison test (*p<0.05, **p<0.01). ns, not significant.
Figure 6
Figure 6
Effect of fibroblasts on FBGC formation in macrophage-fibroblast indirect co-cultures. (A) Schematic of indirect co-culture set-up. Fibroblasts (FB) were seeded into wells and cultured in media without cytokine supplementation. Monocytes were seeded into PET inserts and differentiated to macrophages (Mac) with M-CSF (50 ng/mL). IL-4 (10 ng/mL) was added to monocytes after 72 hours to induce FBGC formation. The combination of M-CSF and IL-4 in the medium is depicted as a blue-green gradient within the insert. (B) Percentage of macrophage fusion at weekly intervals with stacked bars showing the percentage of nuclei within FBGC containing a total of<5, 6 to 10, 11 to 20, 21 to 30 and/or >30 nuclei/cell. (C) Representative images of May-Grünwald/Giemsa-stained macrophages and FBGCs in monocultures and indirectly co-cultured with fibroblasts at weekly intervals. Scale bar, 50 μm. (D–G) Secretion of cytokines and growth factors determined by ELISA from macrophages and FBGCs in monoculture and indirect co-culture with fibroblasts. Supernatants were obtained from both inserts and wells. Data is the mean ± SEM of three (E), four (D, F) and five (G) biological donors. Statistical significance was determined by two-way ANOVA with the Šídák multiple comparison test (*p<0.05, ****p<0.001). Representative images of the largest syncytium formed in (H) macrophage monocultures and (I) macrophage-fibroblast indirect co-cultures. Macrophages/FBGCs were stained with May-Grünwald/Giemsa and imaged after 14 days. The largest cell mass contained 86 and 177 nuclei in monoculture and co-culture, respectively. Scale bar, 50 μm. ns, not significant.
Figure 7
Figure 7
Effect of fibroblast-conditioned medium and fibroblast-macrophage contact on FBGC formation. Representative images of macrophages and FBGCs stained with May-Grünwald and Giemsa after 21 days of culture on PET in M-CSF (50 ng/mL) and IL-4 (10 ng/mL) without or with (A) fibroblast-conditioned media (CM; diluted 1:1 with fresh media) and (D) PDGF (100 pg/mL from day 7, 200 pg/mL from day 10, 400 pg/mL from day 17). Scale bar, 50 μm. Percentage of macrophage fusion after 21 days of culture on PET in M-CSF and IL-4 with the addition of (B) conditioned media or (E) PDGF. FBGC size according to number of nuclei per FBGC when macrophages were cultured for 21 days on PET with M-CSF and IL-4 with the addition of (C) conditioned media and (F) PDGF. (G) Representative images of macrophages and FBGCs directly co-cultured with fibroblasts in media containing M-CSF (50 ng/mL) and IL-4 (10 ng/mL) for 14 days. Macrophages, FBGCs and fibroblasts were stained with May-Grünwald and Giemsa. Scale bar, 50 μm. (H) Percentage of macrophage fusion and (I) FBGC size according to number of nuclei/FBGC when macrophages were directly co-cultured with fibroblasts in medium containing M-CSF and IL-4 for 14 days. Data is the mean ± SEM of three (E, F) to four (B, C, H, I) biological donors. No statistical significance for (B, E, H) was determined by unpaired t-tests. Statistical significance for (C, F, I) was determined by two-way ANOVA with the Šídák multiple comparison test (*p<0.05, ***p<0.005).
Figure 8
Figure 8
Model of cellular and microenvironmental cues that dictate macrophage fusion and FBGC formation. Macrophages differentiated with M-CSF are fusion competent and can form large FBGCs in the presence of IL-4 and a foreign body (e.g. polyethylene terephthalate (PET)), whereas GM-CSF-mediated differentiation does not licence macrophages to form FBGCs. Fusing M-MDMs and FBGCs are associated with an early pro-inflammatory response which transitions to tissue repair by day 14 (red and green gradients, respectively), whilst GM-MDMs maintain an inflammatory phenotype (red gradient). Activation of TLRs by PAMPs (e.g. bacterial ligands) or DAMPs (e.g. TN-C and denatured serum proteins adsorbed to biomaterial) allows the formation of large FBGCs. Finally, the autocrine growth factor PDGF and soluble paracrine factors secreted by fibroblasts also enhance the formation of large FBGCs. Created with BioRender.com.

References

    1. Galli SJ, Borregaard N, Wynn TA. Phenotypic and functional plasticity of cells of innate immunity: macrophages, mast cells and neutrophils. Nat Immunol. (2011) 12:1035–44. doi: 10.1038/ni.2109 - DOI - PMC - PubMed
    1. Ahmadzadeh K, Pereira M, Vanoppen M, Bernaerts E, Ko J-H, Mitera T, et al. . Multinucleation resets human macrophages for specialized functions at the expense of their identity. EMBO Rep. (2023) 24:e57070. doi: 10.15252/embr.202357070 - DOI - PMC - PubMed
    1. Takito J, Nakamura M. Heterogeneity and actin cytoskeleton in osteoclast and macrophage multinucleation. Int J Mol Sci. (2020) 21:6629–59. doi: 10.3390/ijms21186629 - DOI - PMC - PubMed
    1. Ahmadzadeh K, Vanoppen M, Rose CD, Matthys P, Wouters CH. Multinucleated giant cells: current insights in phenotype, biological activities, and mechanism of formation. Front Cell Dev Biol. (2022) 10:873226. doi: 10.3389/fcell.2022.873226 - DOI - PMC - PubMed
    1. Pereira M, Petretto E, Gordon S, Bassett JHD, Williams GR, Behmoaras J. Common signalling pathways in macrophage and osteoclast multinucleation. J Cell Sci. (2018) 131:jcs216267. doi: 10.1242/jcs.216267 - DOI - PubMed

LinkOut - more resources