Review
. 2024;2(1):20.
doi: 10.1038/s44303-024-00025-3. Epub 2024 Jul 17.

Mass spectrometry imaging for spatially resolved multi-omics molecular mapping

Affiliations
Review

Mass spectrometry imaging for spatially resolved multi-omics molecular mapping

Hua Zhang et al. Npj Imaging. 2024.

Abstract

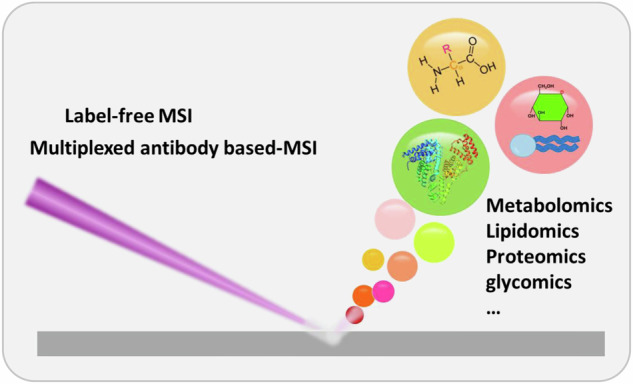
The recent upswing in the integration of spatial multi-omics for conducting multidimensional information measurements is opening a new chapter in biological research. Mapping the landscape of various biomolecules including metabolites, proteins, nucleic acids, etc., and even deciphering their functional interactions and pathways is believed to provide a more holistic and nuanced exploration of the molecular intricacies within living systems. Mass spectrometry imaging (MSI) stands as a forefront technique for spatially mapping the metabolome, lipidome, and proteome within diverse tissue and cell samples. In this review, we offer a systematic survey delineating different MSI techniques for spatially resolved multi-omics analysis, elucidating their principles, capabilities, and limitations. Particularly, we focus on the advancements in methodologies aimed at augmenting the molecular sensitivity and specificity of MSI; and depict the burgeoning integration of MSI-based spatial metabolomics, lipidomics, and proteomics, encompassing the synergy with other imaging modalities. Furthermore, we offer speculative insights into the potential trajectory of MSI technology in the future.

Keywords: Analytical chemistry; Biochemistry; Biophysical methods; Chemical biology; Imaging.


Conflict of interest statement

Competing interestsThe authors declare no competing interests.

Figures

Fig. 1
Fig. 1
Mass spectrometry imaging (MSI) serves as a leading tool for the spatial mapping of metabolome, lipidome, and proteome.
Fig. 2
Fig. 2. Representative MS imaging methods.
Graphical representation of the main techniques for MS imaging, including multiplexed antibody-based and label-free MSI methods. Inverted Y-shaped symbols, antibodies; colored balls, tags on antibodies or analyte ions; horizontal laser beam in MALDI-2 technique; ESI electrospray ionization. Modified from figure adapted with permission from ref.
Fig. 3
Fig. 3. Neural-network architecture of variational autoencoder for mass spectrometry imaging data analysis.
a Visual representation of variational autoencoder for MS imaging. Spectra on left represent experimental spectra, while spectra on right represent predicted spectra that come after dimensionality reduction resulting from the variational autoencoder. b Visual representation of five layers in fully connected neural network. In between those two layers, three hidden layers in the fully connected neural network. c Batch normalization for neural network regularization. d Statistical analysis on the neural-network weight parameter was used to pinpoint useful m/z features. Used under the terms of the Creative Commons Attribution 4.0 International License. Copyright 2021, The Authors, published by Springer Nature.
Fig. 4
Fig. 4. MALDI-IM-MSI of the activated human pancreatic stellate cells (PSC).
a Representative ion-mobility MS incorporated data at a mass window of m/z 762.5 to 762.8, (b) MS images constructed based on m/z value alone, (cf) MS images of isobaric and isomeric lipids revealed based on incorporation of the m/z value and collisional cross-section (CCS) value information. Scale bar, 400 µm. Adapted with permission from ref.
Fig. 5
Fig. 5. Spatially resolved multi-omics via integration of MS imaging and other imaging modalities.
Integration of various omics data, such as genome, transcriptome, proteome, lipidome, and metabolome, requires accurate computational co-registration/imaging fusion of the omics data from a single tissue section or sequential tissue sections. The MSI spatial-omics dataset can be further combined with other spatial molecular profiling modalities, such as spatial transcriptomics, MRI, PET, SPECT, and Raman imaging.
Fig. 6
Fig. 6. Spatially resolved multi-omics reveals intratumor heterogeneity of gastric cancer.
a Strategy of integrated spatially resolved multi-omics for highlighting tumor metabolic remodeling and interactions. b H&E stain image of gastric cancer tissue section from patient and ×40 magnified H&E stain image of different gastric cancer tissue regions, scale bar = 2 mm for whole tissue section, scale bar = 100 μm for magnified images. The experiment was repeated three times. Adapted with permission from ref.

References

    1. Bressan, D., Battistoni, G. & Hannon, G. J. The dawn of spatial omics. Science381. 10.1126/science.abq4964 (2023). - PMC - PubMed
    1. Vandereyken, K., Sifrim, A., Thienpont, B. & Voet, T. Methods and applications for single-cell and spatial multi-omics. Nat. Rev. Genet.24, 494–515 (2023). - PMC - PubMed
    1. Babu, M. & Snyder, M. Multi-omics profiling for health. Mol. Cell. Proteom.22. 10.1016/j.mcpro.2023.100561 (2023). - PMC - PubMed
    1. Wagner, A., Regev, A. & Yosef, N. Revealing the vectors of cellular identity with single-cell genomics. Nat. Biotechnol.34, 1145–1160 (2016). - PMC - PubMed
    1. Tian, L. Y., Chen, F. & Macosko, E. Z. The expanding vistas of spatial transcriptomics. Nat. Biotechnol.41, 773–782 (2023). - PMC - PubMed

LinkOut - more resources