. 2024 Sep 1;151(17):dev202853.
doi: 10.1242/dev.202853. Epub 2024 Sep 3.

Thymic epithelial organoids mediate T-cell development

Affiliations

Thymic epithelial organoids mediate T-cell development

Tania Hübscher et al. Development. .

Abstract

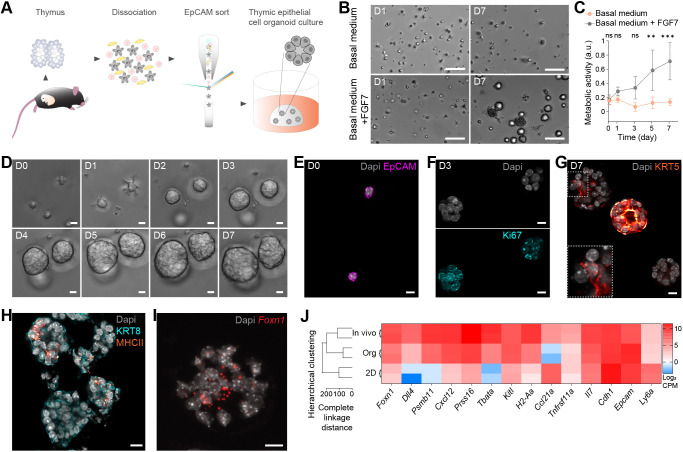
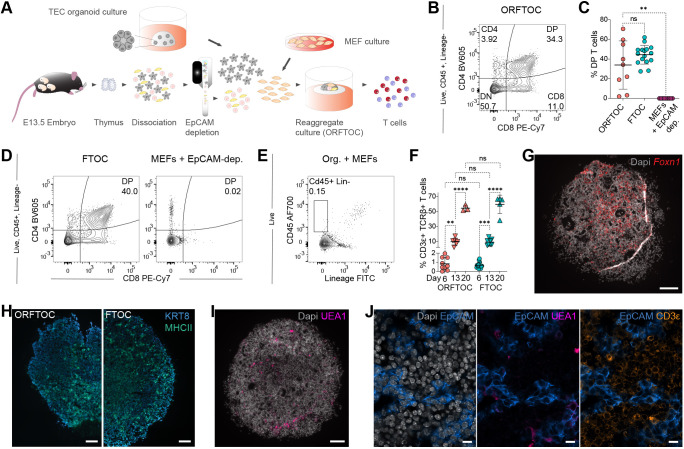
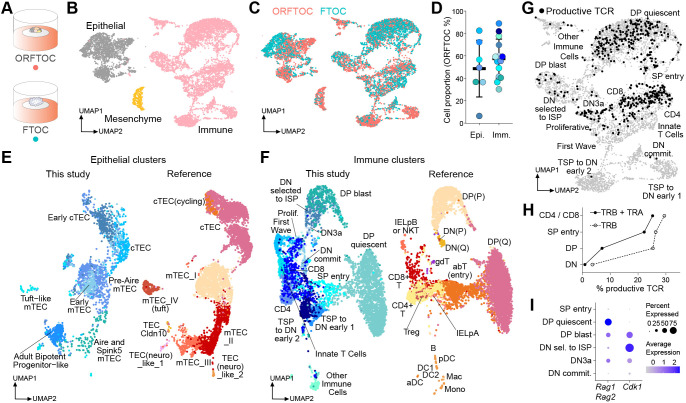
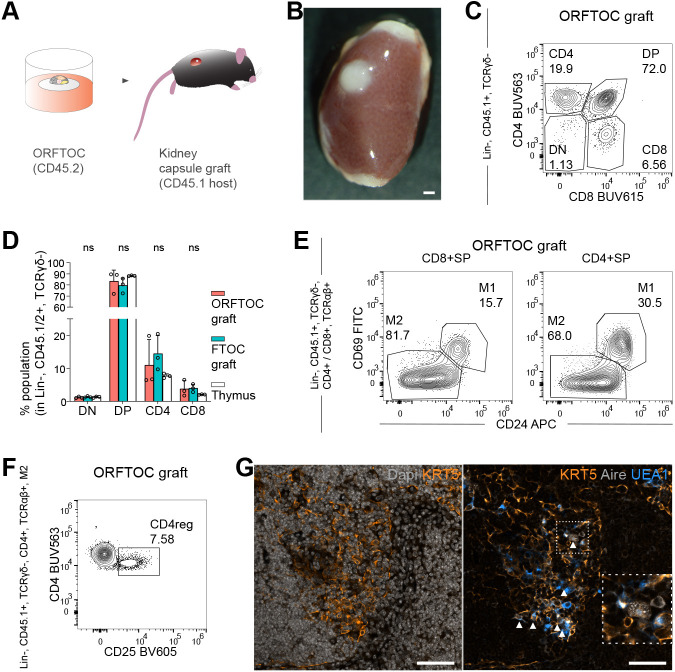
Although the advent of organoids has opened unprecedented perspectives for basic and translational research, immune system-related organoids remain largely underdeveloped. Here, we established organoids from the thymus, the lymphoid organ responsible for T-cell development. We identified conditions enabling mouse thymic epithelial progenitor cell proliferation and development into organoids with diverse cell populations and transcriptional profiles resembling in vivo thymic epithelial cells (TECs) more closely than traditional TEC cultures. In contrast to these two-dimensional cultures, thymic epithelial organoids maintained thymus functionality in vitro and mediated physiological T-cell development upon reaggregation with T-cell progenitors. The reaggregates showed in vivo-like epithelial diversity and the ability to attract T-cell progenitors. Thymic epithelial organoids are the first organoids originating from the stromal compartment of a lymphoid organ. They provide new opportunities to study TEC biology and T-cell development in vitro, paving the way for future thymic regeneration strategies in ageing or acute injuries.

Keywords: Mouse; Organoids; T cells; Thymic epithelial cells; Thymopoiesis; Thymus.


Conflict of interest statement

Competing interests M.P.L. is an employee of F. Hoffmann-La Roche.

Figures

Fig. 1.
Fig. 1.
Thymic epithelial cells grow and maintain marker expression in defined organoid culture conditions. (A) Workflow to generate thymic epithelial organoids. (B) Brightfield images of thymic epithelial organoids 1 (D1) and 7 (D7) day(s) after seeding, in organoid basal medium supplemented or not with FGF7. (C) Metabolic activity (resazurin assay) of organoids cultured in the same conditions as in B. **P=0.0047, ***P=0.0005; ns, non significant (P<0.05) (two-way ANOVA with Šidák multiple comparison test; n=15 per condition, from 3 mice). Data represent mean±s.d. a.u., arbitrary units. (D) Brightfield images of sorted TECs from single cells to multicellular organoids over one week. (E-H) Immunofluorescence staining. (E) EpCAM-positive (magenta) TECs immediately after seeding (D0). (F) Proliferative D3 organoids (Ki67; cyan). (G) D7 organoids contain different cell populations, here with medullary cells (KRT5; red) present in various patterns. Inset shows the boxed area at higher magnification. (H) MHCII expression (orange) in D7 organoids co-stained with KRT8 (cyan). Nuclei are stained with DAPI (grey). (I) RNAscope for Foxn1 in a D7 organoid. Nuclei are counterstained using Spectral DAPI (grey). (J) Gene expression profiling. Left: Dendrogram showing the clustering of thymic epithelial organoids (Org) with freshly extracted TECs (In vivo) and not with TECs cultured in 2D (2D). Right: Heatmap displaying expression of key TEC genes as well as Cdh1 and Ly6a for the same three conditions. n=2 mice per condition. All TECs originate from E16.5 thymi. Scale bars: 100 μm (B); 10 μm (D-I).
Fig. 2.
Fig. 2.
TECs cultured as organoids show in vitro functionality when reaggregated with T-cell progenitors. (A) Workflow to generate organoid reaggregate fetal thymic organ cultures (ORFTOCs). (B) Flow cytometry plot showing T-cell development in D6 ORFTOCs. (C) Proportion of DP thymocytes at D6 in ORFTOCs and controls [fetal thymic organ cultures (FTOCs) and reaggregates containing only MEFs and the EpCAM-depleted cells from thymic lobes]. **P=0.0047; ns, not significant (P>0.05) (Kruskal–Wallis test with Dunn's multiple comparison test; n=9, 16 and 9 for ORFTOCs, FTOCs and reaggregates from MEFs+EpCAM-depleted cells, respectively, from 9 independent experiments). (D,E) Flow cytometry plots. (D) T-cell development at D6 in controls (left: FTOCs; right: reaggregates from MEFs+EpCAM-depleted cells). (E) Absence of a CD45– Lineage (Lin) population in control reaggregates containing only TECs cultured as organoids and MEFs. Gating strategy is indicated on the left for all flow cytometry plots. (F) Proportion of CD3ε-positive, TCRβ-positive cells in ORFTOCs and FTOCs at D6, D13 and D20. **P=0.0021, ***P=0.0003, ****P<0.0001; ns, not significant (P>0.05) (two-way ANOVA with Tukey's multiple comparison test; n=9, 6, 3, 16, 8 and 5 for D6 ORFTOCs, D13 ORFTOCs, D20 ORFTOCs, D6 FTOCs, D13 FTOCs and D20 FTOCs, respectively, from at least 3 independent experiments). All graphs represent individual datapoints with mean±s.d. (G) RNAscope for Foxn1 in a D13 ORFTOC. Nuclei are counterstained using Spectral DAPI (grey). (H-J) Immunofluorescence images. (H) KRT8 (blue) and MHCII (green) staining in a D13 ORFTOC (left) and a D13 FTOC (right). (I) Medullary cells (UEA1 reactivity; magenta) in a D13 ORFTOC. (J) Epithelial cells (EpCAM; blue), medullary cells (UEA1 reactivity; bright pink) and T cells (CD3ε; amber) in a D13 ORFTOC. DAPI stains nuclei (grey). ORFTOCs were formed with TECs cultured as organoids originating from E16.5 thymi, with the EpCAM-depleted fraction of cells from E13.5 thymi and with MEFs. FTOCs were from E13.5 thymi. Scale bars: 100 µm (G-I); 10 μm (J).
Fig. 3.
Fig. 3.
ORFTOCs recapitulate in vivo-like TEC and T-cell population diversity and physiological T-cell development. (A) D13 ORFTOCs and D13 FTOCs (two pooled for each group) were analysed by scRNAseq with hashtag antibodies. (B) Uniform Manifold Approximation and Projection (UMAP) with three clusters corresponding to the main input populations (epithelial, immune and mesenchymal cells). (C) UMAP for ORFTOC and FTOC cell distribution in the different clusters. (D) ORFTOC proportion for each cluster (circle) within the epithelial or immune main populations. Mean ORFTOC proportion and s.d. are indicated. Circle colours match the cluster colours in E and in Fig. S3A,C (for epithelial and immune cells, respectively). No outliers within epithelial or immune compartments were identified by Grubbs test. (E,F) UMAPs for the integration of the epithelial (E) and immune (F) clusters identified in this study (left) with the mouse datasets of the Park et al. atlas (Park et al., 2020) (right). (G) UMAP of the immune cluster (grey), highlighting cells identified as productive and bearing both TCR chains (black). (H) Proportion of productive cells with rearranged TRB or both TRA and TRB chains for the main thymocyte developmental stages. (I) Average expression level (dot colour) and percentage (dot size) of cells expressing the recombination enzymes Rag1 and Rag2, and the cyclin protein Cdk1 during the recombination and proliferation stages of thymopoiesis. ORFTOCs were formed with TECs cultured as organoids originating from E16.5 thymi, with the EpCAM-depleted fraction of cells from E13.5 thymi and with MEFs. FTOCs were from E13.5 thymi. In the Park et al. atlas, thymi span from E14.5 to 4-6 weeks for the stromal dataset and are 4-week-old for the T-cell dataset. aDC, activated dendritic cells; commit, commitment; DC, dendritic cells; Epi, epithelial; IELpA, intestinal intraepithelial lymphocytes precursor A; IELpB, intestinal intraepithelial lymphocytes precursor B; Imm, immune; ISP, intermediate single positive; Mac, macrophages; Mono, monocytes; NKT, natural killer T; (P), proliferative; pDC, plasmacytoid dendritic cells; Prolif, proliferative; (Q), quiescent; sel, selected; TSP, thymus-seeding progenitors.
Fig. 4.
Fig. 4.
ORFTOCs show a thymus-like ability to attract new T-cell progenitors and improved epithelial organization upon in vivo grafting. (A) Experimental design for the grafting of ORFTOCs under the kidney capsule. (B) Widefield image of an ORFTOC graft after 5 weeks. (C) Flow cytometry plot showing host thymocyte development in ORFTOC grafts. Lin, Lineage. (D) Proportion of the major thymocyte subpopulations in ORFTOC grafts and controls (FTOC grafts and thymi). ns, not significant (P>0.05) (one-way ANOVA with Tukey's multiple comparison test for each subpopulation between conditions; n=3 grafts/mice for each condition). Bar graph shows mean±s.d. and individual datapoints. (E,F) Flow cytometry plots. (E) Presence of two separate post-selection stages (M1 and M2) within the CD8+ and CD4+ SP populations in ORFTOC grafts. (F) The M2 population of ORFTOC grafts contains CD4 regulatory T cells (CD4reg). Gating strategy is indicated on the left for all flow cytometry plots. (G) Immunofluorescence images of an ORFTOC graft. Left: Medullary cells (KRT5; amber) are present in the less-dense area (DAPI; grey). Right: The medullary region also contains UEA1-reactive (azure) and Aire-positive (grey, highlighted with arrowhead) cells. Inset shows the boxed area at higher magnification. ORFTOCs were formed with TECs cultured as organoids originating from E16.5 thymi, with the EpCAM-depleted fraction of cells from E13.5 thymi and with MEFs. FTOCs were from E13.5 thymi. Scale bars: 1 mm (B); 100 μm (G).

References

    1. Alawam, A. S., Anderson, G. and Lucas, B. (2020). Generation and regeneration of thymic epithelial cells. Front. Immunol. 11, 858. 10.3389/fimmu.2020.00858 - DOI - PMC - PubMed
    1. Anderson, G. and Jenkinson, E. J. (1998). Use of explant technology in the study of in vitro immune responses. J. Immunol. Methods 216, 155-163. 10.1016/S0022-1759(98)00076-3 - DOI - PubMed
    1. Anderson, G., Jenkinson, E. J., Moore, N. C. and Owen, J. J. T. (1993). MHC class II-positive epithelium and mesenchyme cells are both required for T-cell development in the thymus. Nature 362, 70-73. 10.1038/362070a0 - DOI - PubMed
    1. Anderson, K. L., Moore, N. C., McLoughlin, D. E. J., Jenkinson, E. J. and Owen, J. J. T. (1998). Studies on thymic epithelial cells in vitro. Dev. Comp. Immunol. 22, 367-377. 10.1016/S0145-305X(98)00011-1 - DOI - PubMed
    1. Asnaghi, M. A., Barthlott, T., Gullotta, F., Strusi, V., Amovilli, A., Hafen, K., Srivastava, G., Oertle, P., Toni, R., Wendt, D.et al. (2021). Thymus extracellular matrix–derived scaffolds support graft–resident thymopoiesis and long–term in vitro culture of adult thymic epithelial cells. Adv. Funct. Mater. 31, 2010747. 10.1002/adfm.202010747 - DOI - PMC - PubMed