. 2024 Nov;22(11):3085-3098.
doi: 10.1111/pbi.14431. Epub 2024 Jul 22.

ZmPHR1 contributes to drought resistance by modulating phosphate homeostasis in maize

Affiliations

ZmPHR1 contributes to drought resistance by modulating phosphate homeostasis in maize

Meng-Zhi Tian et al. Plant Biotechnol J. 2024 Nov.

Abstract

As an essential macronutrient, phosphorus (P) is often a limiting nutrient because of its low availability and mobility in soils. Drought is a major environmental stress that reduces crop yield. How plants balance and combine P-starvation responses (PSRs) and drought resistance is unclear. In this study, we identified the transcription factor ZmPHR1 as a major regulator of PSRs that modulates phosphate (Pi) signaling and homeostasis. We found that maize zmphr1 mutants had reduced P concentration and were sensitive to Pi starvation, whereas ZmPHR1-OE lines displayed elevated Pi concentration and yields. In addition, 57% of PSR genes and nearly 70% of ZmPHR1-regulated PSR genes in leaves were transcriptionally responsive to drought. Under moderate and early drought conditions, the Pi concentration of maize decreased, and PSR genes were up-regulated before drought-responsive genes. The ZmPHR1-OE lines exhibited drought-resistant phenotypes and reduced stomatal apertures, whereas the opposite was true of the zmphr1 mutants. ZmPT7-OE lines and zmspx3 mutants, which had elevated Pi concentration, also exhibited drought resistance, but zmpt7 mutants were sensitive to drought. Our results suggest that ZmPHR1 plays a central role in integrating Pi and drought signals and that Pi homeostasis improves the ability of maize to combat drought.

Keywords: ZmPHR1; drought; maize; phosphate homeostasis.


Figures

Figure 1
Figure 1
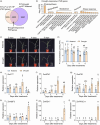
Disruption of ZmPHR1 results in maize sensitivity to Pi starvation. (a) Neighbor‐joining tree of proteins with shared MYB and coiled‐coil (CC) domains. The bootstrap consensus tree inferred from 1,000 replicates represents the evolutionary history of PHR proteins in maize, rice, and Arabidopsis. (b) Structures of ZmPHR1 and ZmPHR2 proteins showing MYB and CC domains. Numbers refer to the positions of the first or last amino acid in the complete protein, MYB domain, and CC domain. (c) Gene expression patterns of ZmPHR1 and ZmPHR2. Data from previous reports (Stelpflug et al., 2016). (d) Phenotypic comparison of zmphr1 mutants and wild‐type plants (WT) under HP and LP conditions. Bars = 20 cm. (e, f) Fresh weight (e) and P concentration (f) of zmphr1 mutants and the WT grown under HP and LP conditions. Values represent means ± SE, and different letters represent differences (P < 0.05) determined by one‐way ANOVA with Tukey's multiple comparisons tests. (g) Quantification of P concentration in fifth leaves of seedlings grown under HP and LP conditions based on micro x‐ray fluorescence.
Figure 2
Figure 2
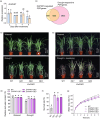
Overexpression of ZmPHR1 enhances maize P concentration and yields. (a) qRT‐PCR analysis of ZmPHR1 expression in ZmPHR1‐OE lines. (b, c) Phenotypic comparison of ZmPHR1‐OE lines and the WT under HP and LP conditions. (d, e) Fresh weight (d) and Pi concentration (e) of ZmPHR1‐OE lines and the WT grown under HP and LP conditions. (f) Quantification of P concentration in fifth leaves of ZmPHR1‐OE lines and the WT by micro x‐ray fluorescence. (g) P concentration of leaves of plants at the silking stage under field conditions. (h) Typical ears of ZmPHR1‐OE lines and the WT at the full‐ripe stage. Bars = 5 cm. (i, j) Comparisons of grain yield (i) and hundred‐grain weight (j) between ZmPHR1‐OE lines and the WT grown under field conditions. Values represent means ± SE. In (d, e, g, i, j), different letters represent differences (P < 0.05) determined by one‐way ANOVA with Tukey's multiple comparisons tests.
Figure 3
Figure 3
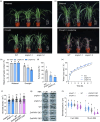
Examination of the effect of ZmPHR1 on maize transcriptomes under Pi‐sufficient and Pi‐deficient conditions. (a, b) Differentially expressed genes (DEGs) in roots (a) and fourth leaves (b) of WT and ZmPHR1‐OE lines under HP or LP conditions (FDR <0.05, fold change ≥1.5). (c, d) Venn diagrams showing the overlap between DEGs regulated by low‐Pi stress and ZmPHR1 in roots (c) and fourth leaves (d). (e) Functional classification of ZmPHR1‐regulated PSR genes based on GO annotations. (f–i) qRT‐PCR analysis of ZmSPXs (f), ZmPTs (g), ZmPHOS4 (h), and ZmVPT (i) in ZmPHR1‐OE lines and the WT under HP and LP conditions. Values represent means ± SE, and different letters represent differences (P < 0.05) determined by one‐way ANOVA with Tukey's multiple comparisons tests.
Figure 4
Figure 4
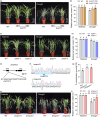
PSR genes participate in maize drought tolerance. (a) Venn diagram showing the overlap of genes transcriptionally regulated by Pi starvation and drought stress. FDR <0.05, fold change ≥1.5. (b) Functional classification of drought‐responsive PSR genes based on GO annotations. (c) Phenotypes of wild‐type seedlings grown under well‐watered and drought conditions. (d) Pi concentration of second leaves of wild‐type seedlings grown under the same conditions as in (c). (e–j) Transcript levels of PSR genes (e–g) and drought‐responsive genes (h–j) in second leaves of wild‐type seedlings grown under the same conditions as in (c). Values represent means ± SE. In (d–j), different letters represent differences (P < 0.05) determined by one‐way ANOVA with Tukey's multiple comparisons tests.
Figure 5
Figure 5
ZmPHR1 improves maize drought tolerance. (a) qRT‐PCR analysis of ZmPHR1 expression in maize seedlings under drought conditions. (b) Venn diagram showing the overlap of PSR genes regulated by ZmPHR1 and drought stress in wild‐type leaves. FDR <0.05, fold change ≥1.5. (c) Drought tolerance of ZmPHR1‐OE plants compared with the WT. Representative photographs were taken under well‐watered and drought conditions. (d) Relative leaf water content of ZmPHR1‐OE and the WT under the same conditions as in (c). (e) Drought tolerance of ZmPHR1‐OE plants compared with the WT. Representative photographs were taken under well‐watered and drought‐rewatering conditions. (f) Survival rate of ZmPHR1‐OE and the WT after rehydration as shown in (e). Values represent means ± SE. In (a), (d), and (f), different letters represent differences (P < 0.05) determined by one‐way ANOVA with Tukey's multiple comparisons tests. (g) Water loss rates from detached leaves at indicated time points. Data were obtained from the ninth leaves of each genotype with three replicates. Asterisks (*P < 0.05; **P < 0.01; Student's t‐test) indicate a significant difference between ZmPHR1‐OE lines and WT.
Figure 6
Figure 6
Knockout of ZmPHR1 reduces maize drought tolerance, and ZmPHR1 regulates maize stomatal closure. (a) Drought sensitivity of zmphr1 mutants compared with the WT. Representative photographs were taken under well‐watered and drought conditions. (b) Relative leaf water contents of zmphr1 mutants and the WT under the same conditions as in (a). (c) Drought sensitivity of zmphr1 mutants compared with the WT. Representative photographs were taken under well‐watered and drought‐rewatering conditions. (d) Survival rates of zmphr1 mutants and the WT after rehydration as shown in (c). (e) Water loss rates from detached leaves at indicated time points. Data were obtained from nine leaves of each genotype with three replicates. Asterisks (*P < 0.05; **P < 0.01; Student's t‐test) indicate a significant difference between the zmphr1 mutant and WT. (f) Stomatal density of the first fully expanded leaf of different genotypes (V1 stage). (g) Representative images of stomata from zmphr1 mutants, ZmPHR1‐OE lines, and the WT with or without ABA. First fully expanded leaves of seedlings (V1 stage) were immersed in MES–KOH buffer in the light for 2 h, and 10 μM ABA was then added with 2 h of incubation before being photographed. Bars = 5 μm. (h) Quantification of stomatal apertures with or without 10 μM ABA. Two hundred stomata of four leaves from four seedlings were measured in one representative experiment. Values represent means ± SE. In (b), (d), (f), and (h), different letters represent differences (P < 0.05) determined by one‐way ANOVA with Tukey's multiple comparisons tests.
Figure 7
Figure 7
Comparison of drought‐tolerant phenotypes of ZmPT7‐OE lines, zmpt7 and zmspx3 mutants, and wild‐type plants. (a) Drought tolerance of ZmPT7‐OE lines compared with the WT. (b) Relative leaf water contents of ZmPT7‐OE lines and the WT under drought conditions. (c) Drought‐sensitive phenotypes of zmpt7 mutants compared with the WT. (d) Relative leaf water contents of zmpt7 mutants and the WT under drought conditions. (e) Diagram of ZmSPX3 showing the target site (M) for CRISPR/Cas9 technology. Coding and untranslated regions of ZmSPX3 are indicated by black boxes and gray lines, respectively. (f) CRISPR/Cas9‐generated zmspx3 mutants. Mutations of ZmSPX3 in the zmspx3 mutants were evaluated by sequencing and are indicated by blue letters. (g) Pi concentration of fourth leaves of zmspx3 mutants and the WT (V4 stage) under well‐watered conditions. (h) Drought‐tolerant phenotypes of zmspx3 mutants compared with the WT. (i) Relative leaf water contents of zmspx3 mutants and the WT under drought conditions. Values represent means ± SE. In (b), (d), (g), and (i), different letters represent differences (P < 0.05) determined by one‐way ANOVA with Tukey's multiple comparisons tests.

References

    1. Amanullah , Asif, M. , Nawab, K. , Shah, Z. , Hassan, M. , Khan, A.Z. , Khalil, S.K. et al. (2010) Impact of planting density and P‐fertilizer source on the growth analysis of maize. Pak. J. Bot. 42, 2349–2357.
    1. Burman, U. , Garg, B.K. and Kathju, S. (2009) Effect of phosphorus application on clusterbean under different intensities of water stress. J. Plant Nutr. 32, 668–680.
    1. Bustos, R. , Castrillo, G. , Linhares, F. , Puga, M.I. , Rubio, V. , Pérez‐Pérez, J. , Solano, R. et al. (2010) A central regulatory system largely controls transcriptional activation and repression responses to phosphate starvation in Arabidopsis. PLoS Genet. 6, e1001102. - PMC - PubMed
    1. Chen, Y.F. , Li, L.Q. , Xu, Q. , Kong, Y.H. , Wang, H. and Wu, W.H. (2009) The WRKY6 transcription factor modulates PHOSPHATE1 expression in response to low Pi stress in Arabidopsis . Plant Cell 21, 3554–3566. - PMC - PubMed
    1. Daryanto, S. , Wang, L.X. and Jacinthe, P.A. (2016) Global synthesis of drought effects on maize and wheat production. PLoS One 11, e0156362. - PMC - PubMed

LinkOut - more resources