. 2024 Aug 1;45(11):e26762.
doi: 10.1002/hbm.26762.

Sensitivity and specificity of the action observation network to kinematics, target object, and gesture meaning

Affiliations

Sensitivity and specificity of the action observation network to kinematics, target object, and gesture meaning

Francesca Simonelli et al. Hum Brain Mapp. .

Abstract

Hierarchical models have been proposed to explain how the brain encodes actions, whereby different areas represent different features, such as gesture kinematics, target object, action goal, and meaning. The visual processing of action-related information is distributed over a well-known network of brain regions spanning separate anatomical areas, attuned to specific stimulus properties, and referred to as action observation network (AON). To determine the brain organization of these features, we measured representational geometries during the observation of a large set of transitive and intransitive gestures in two independent functional magnetic resonance imaging experiments. We provided evidence for a partial dissociation between kinematics, object characteristics, and action meaning in the occipito-parietal, ventro-temporal, and lateral occipito-temporal cortex, respectively. Importantly, most of the AON showed low specificity to all the explored features, and representational spaces sharing similar information content were spread across the cortex without being anatomically adjacent. Overall, our results support the notion that the AON relies on overlapping and distributed coding and may act as a unique representational space instead of mapping features in a modular and segregated manner.

Keywords: action observation network; action representation; d prime; fMRI; representational similarity analysis.


Conflict of interest statement

The authors declare no conflicts of interest.

Figures
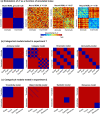
FIGURE 1
FIGURE 1
Categorical models used to obtain d′ values. The sensitivity index d′ is computed by comparing the average between‐category dissimilarity (in red) with the average within‐category dissimilarity (in blue). If a voxel is attuned to a categorical dimension, the average dissimilarity across blue squares should be lower than the average dissimilarity across red squares, resulting in a higher d′ value. (a) Examples of d′ computed by comparing simulated data with increasing noise levels (from left to right) to the animacy model; d′ increases as a function of between‐category dissimilarity. (b) Models tested in the first experiment: the animacy model assessed voxel tuning to animacy of the target object; the kinematic model tested voxel tuning to movement type, independently of the action target; the category model tested voxel tuning to target semantic domain; the granularity model is built on the specific combination of movement type and animacy dimension of the target, describing a higher level of specificity in the action hierarchy. (c) Models tested in the second experiment: the transitivity model assessed voxel tuning to transitive actions using a different set of stimuli to demonstrate the reliability of voxel response; the object identity model assessed generalizability of voxel tuning to object properties and the level of specificity in their representational content; symbolic and nonsense models tested discriminability of intransitive gestures to evaluate the specificity of voxel tuning.
FIGURE 2
FIGURE 2
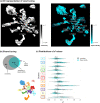
(a) Areas showing significant sensitivity to all action features (i.e., granularity model): voxels were selected by computing d′ on the RDM (q < 0.01, FDR corrected). (b) Selected voxels were projected as points in a 2D embedding space defined on RDM similarities, using t‐SNE: the relative distance of voxels/points reflects similarities in the representational space; based on the spatial distance between their projections in the embedding space, voxels were grouped into 11 clusters using the k‐means algorithm. L, left; R, right; FrontOper, frontal operculum; OTS, occipito‐temporal sulcus; dPreCS, dorsal precentral sulcus; PostCS, postcentral sulcus; FusG, fusiform gyrus; Ling, lingual gyrus; Mid CC, middle cingulate cortex; MOG, middle occipital gyrus; ParOper, parietal operculum; PeriCalc, pericalcarine cortex; pIFS, posterior inferior frontal sulcus; pMTG, posterior middle temporal gyrus; PostCG, postcentral gyrus; PreCG, precentral gyrus; PreCun, precuneus; pSTS, posterior superior temporal sulcus; TOS, transverse occipital sulcus.
FIGURE 3
FIGURE 3
(a) Dimensions describing the first set of stimuli were mapped using the p‐value associated with d′ onto the space defined by the t‐SNE; the kinematic dimension was coded in red, the animacy in green, and the object category in blue; maximal saturation of each channel reflects an uncorrected p < 1E−08. (b) The Venn diagram represents the proportion of voxels with a statistically significant d′ (p < .05) for the kinematic, animacy, and category dimensions. (c) d′ distributions and clusters averages (black dot) for the animacy, kinematic, and category dimensions; bootstrap confidence intervals (95%) were computed for each d′ value and averaged across voxels (solid black line) within a cluster; the average critical value at α = 0.05 (dotted line) was obtained from the null distribution.
FIGURE 4
FIGURE 4
(a) Voxels tuning to transitive actions was further tested using an independent dataset, and p‐values from the second set were mapped onto the same 2D space. Voxels associated with p‐values <.05 were mapped in white. Sensitivity to the object‐identity feature was also mapped, and voxels associated with p‐values <.05 were colored in cyan. (b) The Venn diagram represents the proportion of voxels associated with a statistically significant d′ (p < .05) for transitivity and object identity. (c) d′ distributions and clusters averages (black dot) with 95% bootstrap confidence intervals for transitivity and object identity dimensions; dotted lines represent the average critical value at α = 0.05 obtained from the null distribution.
FIGURE 5
FIGURE 5
Multidimensional scaling for clusters 2 and 5 from the ventral stream, and 4 and 9 for the dorsal stream. Multidimensional scaling was performed on the RDM constructed using data from all the voxels of the cluster. Euclidean distances between markers reflect activity pattern similarity between stimuli. (a) First experiment: action type is coded by symbols, while animacy and object category are color‐coded; in clusters 2 and 5, animate and inanimate objects are further apart, reflecting higher d′ for the animacy model, while the effect for object category is weaker, but still present; in clusters 4 and 9, stimuli are grouped closer together based on kinematic features, rather than object‐related dimensions. (b) Second experiment: action type is coded by symbols, object identity is color‐coded, and dashed lines connect markers representing the same object.
FIGURE 6
FIGURE 6
(a) The same voxels identified through their tuning to transitive action features were tested for sensitivity to other action dimensions (meaning of intransitive actions), and the relative contribution of voxels' sensitivity from symbolic to nonsense gestures was mapped with a color scale ranging from red to blue; maximal saturation of each channel reflects an uncorrected p < 1E−06. (b) The Venn diagram represents the proportion of voxels significantly attuned (p < .05) to symbolic and nonsense gestures. (c) d′ distributions and clusters averages (black dot) for the symbolic and nonsense features; bootstrap confidence intervals (95%) were computed for each d′ value and averaged across voxels (solid black line) within a cluster; the dotted line represents the average critical value at α = 0.05 obtained from the null distribution.

References

    1. Avants, B. B. , Tustison, N. , & Song, G. (2009). Advanced normalisation tools (ANTS). Insight Journal, 2(365), 1–35.
    1. Baldauf, D. , & Desimone, R. (2014). Neural mechanisms of object‐based attention. Science, 344(6182), 424–427. - PubMed
    1. Bedini, M. , & Baldauf, D. (2021). Structure, function and connectivity fingerprints of the frontal eye field versus the inferior frontal junction: A comprehensive comparison. European Journal of Neuroscience, 54(4), 5462–5506. - PMC - PubMed
    1. Benjamini, Y. , & Yekutieli, D. (2001). The control of the false discovery rate in multiple testing under dependency. Annals of Statistics, 29, 1165–1188.
    1. Caspers, S. , Zilles, K. , Laird, A. R. , & Eickhoff, S. B. (2010). ALE meta‐analysis of action observation and imitation in the human brain. NeuroImage, 50(3), 1148–1167. - PMC - PubMed