. 2024 Aug 6;24(16):3826-3839.
doi: 10.1039/d4lc00287c.

Monomeric and oligomeric amyloid-β cause distinct Alzheimer's disease pathophysiological characteristics in astrocytes in human glymphatics-on-chip models

Affiliations

Monomeric and oligomeric amyloid-β cause distinct Alzheimer's disease pathophysiological characteristics in astrocytes in human glymphatics-on-chip models

Aria R Yslas et al. Lab Chip. .

Abstract

Alzheimer's disease (AD) is marked by the aggregation of extracellular amyloid-β (Aβ) and astrocyte dysfunction. For Aβ oligomers or aggregates to be formed, there must be Aβ monomers present; however, the roles of monomeric Aβ (mAβ) and oligomeric Aβ (oAβ) in astrocyte pathogenesis are poorly understood. We cultured astrocytes in a brain-mimicking three-dimensional (3D) extracellular matrix and revealed that both mAβ and oAβ caused astrocytic atrophy and hyper-reactivity, but showed distinct Ca2+ changes in astrocytes. This 3D culture evolved into a microfluidic glymphatics-on-chip model containing astrocytes and endothelial cells with the interstitial fluid (ISF). The glymphatics-on-chip model not only reproduced the astrocytic atrophy, hyper-reactivity, and Ca2+ changes induced by mAβ and oAβ, but recapitulated that the components of the dystrophin-associated complex (DAC) and aquaporin-4 (AQP4) were properly maintained by the ISF, and dysregulated by mAβ and oAβ. Collectively, mAβ and oAβ cause distinct AD pathophysiological characteristics in the astrocytes.


Conflict of interest statement

There are no conflicts to declare.

Figures

Fig. 1
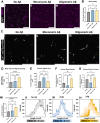
Fig. 1. Astrocytic atrophy and reactivity changes in astrocytes exposed to monomeric and oligomeric Aβ. (A) A schematic of our initial 3D culture of astrocytes. (Ai) Human astrocytes were cultured in 3D ECM in chambers on a glass coverslip, (Aii) with brain-mimicking ECM components including collagen I, hyaluronan, and fibronectin. (B) Immunostaining astrocytes with phalloidin (F-actin staining), anti-nestin antibodies, and DAPI. The astrocytes were exposed to either no Aβ (B), monomeric (C), or oligomeric Aβ (D). (E) Changes in actin signal area per cell by monomeric or oligomeric Aβ. (F) Changes in total actin signal intensity by monomeric or oligomeric Aβ. (G) Changes in roundness by monomeric or oligomeric Aβ. (H) Changes in astrocytic reactivity by monomeric or oligomeric Aβ, as measured by nestin signal intensity relative to actin signal intensity. Scale bars (B–D) = 200 μm. * (p < 0.05), ** (p < 0.01), *** (p < 0.001), and **** (p < 0.0001) indicate statistical significance. ns = not significant.
Fig. 2
Fig. 2. Intracellular Ca2+ changes in astrocytes exposed to monomeric and oligomeric Aβ. Immunofluorescent imaging of the astrocytes (A) indicated an increase in transcription factor NFAT1 (nuclear factor of activated T-cells 1) relative to DAPI signal in astrocytes exposed to (Aii) monomeric Aβ compared to (Aiii) oligomeric Aβ and (Ai) no Aβ exposure. (B) Despite having similar values, astrocytes cultured with oligomeric Aβ did not experience a statistically significant increase in NFAT1, a component of the calcium/calcineurin signaling pathway, while astrocytes cultured with monomeric Aβ did. (C) Live cell calcium ion (Ca2+) imaging revealed intracellular calcium differences in the three groups of astrocytes (Ci–iii). (D) Notably, astrocytes exposed to oligomeric Aβ had a strong increase (∼2-fold) in intracellular Ca2+ signal compared to both other astrocyte conditions. The (E) area, (F) signal intensity relative to signal area, and signal shape parameters of (G) circularity were quantified. In all three quantifications (E–G), astrocytes exposed to monomeric Aβ experienced differences compared to the other conditions. (E) Astrocytes exposed to mAβ had larger Ca2+ signal areas, which led to (F) much lower signal density compared to oAβ astrocytes. The (G) circularity of Ca2+ signals in the mAβ was statistically lower than the other conditions, indicative of a more branched signal pattern, perhaps throughout the entire cell instead of focused in one specific location. (H) Astrocytes exposed to oligomeric Aβ also experienced greater transients in intracellular Ca2+ compared to the other conditions as measured by variation in the signal intensity across the cell over time. The summary figure is shown in Hi while representative traces of the Ca2+ signal across the length of cells are shown in Hii–iv. All traces are shown in Fig. S2, and the time progression is shown by dark to light color progression (darkest color is time = 0 minutes and lightest color is time = 5 minutes). Both increased intracellular Ca2+ concentration and increased Ca2+ transients are known to be found in AD. Scale bars (A and C) = 200 μm. * (p < 0.05), ** (p < 0.01), *** (p < 0.001), and **** (p < 0.0001) indicate statistical significance. ns = not significant.
Fig. 3
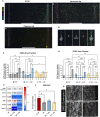
Fig. 3. Glymphatics-on-chip model with RT-qPCR results. (Ai) The top view of the glymphatics-on-chip model illustrates the two directionalities of microfluidic flow. Luminal fluid flow (green arrow) is bidirectional throughout the chip. Convective interstitial fluid flow (red arrow) is induced from the left channel to the right channel, mirroring the periarterial to perivenous directionality of the glymphatic system. (Aii) The glymphatics-on-chip model's cross-sectional view illustrates how the interstitial fluid flow is induced via hydrostatic pressure differences in the media reservoirs. (B) Immunofluorescence microscopy image of the microfluidic glymphatics-on-chip model. It has two channels seeded with human primary blood endothelial cells (BECs, expressing CD31) embedded in a biomimetic ECM reservoir laden with human primary astrocytes (expressing GFAP throughout and AQP4 at their endfeet). Amyloid-β can be seeded into the ECM, drug treatment can be perfused via media through the two channels, and interstitial fluid flow can be induced from one channel to the other. (C) An immunofluorescence microscopy image of the 3D engineered blood vessel in the glymphatics-on-chip. (D) The gross structure of the glymphatic system, which mirrors our glymphatics-on-chip model. (E) RT-qPCR results illustrating different regulations of the DAC components after our device was exposed to 16 hours of inducible ISF compared to no ISF. ARNT, a reference gene; AQP4 (aquaporin-4), the water pore anchored by the complex; DAG1 (dystroglycan 1), one of the transmembrane and extracellular components of the complex; DMD (dystrophin), the protein that links the transmembrane components to the intracellular cytoskeleton; DTNA (dystrobrevin), a protein that binds to dystrophin and allows the formation of the dystrobrevin/syntrophin triplet; SNTA1 (α-1-syntrophin), a protein that binds to both dystrophin and dystrobrevin and is involved in signal coordination for multiple molecules. (F) RT-qPCR results illustrating different regulations of the cytoskeletal component, STMMN1, a protein involved in destabilizing microtubules, in the presence of ISF with or without mAβ or oAβ. (G) RT-qPCR results illustrating different regulations of the ion channel and transporters in the presence of ISF with or without mAβ or oAβ. KCNIP4, a voltage-gated K+ channel-interacting protein 4; MLC1, a membrane transport protein expressed in astrocytes; SLC1A2, a glutamate transporter; SLC4A4, a sodium bicarbonate transporter. Scale bars (B) = 2 mm, (C) = 200 μm.
Fig. 4
Fig. 4. Glymphatics-on-chip system reveals spatial protein expression and RNA expression differences as a co-culture system. Following 16 hours of induced interstitial flow in the co-culture glymphatics-on-chip system, the samples were either prepared for immunofluorescent microscopy (A) or used for RT-qPCR (E). (A) Qualitative analysis of the IF images seems to show AQP4 polarization, especially to the right channel (“PV”) in the no Aβ control (Ai). Distinct GFAP and CD31 signals indicate that the astrocytes and BECs, respectively, maintained their identity in the co-culture devices across all treatment groups (Ai–iii). (B) For quantification, each image was split into five equal-width portions and labeled 1–5, left to right. Portions 1 and 5 are considered perivascular. (C) Quantitative analysis of the AQP4 area fractions of the ECM reservoir shows AQP4 polarization in the ISF no Aβ control group while values closer to 20% (dashed line) across all portions, indicating depolarization, were found in the two groups exposed to Aβ. (D) GFAP expression patterns were fairly consistent across all groups, with polarization in all groups. (E) RT-qPCR results of AQP4 and the DAC components, including DAG1 (dystroglycan), DMD (dystrophin), DTNA (dystrobrevin), and SNTA1 (α-1-syntrophin) with ARNT as the reference gene/protein. (F) Quantitative analysis of DMD (dystrophin) expression via IF imaging, normalized by DAPI expression in each image. (G) Representative images of DMD expression in the three ISF groups and the no ISF control. Scale bars (A) = 2 mm, (G) = 25 μm. * (p < 0.05), ** (p < 0.01), *** (p < 0.001), and **** (p < 0.0001) indicate statistical significance. ns = not significant.

References

    1. Schneider L. S. Psychopharmacol. Bull. 2023;53:8–65. - PMC - PubMed
    1. De-Paula V. J. Radanovic M. Diniz B. S. Forlenza O. V. Subcell. Biochem. 2012;65:329–352. doi: 10.1007/978-94-007-5416-4_14. - DOI - PubMed
    1. Huang Y. Potter R. Sigurdson W. Santacruz A. Shih S. Ju Y. E. Kasten T. Morris J. C. Mintun M. Duntley S. Bateman R. J. Arch. Neurol. 2012;69:51–58. doi: 10.1001/archneurol.2011.235. - DOI - PMC - PubMed
    1. Iwatsubo T. Odaka A. Suzuki N. Mizusawa H. Nukina N. Ihara Y. Neuron. 1994;13:45–53. doi: 10.1016/0896-6273(94)90458-8. - DOI - PubMed
    1. Sehar U. Rawat P. Reddy A. P. Kopel J. Reddy P. H. Int. J. Mol. Sci. 2022;23:12924. doi: 10.3390/ijms232112924. - DOI - PMC - PubMed

Publication types