. 2024 Jul 22;137(8):188.
doi: 10.1007/s00122-024-04695-w.

Feature engineering and parameter tuning: improving phenomic prediction ability in multi-environmental durum wheat breeding trials

Affiliations

Feature engineering and parameter tuning: improving phenomic prediction ability in multi-environmental durum wheat breeding trials

Carina Meyenberg et al. Theor Appl Genet. .

Abstract

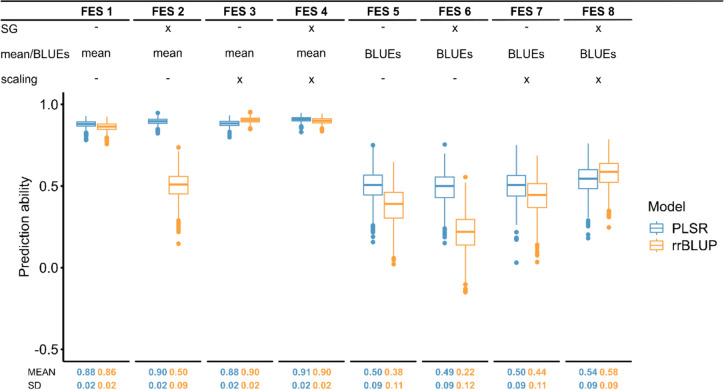
Optimized phenomic selection in durum wheat uses near-infrared spectra, feature engineering and parameter tuning. Our study reports improvements in predictive ability and emphasizes customized preprocessing for different traits and models. The success of plant breeding programs depends on efficient selection decisions. Phenomic selection has been proposed as a tool to predict phenotype performance based on near-infrared spectra (NIRS) to support selection decisions. In this study, we test the performance of phenomic selection in multi-environmental trials from our durum wheat breeding program for three breeding scenarios and use feature engineering as well as parameter tuning to improve the phenomic prediction ability. In addition, we investigate the influence of genotype and environment on the phenomic prediction ability for agronomic and quality traits. Preprocessing, based on a grid search over the Savitzky-Golay filter parameters based on 756,000 genotype best linear unbiased estimate (BLUE) computations, improved the phenomic prediction ability by up to 1500% (0.02-0.3). Furthermore, we show that preprocessing should be optimized depending on the dataset, trait, and model used for prediction. The phenomic prediction scenarios in our durum breeding program resulted in low-to-moderate prediction abilities with the highest and most stable prediction results when predicting new genotypes in the same environment as used for model training. This is consistent with the finding that NIRS capture both the genotype and genotype-by-environment ( G × E ) interaction variance.


Conflict of interest statement

The authors have not disclosed any competing interests.

Figures

Fig. 1
Fig. 1
Schematic overview of NIRS and trait data preprocessing including the feature engineering scenarios (FESs, A) and the Savitzky–Golay filter parameter tuning (B). Moreover, the three breeding scenarios evaluated in this study are depicted (C). A For the dataset ‘CP & SP combined’ and the traits grain yield (GY) and protein content (PC), eight FESs, each tested with the two prediction models partial least squares regression (PLSR) and ridge regression best linear unbiased prediction (rrBLUP) were evaluated to identify the FES resulting in the highest cross-validated prediction ability within the tested range of parameters. Therefore, a fivefold cross validation, with random assignment of genotypes to folds, replicated 1000 times was conducted. Simultaneously, the Savitzky–Golay filter parameter tuning was conducted to obtain the highest Savitzky–Golay filter parameter combination within the tested range of parameters. B For six durum wheat yield trial datasets and the datasets CP and SP, the Savitzky–Golay filter parameter tuning was conducted using the PLSR and rrBLUP prediction models to obtain the combination yielding the highest prediction ability based on the FES. C Three breeding scenarios were conducted in this study to assess the use of phenomic prediction in durum wheat breeding programs. Note that in all three breeding scenarios, the environment specifies a location-year combination. In scenario 1, near-infrared spectra (NIRS) and trait data of the training set (TS, e.g. late generation yield trial) and the NIRS of the prediction set (PS, e.g., early generation observation row), which contain each a different sets of genotypes, are obtained within the same environment. Based on the NIRS of the new genotypes, the phenomic estimated performance (PEP) of the new genotypes is predicted. In scenario 2, NIRS and trait data of the TS are obtained in one environment, while the NIRS of the PS are obtained in a new environment aiming to predict the phenotype performance of the same genotypes there, without testing them in large yield trial plots. In scenario 3, series genotype BLUEsNIRS and series genotype BLUEstrait are used as TS. A central environment, in which different (new) genotypes compared to the TS are grown, is used to obtain NIRS. Based on the obtained NIRS, the PEP across different environments is predicted. Between the PEP and the series genotype BLUEstrait, the Pearson's correlation is calculated, to evaluate the ability of that environment to predict the phenotype performance over the series of environments, as trait data are not evaluated in the parallel environments due to lacking seed in early generations of the breeding program
Fig. 2
Fig. 2
Overview of near-infrared spectra (NIRS), variance components and discriminant analysis of principal components (DAPC) shown separately for the CP and SP datasets. A Unprocessed NIRS of the CP and SP dataset, orange lines represent individual genotypes, while the black line indicates the arithmetic genotype meanNIRS. B Savitzky–Golay filtered genotype BLUEsNIRS. C Savitzky–Golay filtered as well as centered and scaled genotype BLUEsNIRS. D Proportion of genotype (blue), genotype-by-environment interaction (orange) and residual (green) variance of each wavelength along the NIRS of durum wheat grains. E The DAPC based on NIRS for CP and for SP, the coloring is based on the origin of the genotypes. The amount of variance explained by the first two linear discriminant (LD) functions is plotted below or next to the corresponding axis. F DAPC for CP and SP based on NIRS, with coloring according to the growing environments
Fig. 3
Fig. 3
Comparison of the prediction abilities obtained for the eight feature engineering scenarios (FESs) for the trait grain yield. ‘x’ shows that the respective feature (Savitzky–Golay filter (SG), mean or BLUEs and scaling) was included, while ‘–’ shows that the respective feature was not included in the FES. The cross-validated (CV) prediction abilities were obtained by fivefold CV with random assignment of genotypes to folds, replicated 1,000 times for the dataset ‘CP and SP combined’. Two prediction models namely ridge regression best linear unbiased prediction (rrBLUP) and partial least squares regression (PLSR) were used for the predictions. The CV prediction ability (MEAN) and the standard deviation (SD) are plotted below the corresponding FESs
Fig. 4
Fig. 4
The boxplot shows the prediction abilities for Scenario 1 for the trait grain yield within the 21 environments of the eight different durum wheat datasets obtained in a fivefold CV with 1,000 replicates. Here, the rrBLUP model and the best parameter combination for the Savitzky–Golay filter obtained in the FES 8 ‘Savitzky–Golay filtered genotype BLUEsNIRS scaled and genotype BLUEsgrain yield’ for each specific durum wheat dataset were used. Below the environments (ENV), the number of tested genotypes per environment (N), the mean CV prediction ability (MEAN) and the standard deviation (SD) is shown
Fig. 5
Fig. 5
The boxplot shows the prediction abilities obtained for Scenario 2 for the trait grain yield. Here, one environment was used as training environment (ENV) to predict all other environments containing the same genotypes, e.g., when EWE (SP dataset) is used as training environment, the phenotype performances of all other environments belonging to the SP dataset (JEA, HOH, ISL, PRU and REU) are predicted and the five prediction abilities are shown in the boxplot. For the predictions, the rrBLUP model and the best parameter combinations for the Savitzky–Golay filter obtained in the FES 8 ‘Savitzky–Golay filtered genotype BLUEsNIRS scaled & genotype BLUEsgrain yield’ were used. The arithmetic mean prediction abilities (MEAN) over all predicted environments are shown below the corresponding training environment. Same locations are plotted in the same color
Fig. 6
Fig. 6
Prediction results of Scenario 3. The different colors represent the different near-infrared spectra (NIRS) environments. Here, an example how to read this plot: genotype BLUEsNIRS and genotype BLUEsgrain yield of the CP series (‘Trainingset’, could be historical data for grain yield and NIRS) was used for model training and REU-SP was used as NIRS environment for the new genotypes, which was then used to predict the phenotype performance at a trial series (SP series)

References

    1. Barak P (1995) Smoothing and differentiation by an adaptive-degree polynomial filter. Anal Chem 67(17):2758–2762. 10.1021/ac00113a00610.1021/ac00113a006 - DOI
    1. Bates S, Hastie T, Tibshirani R (2023) Cross-validation: what does it estimate and how well does it do it? J Am Stat Assoc. 10.1080/01621459.2023.219768610.1080/01621459.2023.2197686 - DOI
    1. Beebe KR, Kowalski BR (1987) An introduction to multivariate calibration and analysis. Anal Chem 59(17):1007A. 10.1021/ac00144a00110.1021/ac00144a001 - DOI
    1. Beres BL, Rahmani E, Clarke JM, Grassini P, Pozniak CJ, Geddes CM, Porker KD, May WE, Ransom JK (2020) A systematic review of durum wheat: enhancing production systems by exploring genotype, environment, and management (G × E × M) synergies. Front Plant Sci 11:568657. 10.3389/fpls.2020.568657 10.3389/fpls.2020.568657 - DOI - PMC - PubMed
    1. Brault C, Lazerges J, Doligez A, Thomas M, Ecarnot M, Roumet P, Bertrand Y, Berger G, Pons T, François P, Le Cunff L, This P, Segura V (2022) Interest of phenomic prediction as an alternative to genomic prediction in grapevine. Plant Methods 18(1):108. 10.1186/s13007-022-00940-9 10.1186/s13007-022-00940-9 - DOI - PMC - PubMed

LinkOut - more resources